| Param | Original file | Final file |
|---|---|---|
| Filename | modeM0/AS1A05_221T01_9000002888_19426cztM0_level2.evt | modeM0/AS1A05_221T01_9000002888_19426cztM0_level2_quad_clean.evt |
| Size (bytes) | 501,232,320 | 69,753,600 |
| Size | 478.0 MB | 66.5 MB |
| Events in quadrant A | 3,364,341 | 424,778 |
| Events in quadrant B | 3,488,850 | 428,310 |
| Events in quadrant C | 3,386,310 | 413,550 |
| Events in quadrant D | 4,511,071 | 403,915 |
| Mode SS | |||
|---|---|---|---|
| Quadrant | BADHDUFLAG | Total packets | Discarded packets |
| A | 0 | 128 | 0 |
| B | 0 | 128 | 0 |
| C | 0 | 128 | 0 |
| D | 0 | 128 | 0 |
| Mode M9 | |||
|---|---|---|---|
| Quadrant | BADHDUFLAG | Total packets | Discarded packets |
| A | 0 | 15 | 0 |
| B | 0 | 16 | 0 |
| C | 0 | 16 | 0 |
| D | 0 | 16 | 0 |
| Mode M0 | |||
|---|---|---|---|
| Quadrant | BADHDUFLAG | Total packets | Discarded packets |
| A | 0 | 13828 | 2 |
| B | 0 | 14148 | 2 |
| C | 0 | 13774 | 2 |
| D | 0 | 17446 | 2 |
| Quadrant | Total seconds | Saturated seconds | Saturation percentage |
|---|---|---|---|
| A | 6327 | 126 | 1.991465% |
| B | 6327 | 138 | 2.181128% |
| C | 6327 | 128 | 2.023076% |
| D | 6327 | 192 | 3.034614% |
Noise dominated data is calculated using 1-second bins in cleaned event files. If a bin has >2000 counts, and if more than 50% of those come from <1% of pixels, then it is considered to be noise-dominated and hence unusable.
| Quadrant | # 1 sec bins | Bins with >0 counts | Bins with >2000 counts | High rate bins dominated by noise | Noise dominated (total time) | Noise dominated (detector-on time) | Marked lightcurve |
|---|---|---|---|---|---|---|---|
| A | 7577 | 6327 | 0 | 0 | 0.00% | 0.00% | 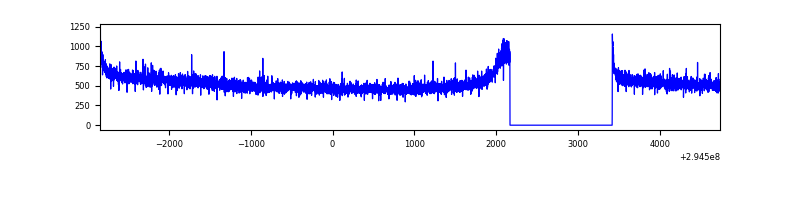 |
| B | 7577 | 6327 | 6 | 6 | 0.08% | 0.09% | 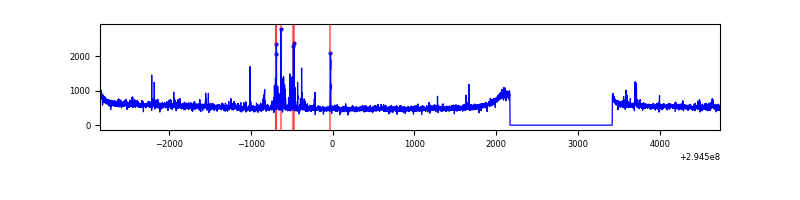 |
| C | 7577 | 6327 | 2 | 2 | 0.03% | 0.03% | 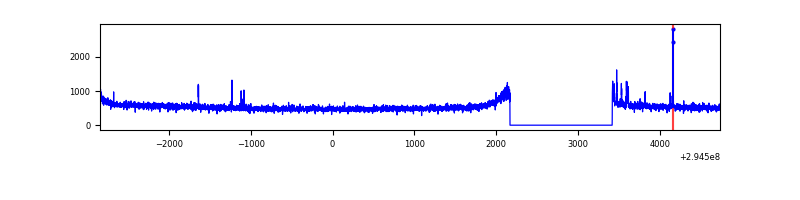 |
| D | 7577 | 6327 | 116 | 116 | 1.53% | 1.83% | 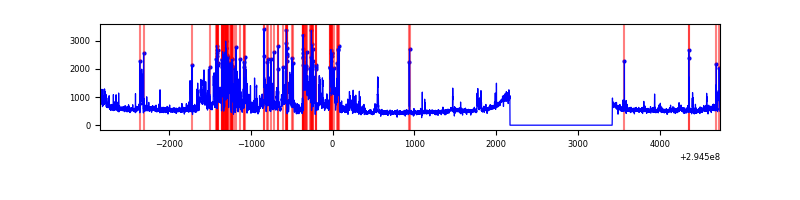 |
Top three noisy pixels from each quadrant. If the there are fewer than three noisy pixels in the level2.evt file, extra rows are filled as -1
| Pixel properties | Quadrant properties | ||||||
|---|---|---|---|---|---|---|---|
| Quadrant | DetID | PixID | Counts | Sigma | Mean | Median | Sigma |
| A | 8 | 205 | 14744 | 79.57 | 867 | 850 | 174.6 |
| A | 13 | 254 | 9988 | 52.33 | 867 | 850 | 174.6 |
| A | 0 | 226 | 7701 | 39.23 | 867 | 850 | 174.6 |
| B | 0 | 197 | 42241 | 255.86 | 858 | 839 | 161.8 |
| B | 0 | 198 | 18998 | 112.22 | 858 | 839 | 161.8 |
| B | 12 | 111 | 18500 | 109.14 | 858 | 839 | 161.8 |
| C | 14 | 238 | 129474 | 672.37 | 820 | 826 | 191.3 |
| C | 0 | 207 | 39101 | 200.04 | 820 | 826 | 191.3 |
| C | 3 | 233 | 15471 | 76.54 | 820 | 826 | 191.3 |
| D | 7 | 238 | 1159755 | 5770.06 | 838 | 818 | 200.9 |
| D | 12 | 218 | 137273 | 679.38 | 838 | 818 | 200.9 |
| D | 2 | 234 | 20701 | 98.99 | 838 | 818 | 200.9 |
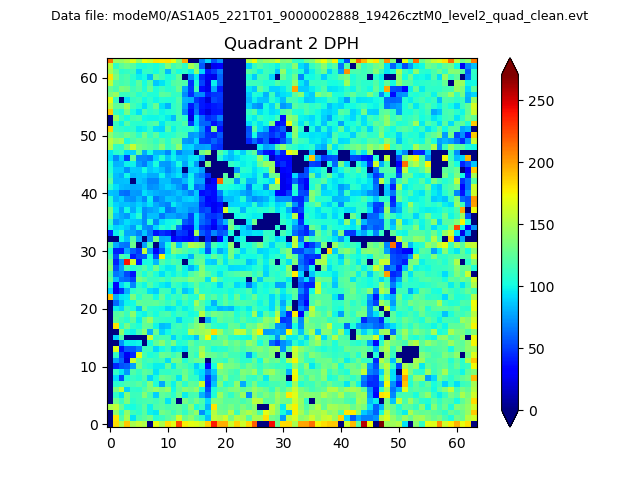
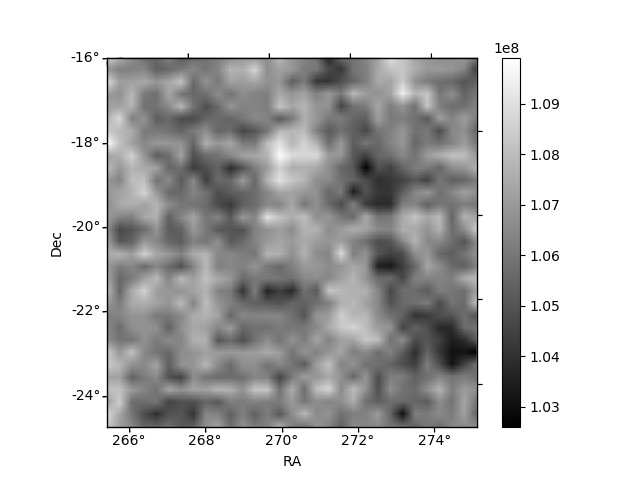
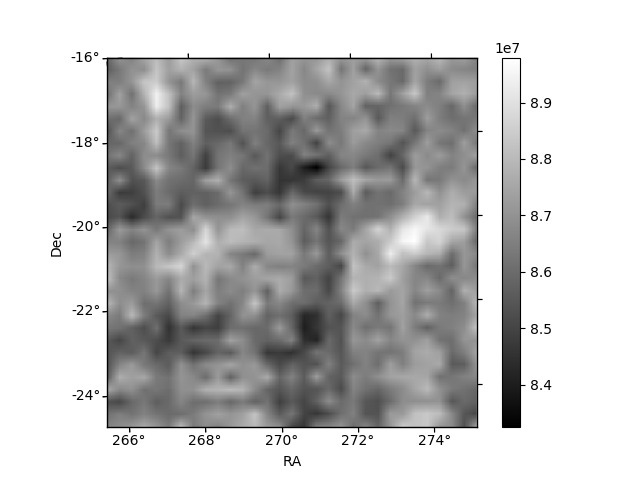
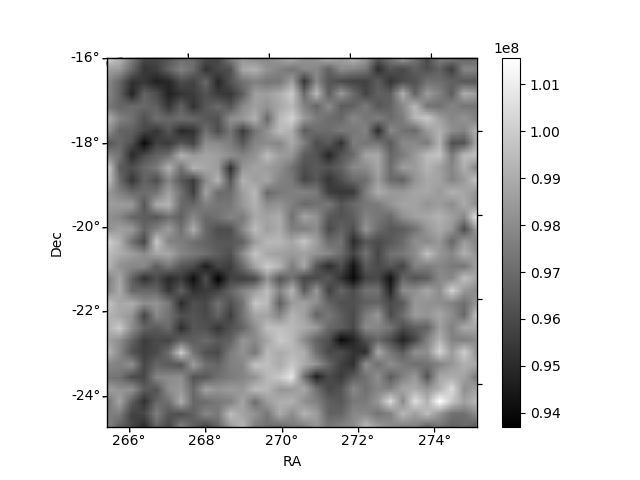
Histogram calculated using DETX and DETY for each event in the final _common_clean file
| Quadrant A | 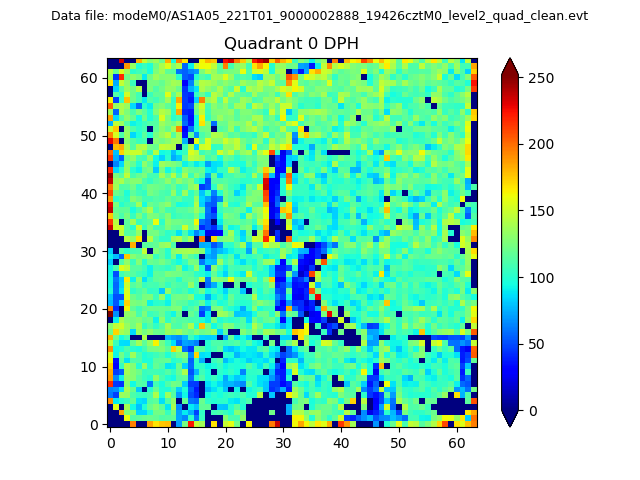 |
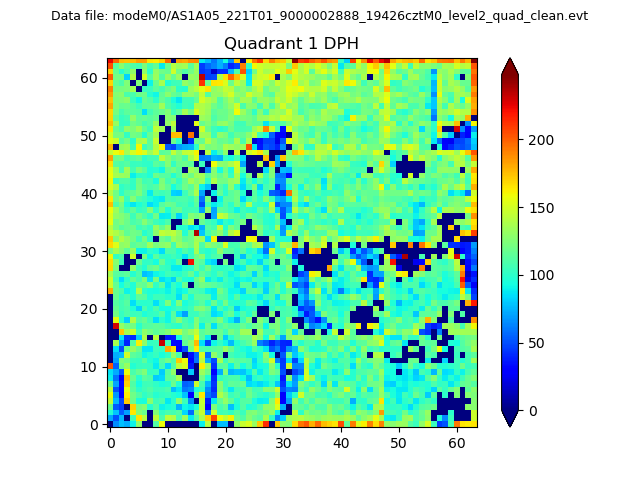 |
Quadrant B |
|---|---|---|---|
| Quadrant D | 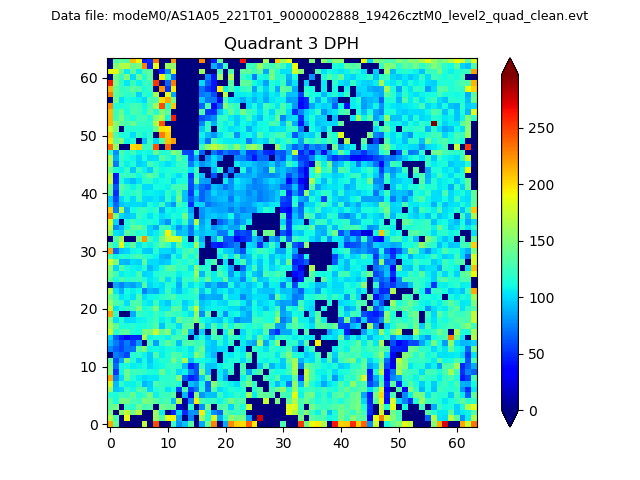 |
 |
Quadrant C |
| Plot type | Count rate plots | Images |
|---|---|---|
| Comparison with Poisson distribution Blue bars denote a histogram of data divided into 1 sec bins. Red curve is a Poisson curve with rate = median count rate of data. |
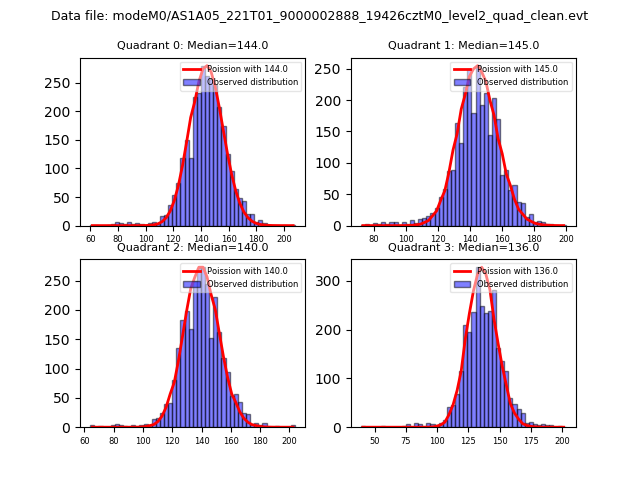 |
 |
| Quadrant-wise count rates Data is divided into 100 sec bins |
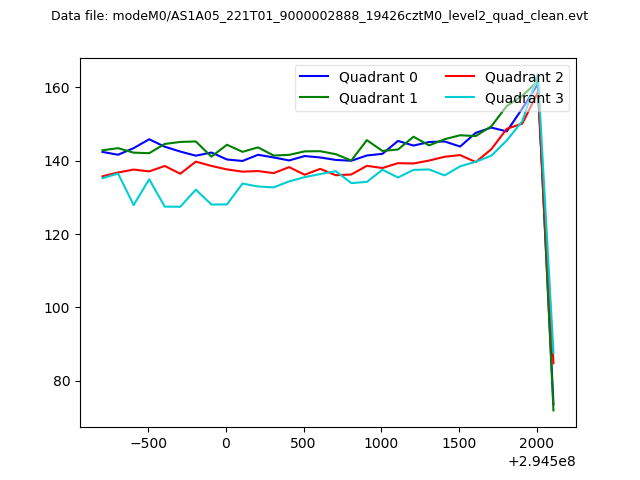 |
|
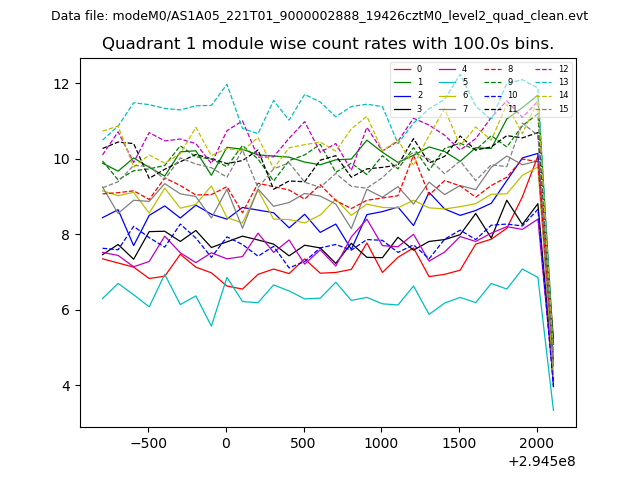
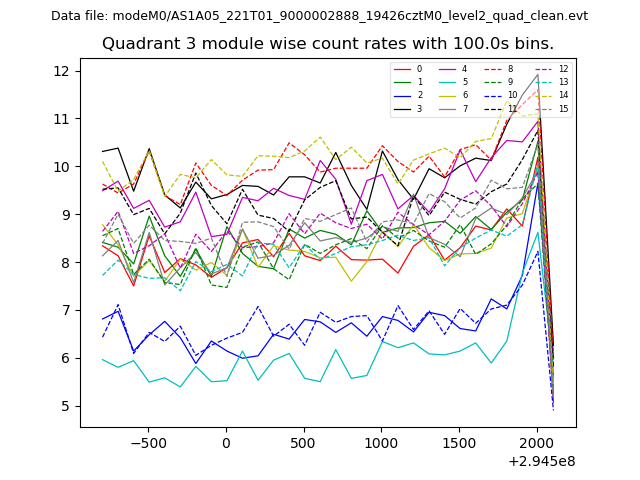
| Module-wise count rates for Quadrant A Data is divided into 100 sec bins |
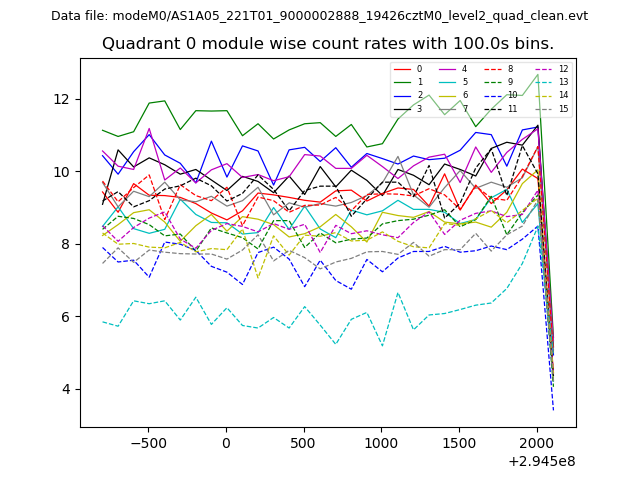 |
 |
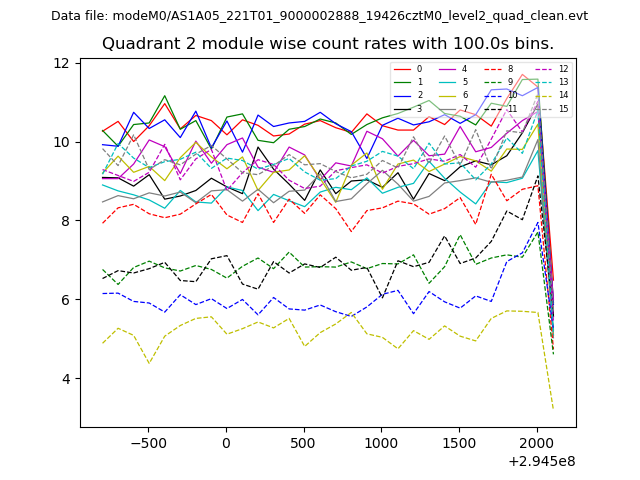
| Module-wise count rates for Quadrant B Data is divided into 100 sec bins |
 |
 |
| Module-wise count rates for Quadrant C Data is divided into 100 sec bins |
 |
 |
| Module-wise count rates for Quadrant D Data is divided into 100 sec bins |
 |
 |
| Parameter | Plot |
|---|---|
| CZT HV Monitor | 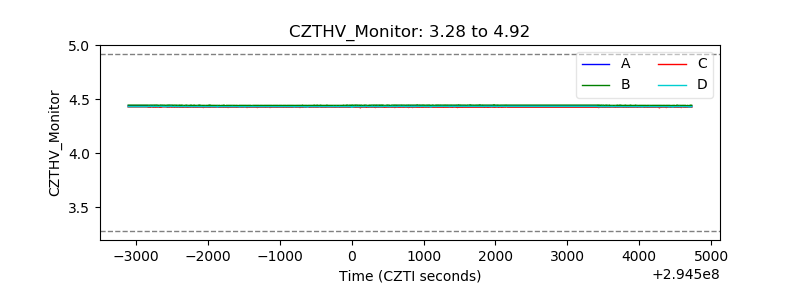 |
| D_VDD | 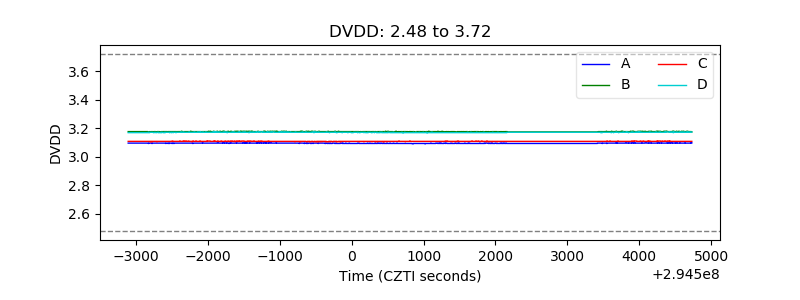 |
| Temperature 1 | 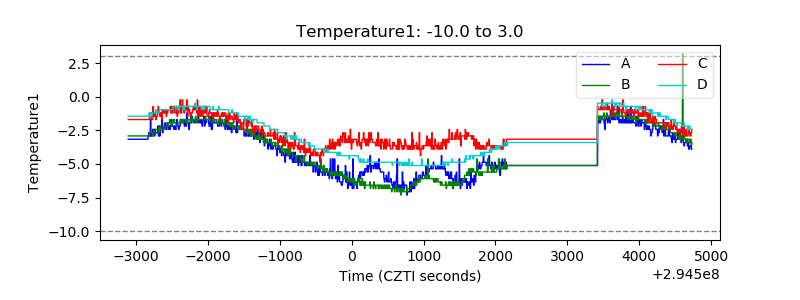 |
| Veto HV Monitor | 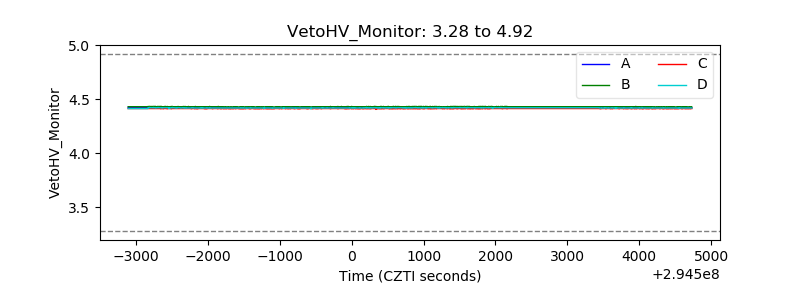 |
| Veto LLD | 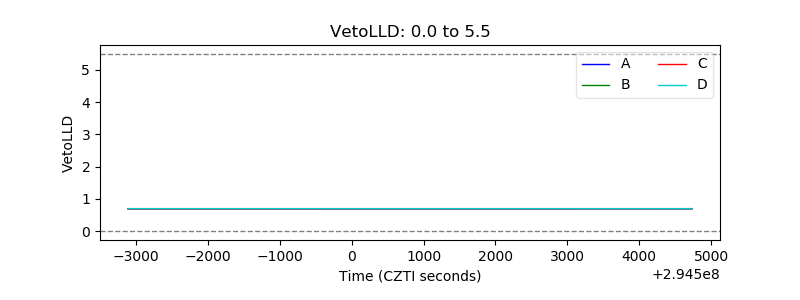 |
| Alpha Counter | 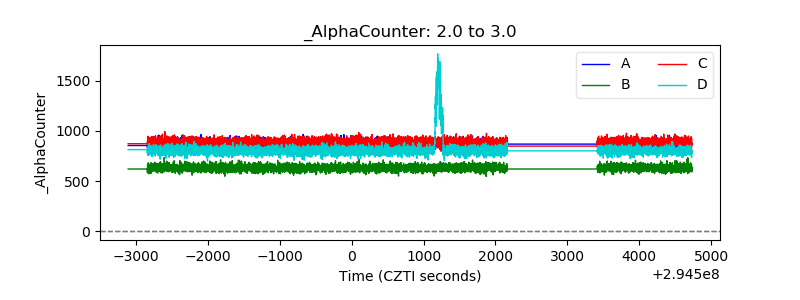 |
| _CPM_Rate | 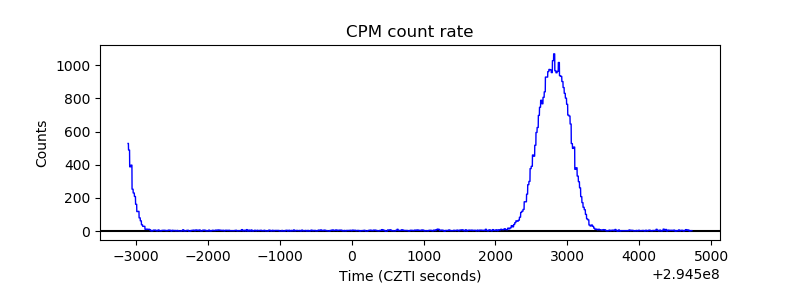 |
| CZT Counter | 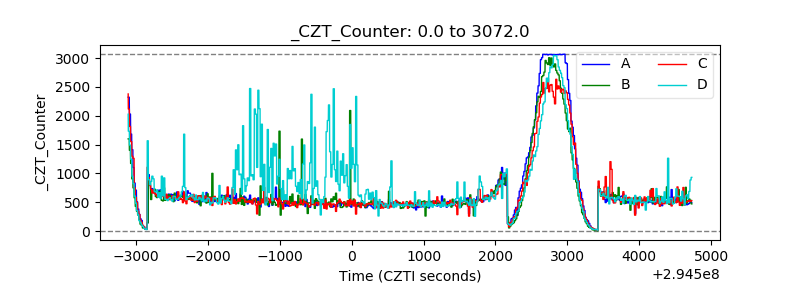 |
| +2.5 Volts monitor |  |
| +5 Volts monitor | 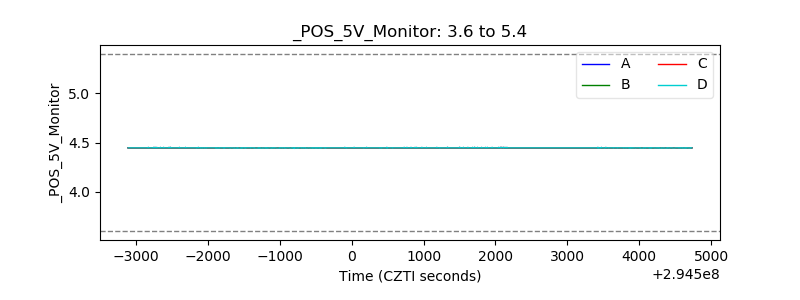 |
| _ROLL_ROT | 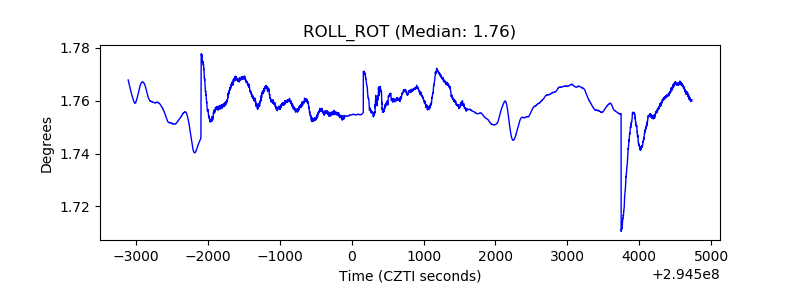 |
| _Roll_DEC | 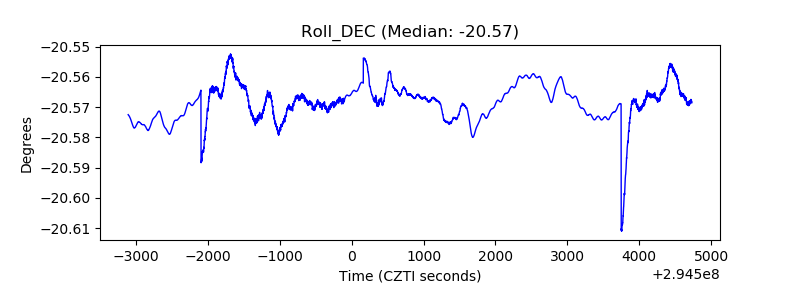 |
| _Roll_RA |  |
| Veto Counter | 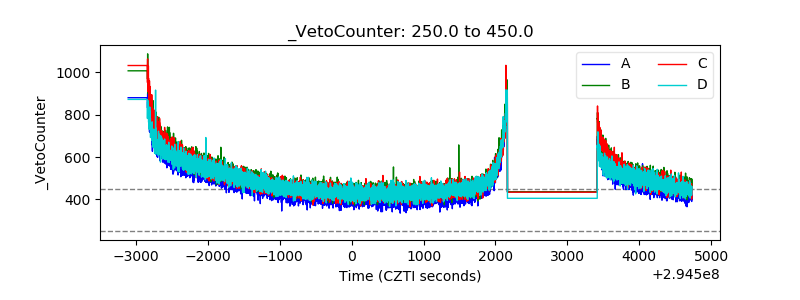 |