| Param | Original file | Final file |
|---|---|---|
| Filename | modeM0/AS1A05_221T01_9000002888_19427cztM0_level2.evt | modeM0/AS1A05_221T01_9000002888_19427cztM0_level2_quad_clean.evt |
| Size (bytes) | 498,576,960 | 78,946,560 |
| Size | 475.5 MB | 75.3 MB |
| Events in quadrant A | 3,279,716 | 492,644 |
| Events in quadrant B | 3,406,422 | 498,970 |
| Events in quadrant C | 3,724,788 | 481,018 |
| Events in quadrant D | 4,245,815 | 462,915 |
| Mode SS | |||
|---|---|---|---|
| Quadrant | BADHDUFLAG | Total packets | Discarded packets |
| A | 0 | 132 | 0 |
| B | 0 | 132 | 0 |
| C | 0 | 132 | 0 |
| D | 0 | 132 | 0 |
| Mode M9 | |||
|---|---|---|---|
| Quadrant | BADHDUFLAG | Total packets | Discarded packets |
| A | 0 | 15 | 0 |
| B | 0 | 16 | 0 |
| C | 0 | 16 | 0 |
| D | 0 | 16 | 0 |
| Mode M0 | |||
|---|---|---|---|
| Quadrant | BADHDUFLAG | Total packets | Discarded packets |
| A | 0 | 13701 | 2 |
| B | 0 | 13976 | 2 |
| C | 0 | 15018 | 2 |
| D | 0 | 16911 | 2 |
| Quadrant | Total seconds | Saturated seconds | Saturation percentage |
|---|---|---|---|
| A | 6525 | 77 | 1.180077% |
| B | 6525 | 97 | 1.486590% |
| C | 6524 | 215 | 3.295524% |
| D | 6524 | 279 | 4.276517% |
Noise dominated data is calculated using 1-second bins in cleaned event files. If a bin has >2000 counts, and if more than 50% of those come from <1% of pixels, then it is considered to be noise-dominated and hence unusable.
| Quadrant | # 1 sec bins | Bins with >0 counts | Bins with >2000 counts | High rate bins dominated by noise | Noise dominated (total time) | Noise dominated (detector-on time) | Marked lightcurve |
|---|---|---|---|---|---|---|---|
| A | 7510 | 6526 | 0 | 0 | 0.00% | 0.00% | 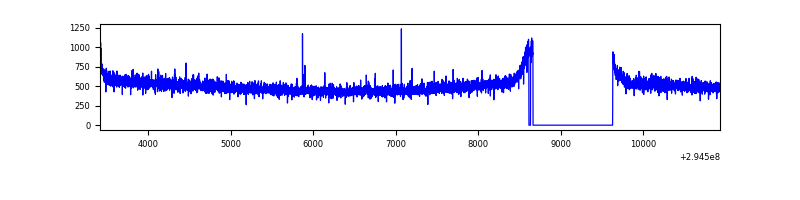 |
| B | 7510 | 6525 | 9 | 9 | 0.12% | 0.14% | 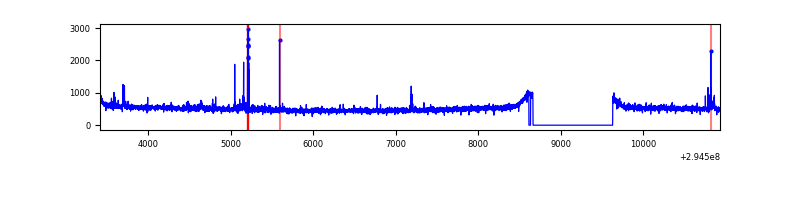 |
| C | 7509 | 6525 | 20 | 20 | 0.27% | 0.31% | 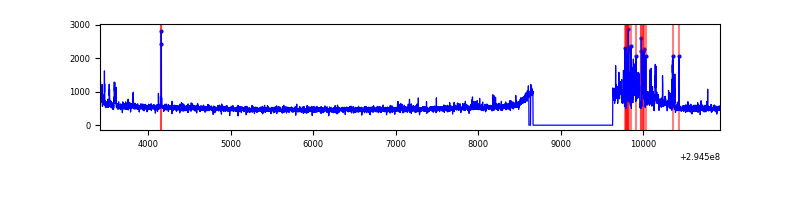 |
| D | 7509 | 6525 | 193 | 193 | 2.57% | 2.96% | 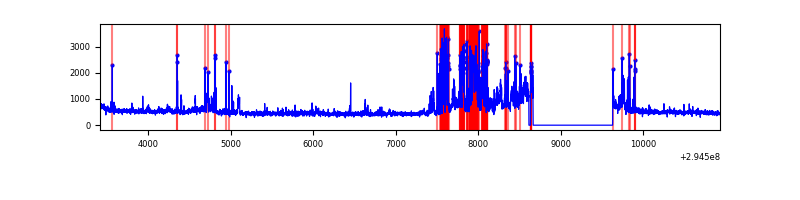 |
Top three noisy pixels from each quadrant. If the there are fewer than three noisy pixels in the level2.evt file, extra rows are filled as -1
| Pixel properties | Quadrant properties | ||||||
|---|---|---|---|---|---|---|---|
| Quadrant | DetID | PixID | Counts | Sigma | Mean | Median | Sigma |
| A | 13 | 254 | 10320 | 55.57 | 847 | 832 | 170.7 |
| A | 0 | 226 | 7403 | 38.49 | 847 | 832 | 170.7 |
| A | 3 | 137 | 6430 | 32.79 | 847 | 832 | 170.7 |
| B | 7 | 220 | 49171 | 302.44 | 842 | 823 | 159.9 |
| B | 0 | 198 | 19325 | 115.74 | 842 | 823 | 159.9 |
| B | 12 | 111 | 18539 | 110.82 | 842 | 823 | 159.9 |
| C | 9 | 221 | 335202 | 1773.64 | 804 | 811 | 188.5 |
| C | 14 | 238 | 127270 | 670.75 | 804 | 811 | 188.5 |
| C | 0 | 207 | 89338 | 469.56 | 804 | 811 | 188.5 |
| D | 12 | 218 | 583180 | 2959.44 | 812 | 791 | 196.8 |
| D | 7 | 238 | 563622 | 2860.06 | 812 | 791 | 196.8 |
| D | 2 | 234 | 22939 | 112.55 | 812 | 791 | 196.8 |
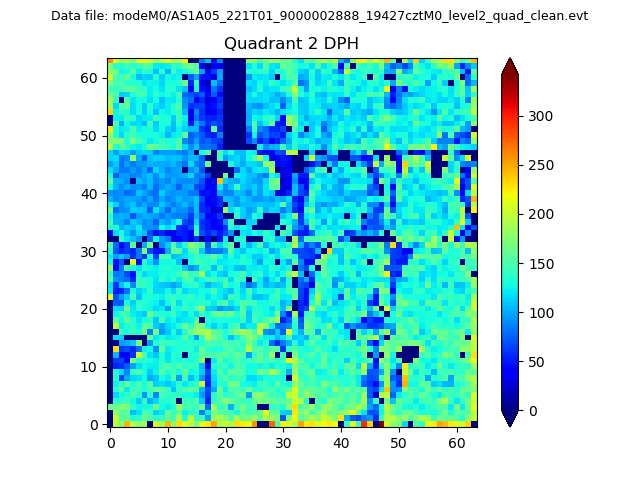
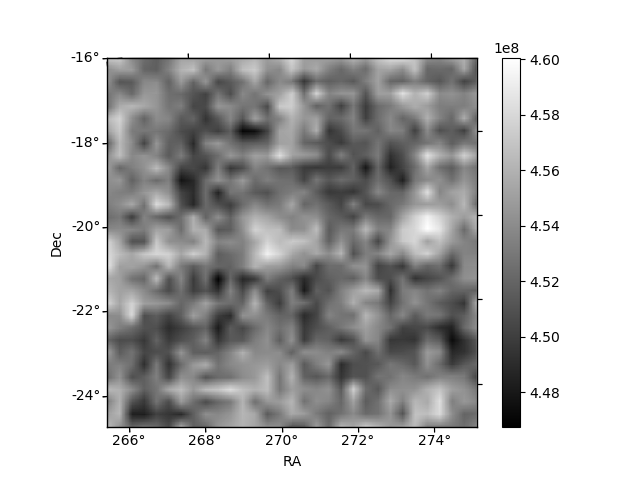
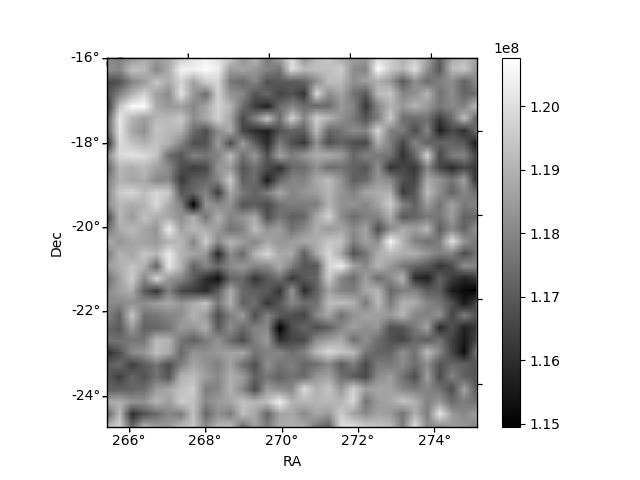
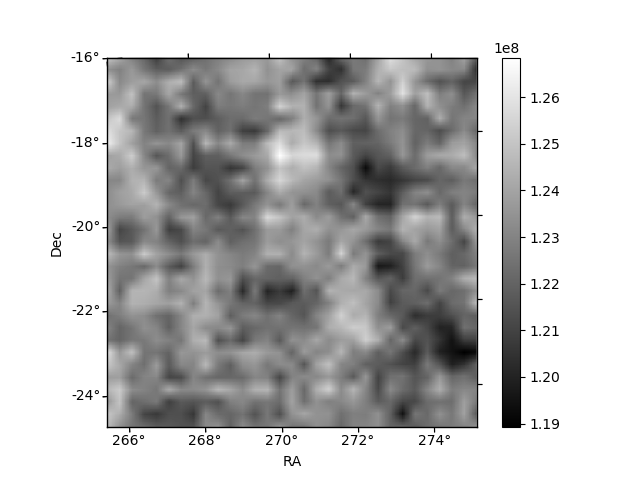
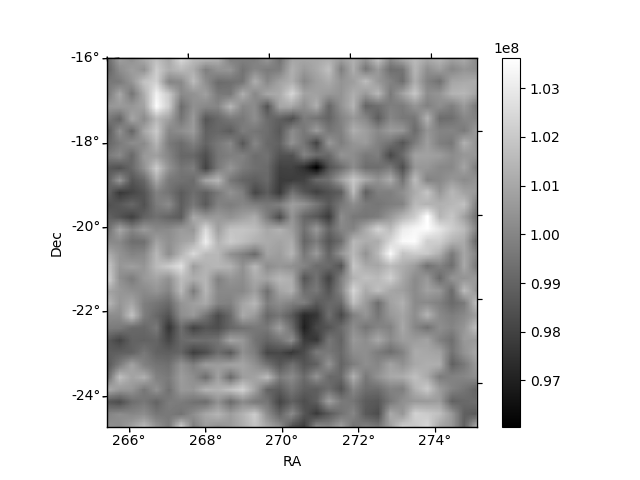
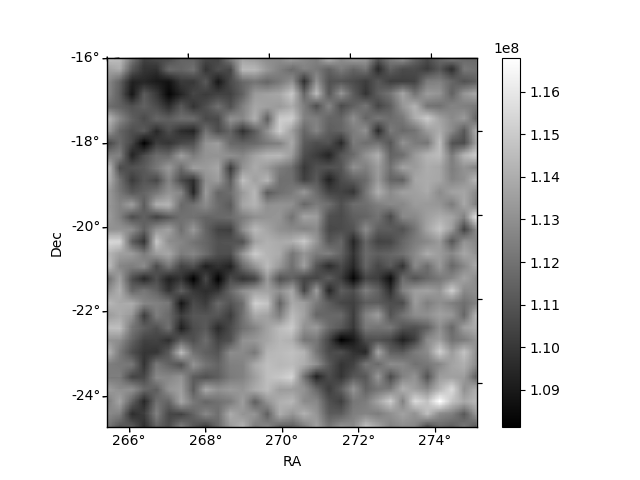
Histogram calculated using DETX and DETY for each event in the final _common_clean file
| Quadrant A | 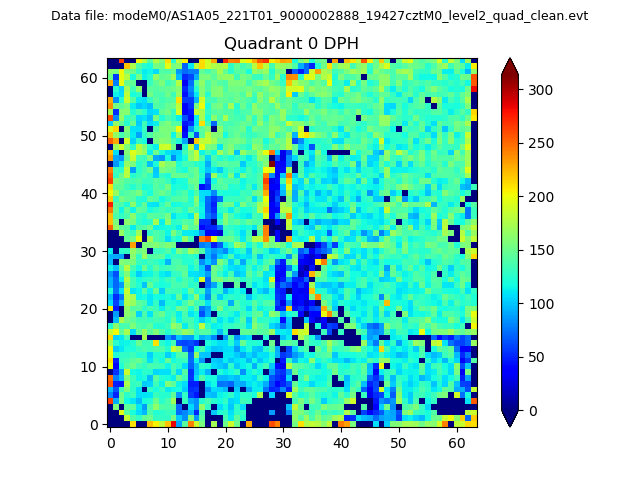 |
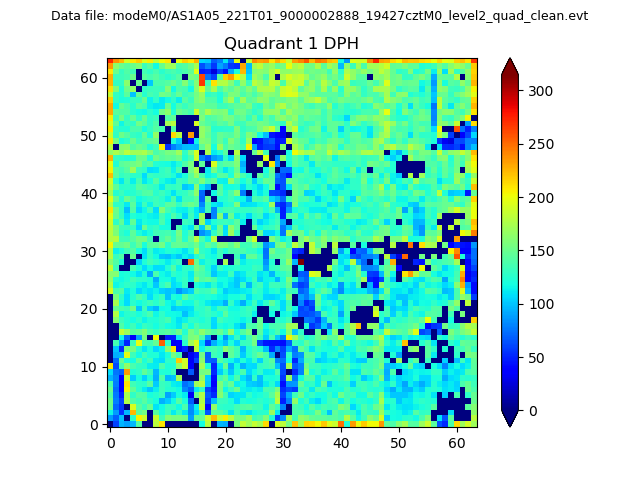 |
Quadrant B |
|---|---|---|---|
| Quadrant D | 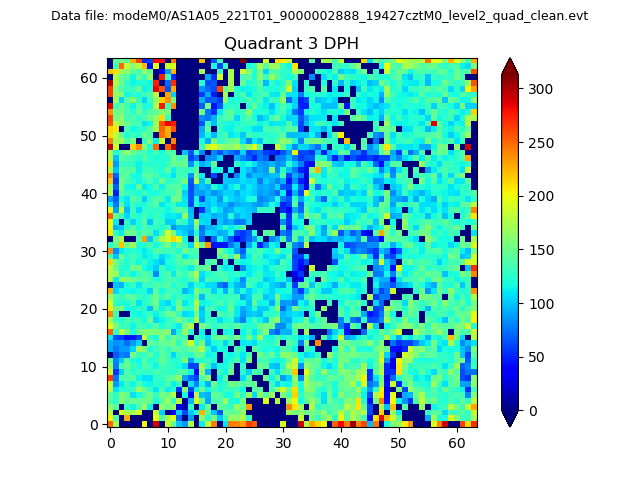 |
 |
Quadrant C |
| Plot type | Count rate plots | Images |
|---|---|---|
| Comparison with Poisson distribution Blue bars denote a histogram of data divided into 1 sec bins. Red curve is a Poisson curve with rate = median count rate of data. |
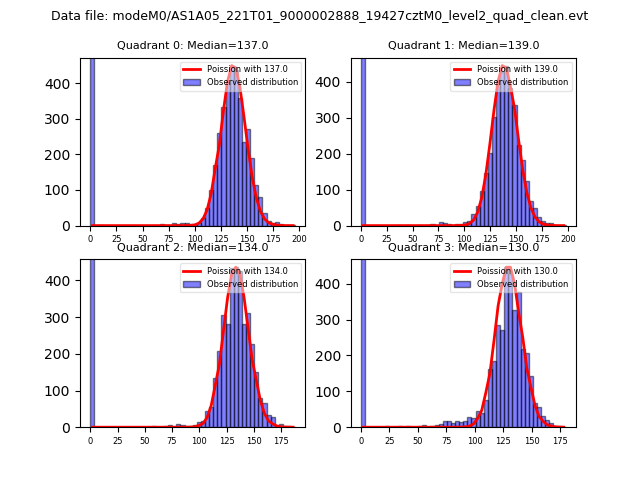 |
 |
| Quadrant-wise count rates Data is divided into 100 sec bins |
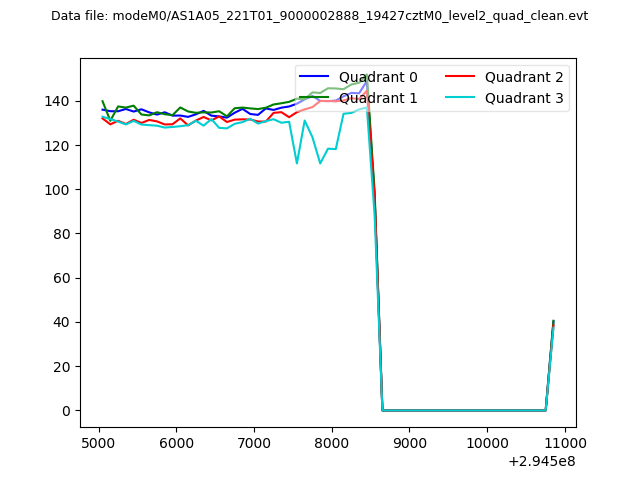 |
|
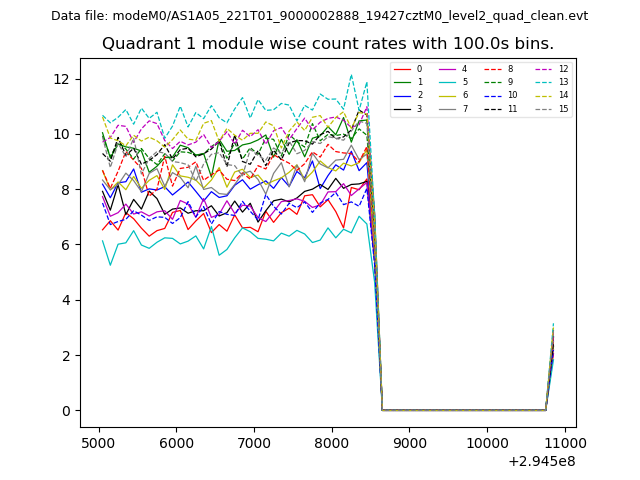
| Module-wise count rates for Quadrant A Data is divided into 100 sec bins |
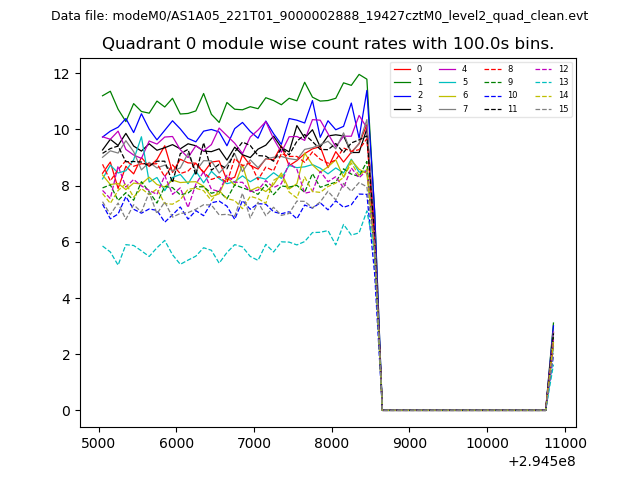 |
 |
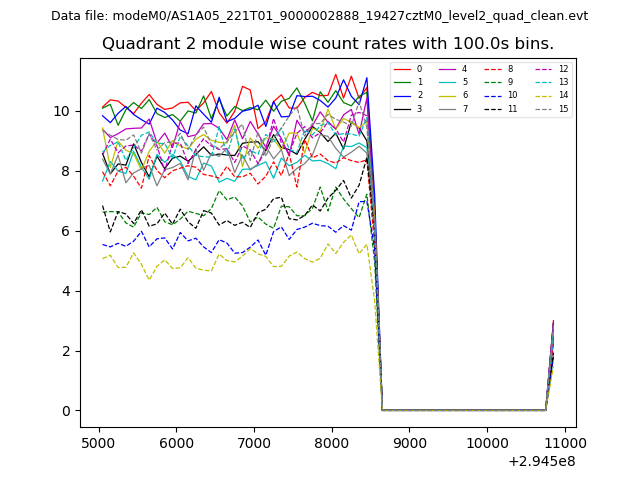
| Module-wise count rates for Quadrant B Data is divided into 100 sec bins |
 |
 |
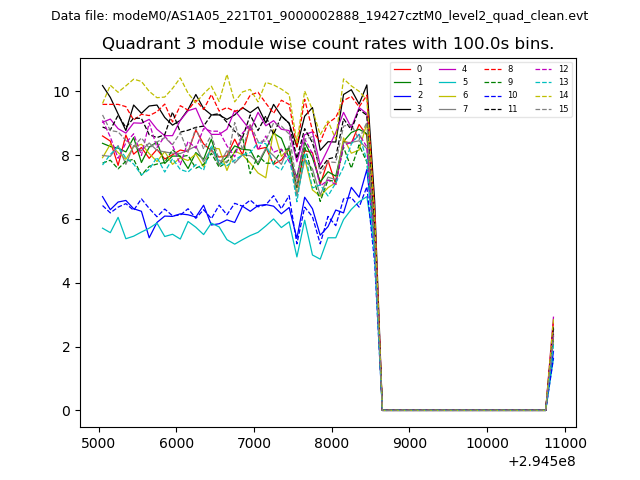
| Module-wise count rates for Quadrant C Data is divided into 100 sec bins |
 |
 |
| Module-wise count rates for Quadrant D Data is divided into 100 sec bins |
 |
 |
| Parameter | Plot |
|---|---|
| CZT HV Monitor | 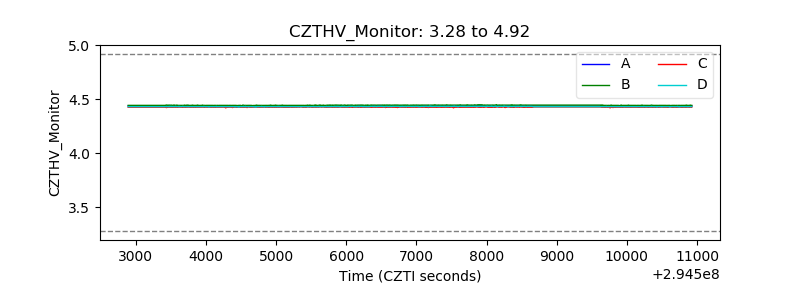 |
| D_VDD | 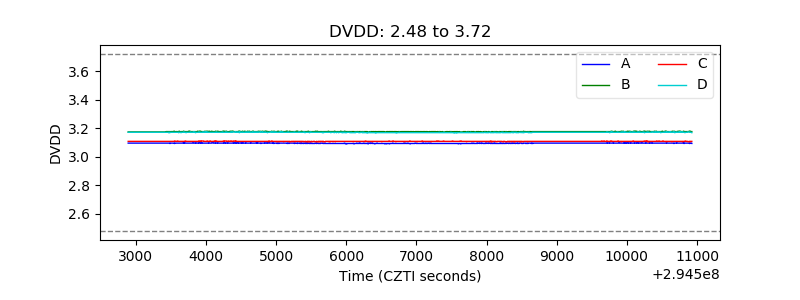 |
| Temperature 1 | 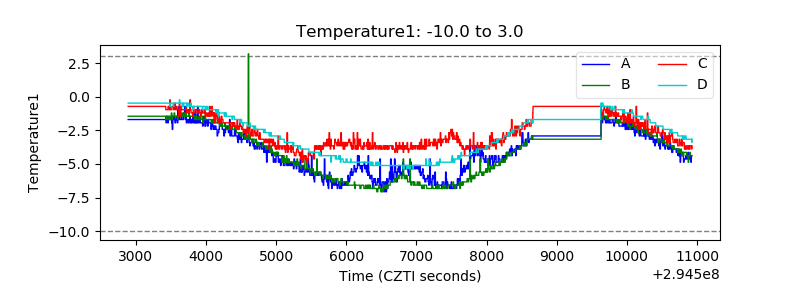 |
| Veto HV Monitor | 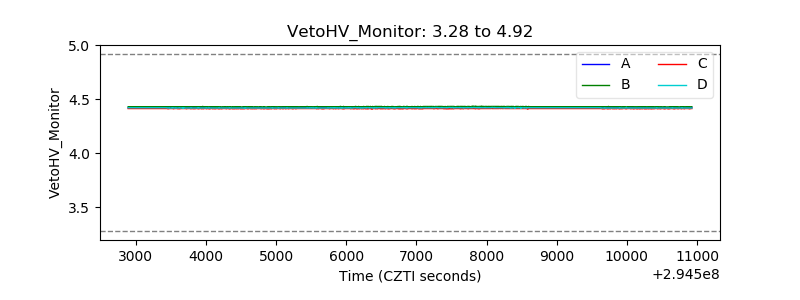 |
| Veto LLD | 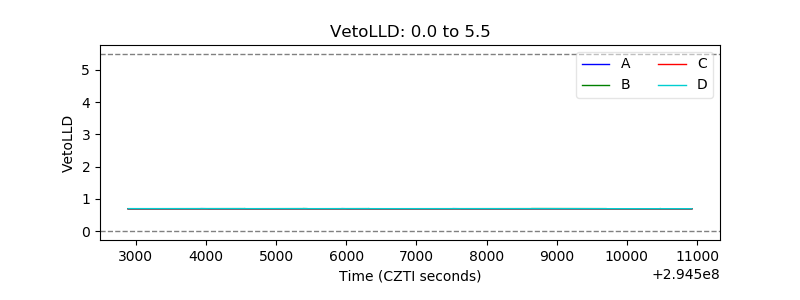 |
| Alpha Counter | 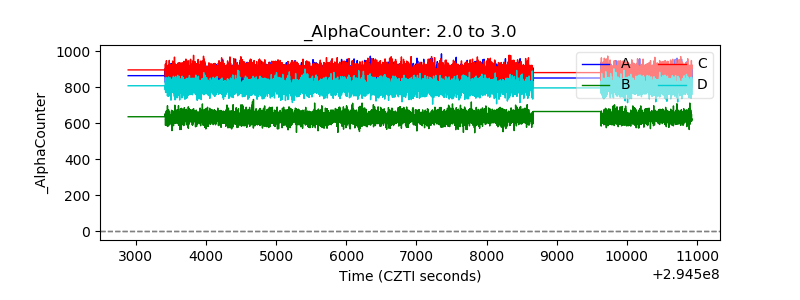 |
| _CPM_Rate | 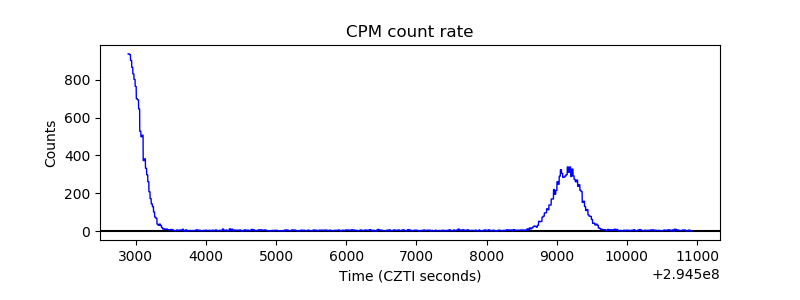 |
| CZT Counter | 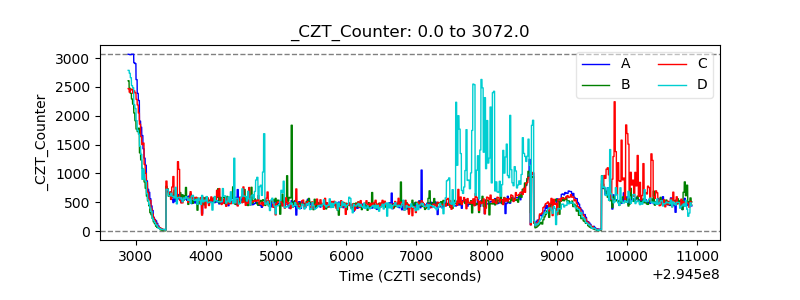 |
| +2.5 Volts monitor |  |
| +5 Volts monitor |  |
| _ROLL_ROT | 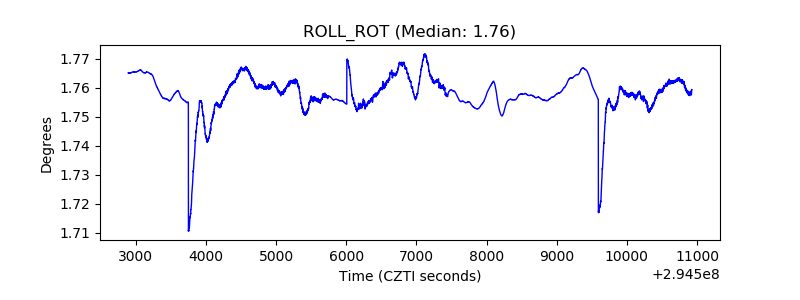 |
| _Roll_DEC | 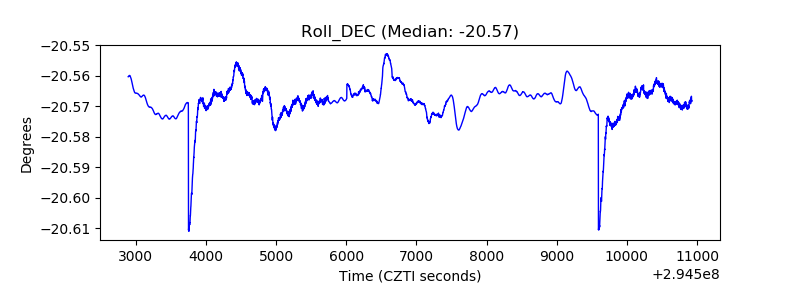 |
| _Roll_RA | 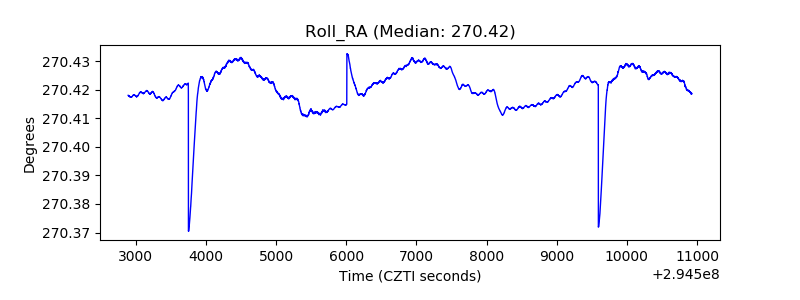 |
| Veto Counter | 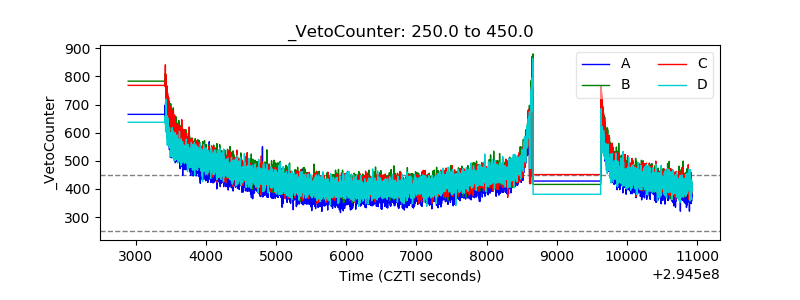 |