| Param | Original file | Final file |
|---|---|---|
| Filename | modeM0/AS1A05_221T01_9000002888_19428cztM0_level2.evt | modeM0/AS1A05_221T01_9000002888_19428cztM0_level2_quad_clean.evt |
| Size (bytes) | 537,736,320 | 85,734,720 |
| Size | 512.8 MB | 81.8 MB |
| Events in quadrant A | 3,439,642 | 538,956 |
| Events in quadrant B | 3,581,631 | 542,252 |
| Events in quadrant C | 3,946,822 | 524,320 |
| Events in quadrant D | 4,839,054 | 499,672 |
| Mode SS | |||
|---|---|---|---|
| Quadrant | BADHDUFLAG | Total packets | Discarded packets |
| A | 0 | 142 | 0 |
| B | 0 | 142 | 0 |
| C | 0 | 142 | 0 |
| D | 0 | 142 | 0 |
| Mode M9 | |||
|---|---|---|---|
| Quadrant | BADHDUFLAG | Total packets | Discarded packets |
| A | 0 | 12 | 0 |
| B | 0 | 13 | 0 |
| C | 0 | 13 | 0 |
| D | 0 | 13 | 0 |
| Mode M0 | |||
|---|---|---|---|
| Quadrant | BADHDUFLAG | Total packets | Discarded packets |
| A | 0 | 14655 | 2 |
| B | 0 | 15025 | 2 |
| C | 0 | 16125 | 2 |
| D | 0 | 19170 | 3 |
| Quadrant | Total seconds | Saturated seconds | Saturation percentage |
|---|---|---|---|
| A | 7051 | 50 | 0.709119% |
| B | 7051 | 95 | 1.347327% |
| C | 7051 | 205 | 2.907389% |
| D | 7050 | 462 | 6.553191% |
Noise dominated data is calculated using 1-second bins in cleaned event files. If a bin has >2000 counts, and if more than 50% of those come from <1% of pixels, then it is considered to be noise-dominated and hence unusable.
| Quadrant | # 1 sec bins | Bins with >0 counts | Bins with >2000 counts | High rate bins dominated by noise | Noise dominated (total time) | Noise dominated (detector-on time) | Marked lightcurve |
|---|---|---|---|---|---|---|---|
| A | 7661 | 7052 | 0 | 0 | 0.00% | 0.00% | 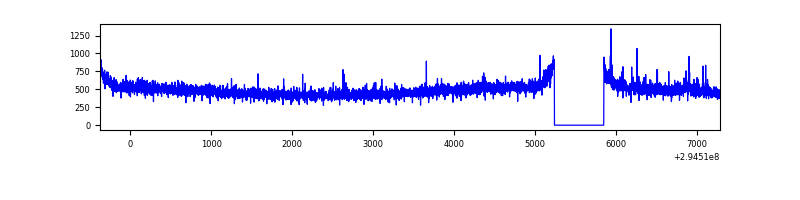 |
| B | 7661 | 7052 | 17 | 17 | 0.22% | 0.24% | 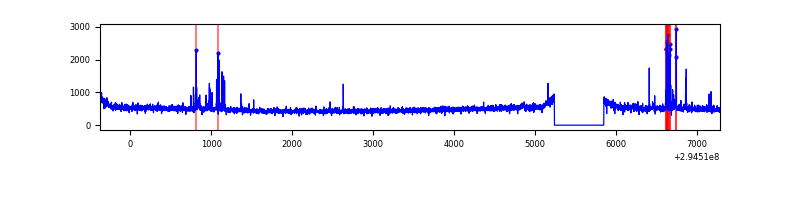 |
| C | 7661 | 7052 | 26 | 26 | 0.34% | 0.37% | 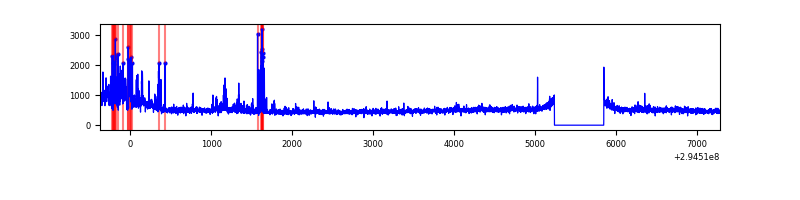 |
| D | 7660 | 7051 | 426 | 426 | 5.56% | 6.04% | 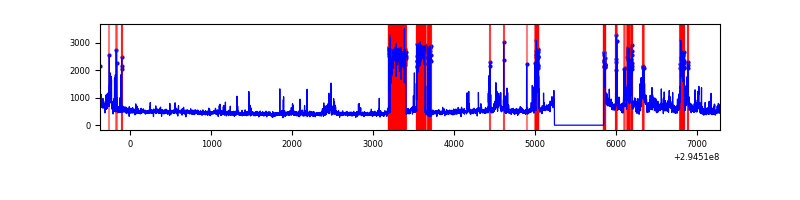 |
Top three noisy pixels from each quadrant. If the there are fewer than three noisy pixels in the level2.evt file, extra rows are filled as -1
| Pixel properties | Quadrant properties | ||||||
|---|---|---|---|---|---|---|---|
| Quadrant | DetID | PixID | Counts | Sigma | Mean | Median | Sigma |
| A | 9 | 143 | 18439 | 98.08 | 883 | 862 | 179.2 |
| A | 13 | 254 | 11470 | 59.19 | 883 | 862 | 179.2 |
| A | 12 | 96 | 11018 | 56.67 | 883 | 862 | 179.2 |
| B | 7 | 220 | 74627 | 441.13 | 877 | 855 | 167.2 |
| B | 0 | 197 | 42370 | 248.24 | 877 | 855 | 167.2 |
| B | 12 | 111 | 19710 | 112.75 | 877 | 855 | 167.2 |
| C | 9 | 221 | 452654 | 2297.99 | 841 | 846 | 196.6 |
| C | 14 | 238 | 129552 | 654.62 | 841 | 846 | 196.6 |
| C | 0 | 207 | 63614 | 319.25 | 841 | 846 | 196.6 |
| D | 15 | 0 | 731187 | 3550.41 | 838 | 812 | 205.7 |
| D | 7 | 238 | 486719 | 2362.03 | 838 | 812 | 205.7 |
| D | 12 | 218 | 220649 | 1068.64 | 838 | 812 | 205.7 |
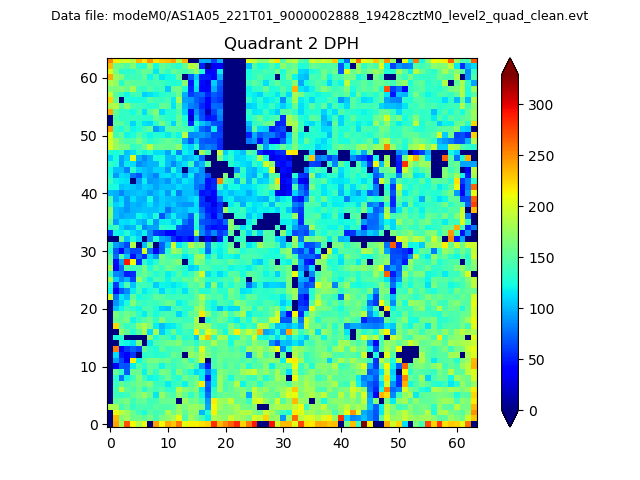
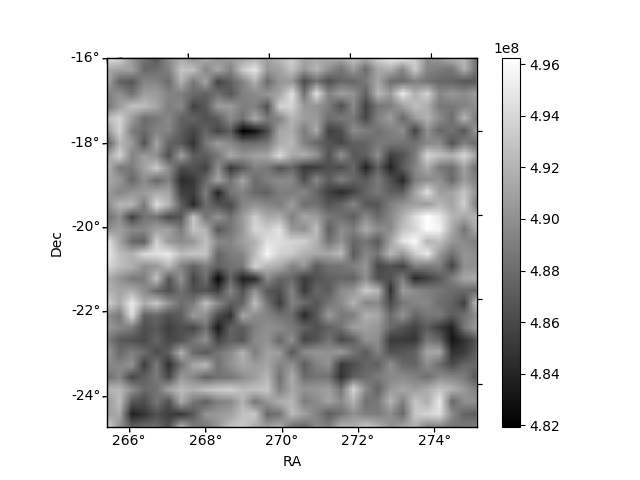
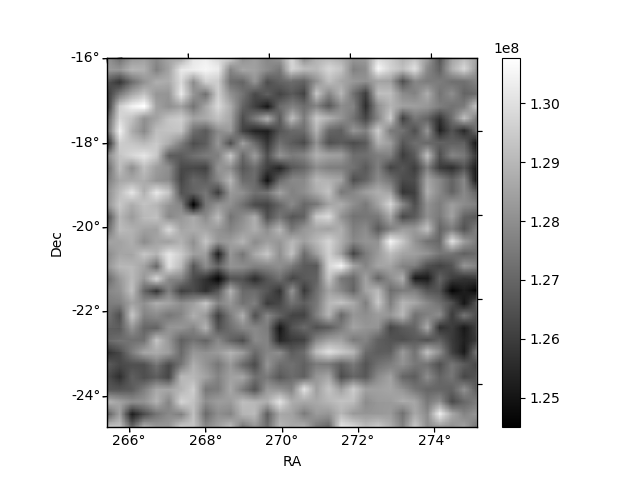
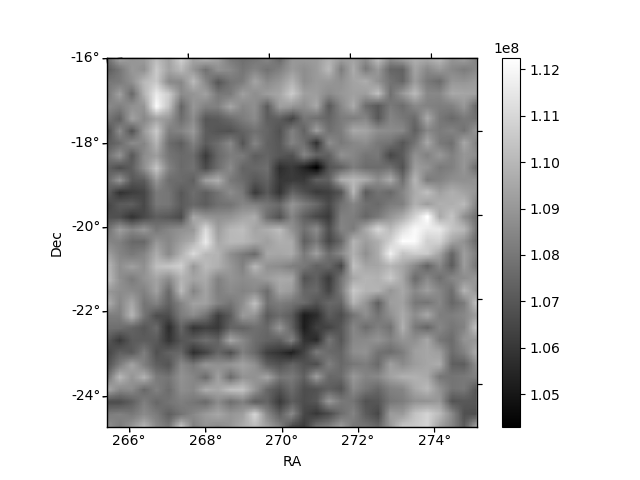
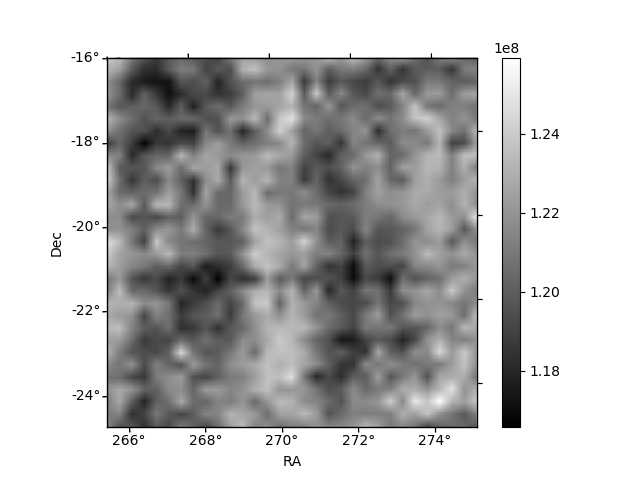
Histogram calculated using DETX and DETY for each event in the final _common_clean file
| Quadrant A | 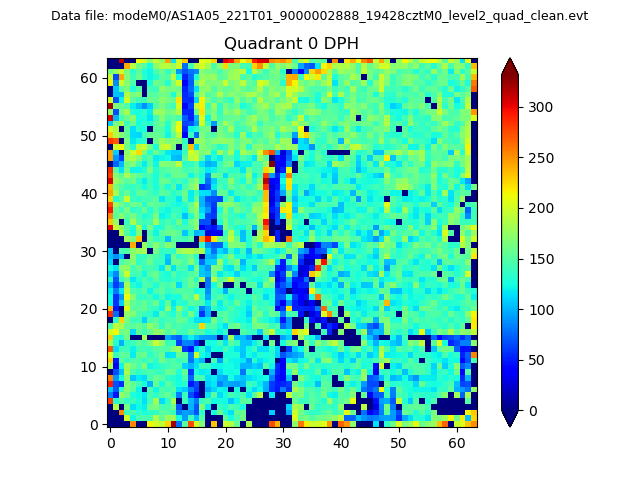 |
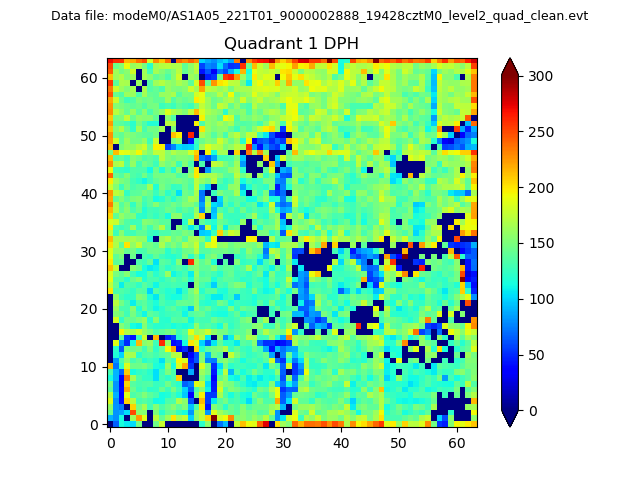 |
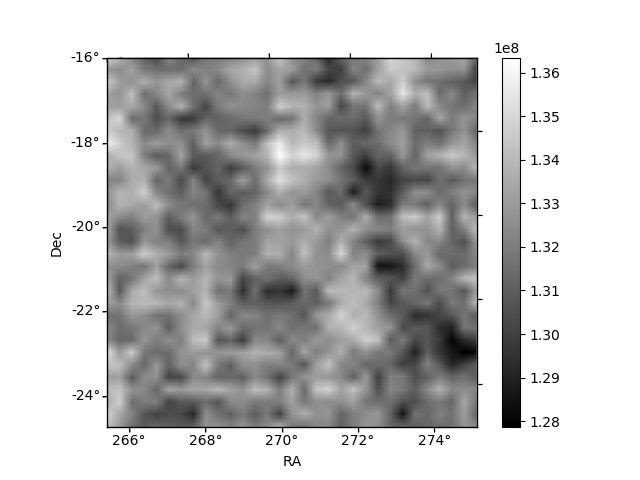
Quadrant B |
|---|---|---|---|
| Quadrant D | 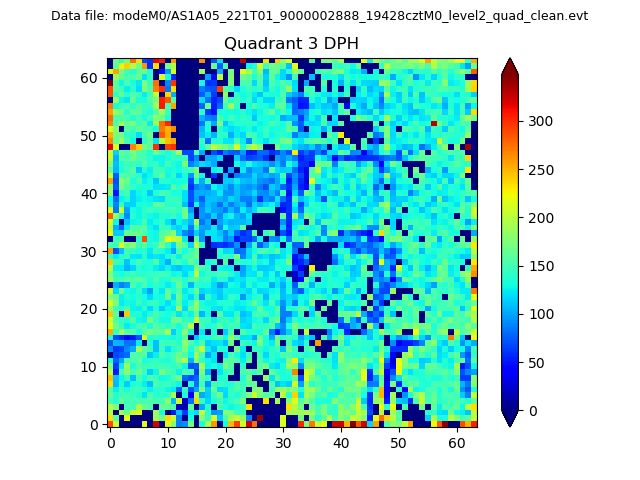 |
 |
Quadrant C |
| Plot type | Count rate plots | Images |
|---|---|---|
| Comparison with Poisson distribution Blue bars denote a histogram of data divided into 1 sec bins. Red curve is a Poisson curve with rate = median count rate of data. |
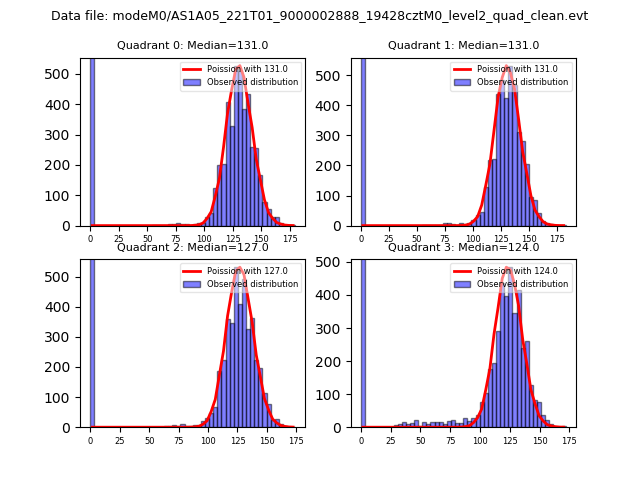 |
 |
| Quadrant-wise count rates Data is divided into 100 sec bins |
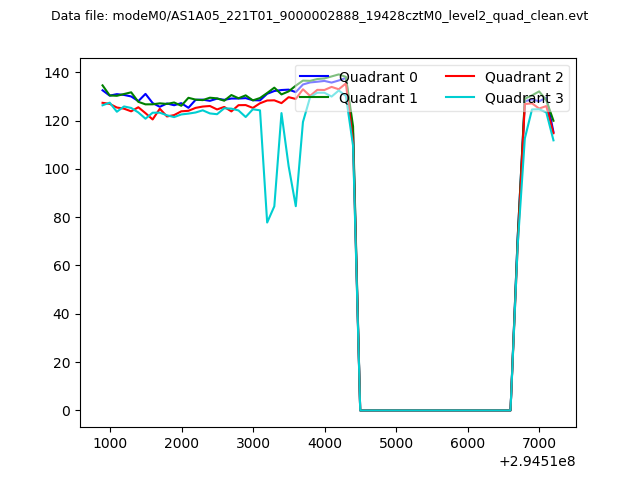 |
|
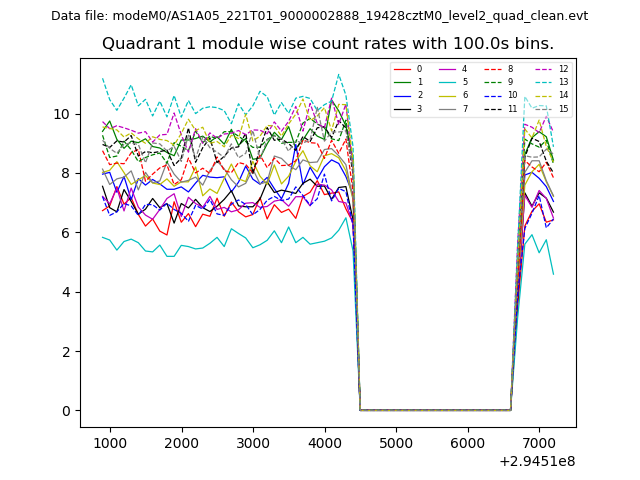
| Module-wise count rates for Quadrant A Data is divided into 100 sec bins |
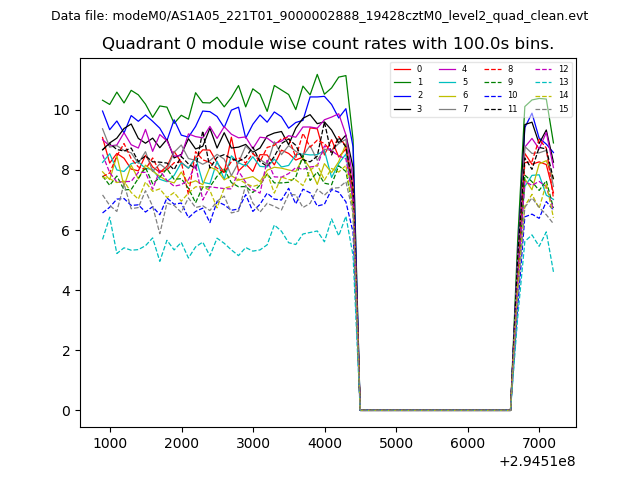 |
 |
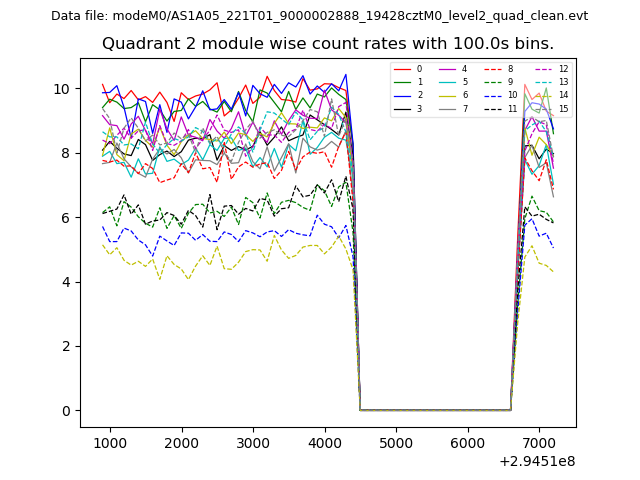
| Module-wise count rates for Quadrant B Data is divided into 100 sec bins |
 |
 |
| Module-wise count rates for Quadrant C Data is divided into 100 sec bins |
 |
 |
| Module-wise count rates for Quadrant D Data is divided into 100 sec bins |
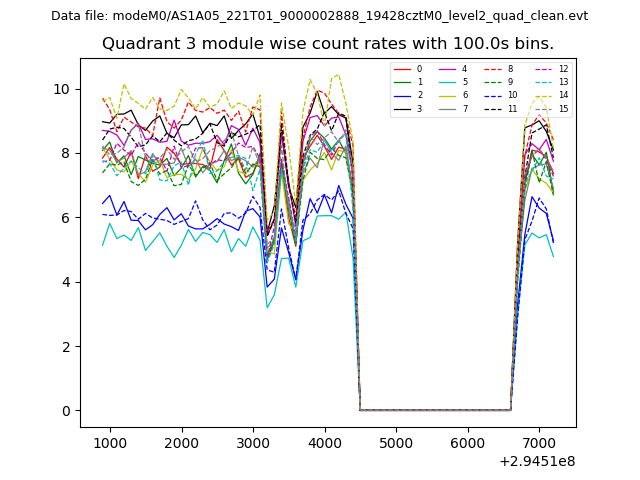 |
 |
| Parameter | Plot |
|---|---|
| CZT HV Monitor | 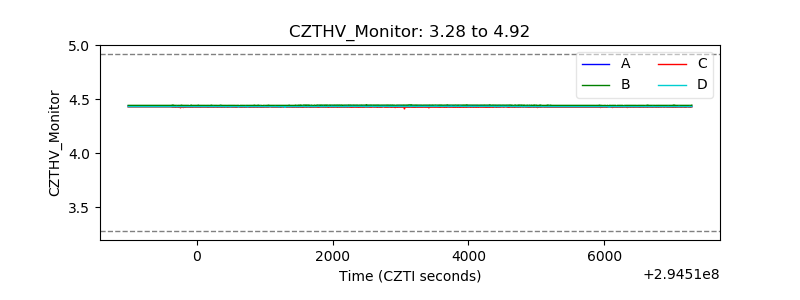 |
| D_VDD | 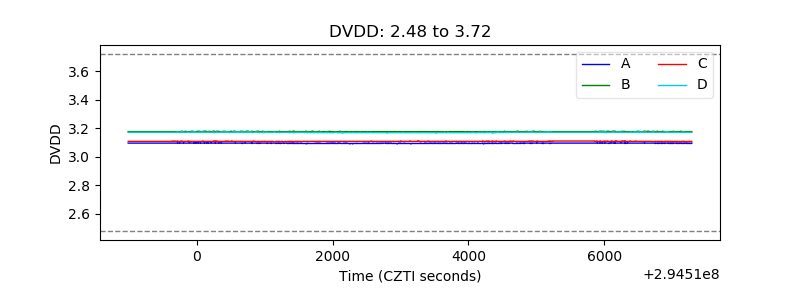 |
| Temperature 1 | 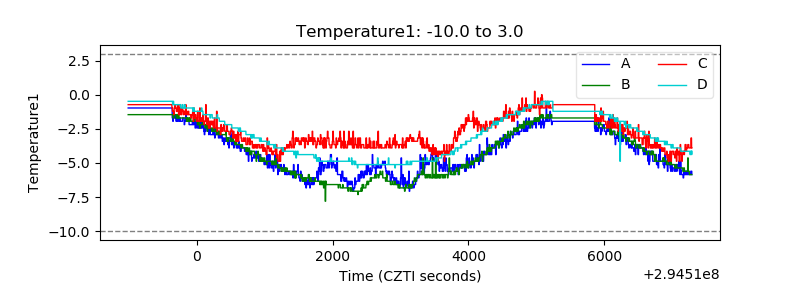 |
| Veto HV Monitor | 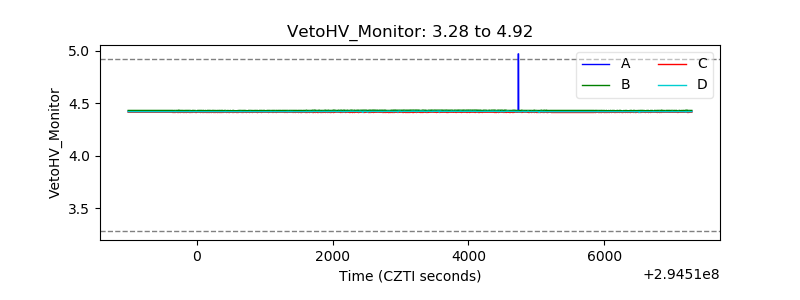 |
| Veto LLD | 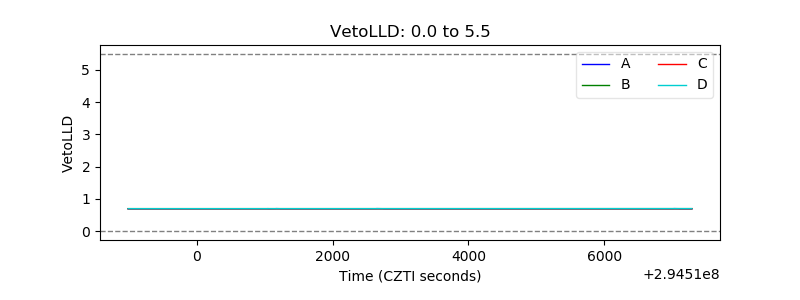 |
| Alpha Counter | 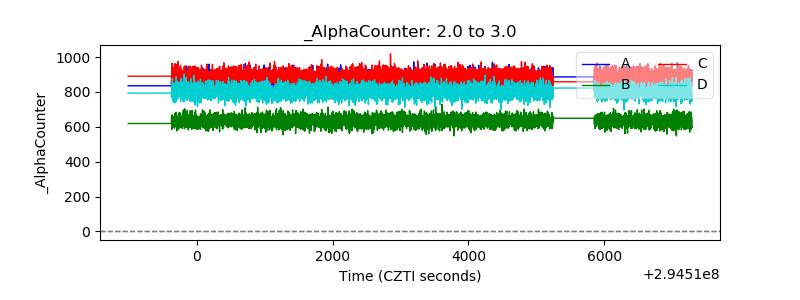 |
| _CPM_Rate | 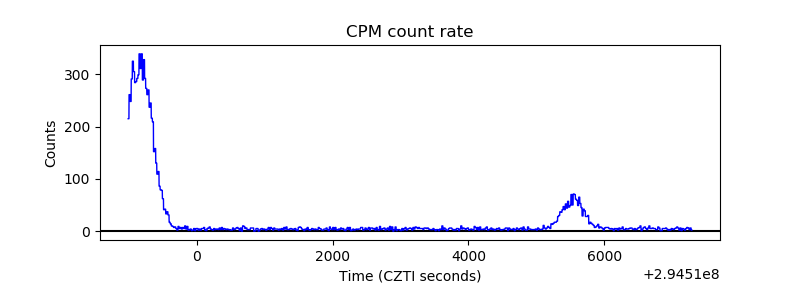 |
| CZT Counter | 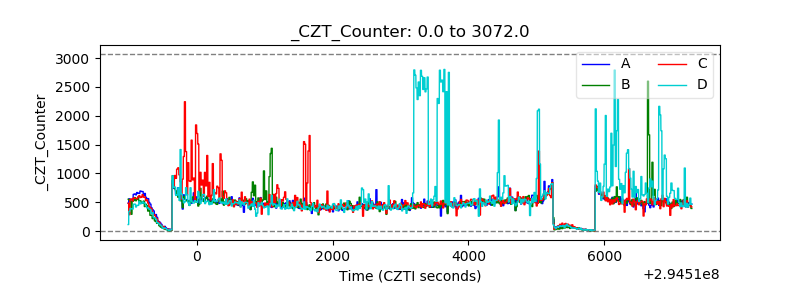 |
| +2.5 Volts monitor |  |
| +5 Volts monitor | 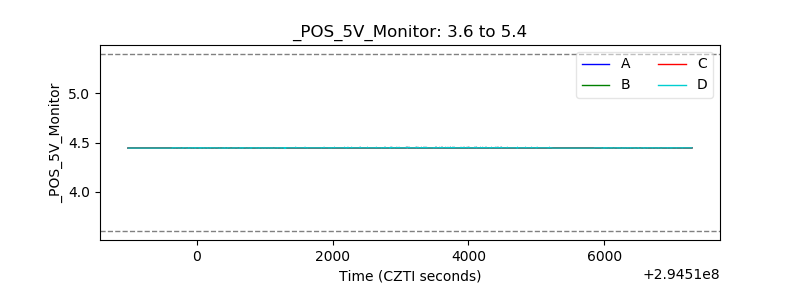 |
| _ROLL_ROT | 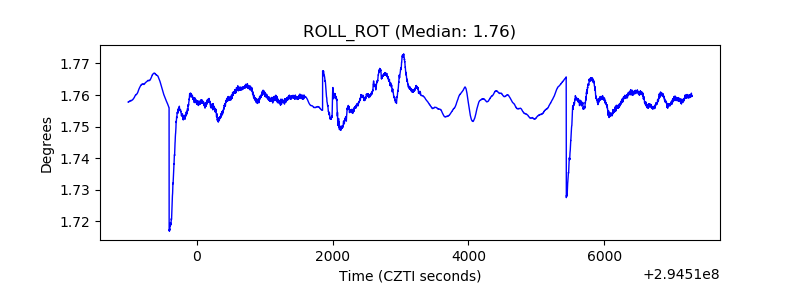 |
| _Roll_DEC | 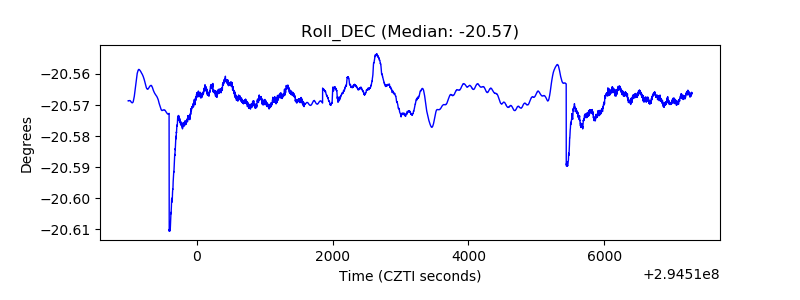 |
| _Roll_RA | 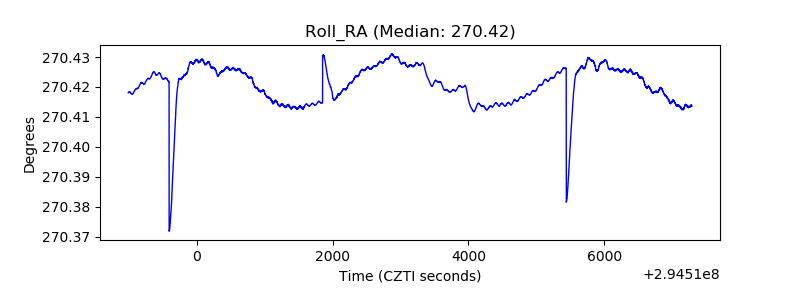 |
| Veto Counter | 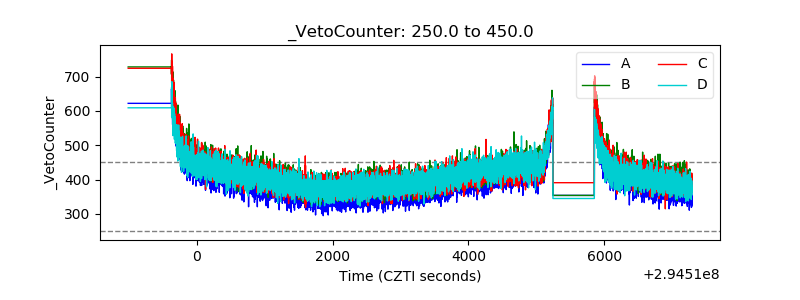 |