| Param | Original file | Final file |
|---|---|---|
| Filename | modeM0/AS1A05_221T01_9000002888_19429cztM0_level2.evt | modeM0/AS1A05_221T01_9000002888_19429cztM0_level2_quad_clean.evt |
| Size (bytes) | 607,720,320 | 93,824,640 |
| Size | 579.6 MB | 89.5 MB |
| Events in quadrant A | 3,936,524 | 580,120 |
| Events in quadrant B | 4,130,329 | 587,656 |
| Events in quadrant C | 4,172,216 | 569,246 |
| Events in quadrant D | 5,623,222 | 547,819 |
| Mode SS | |||
|---|---|---|---|
| Quadrant | BADHDUFLAG | Total packets | Discarded packets |
| A | 0 | 166 | 0 |
| B | 0 | 166 | 0 |
| C | 0 | 166 | 0 |
| D | 0 | 166 | 0 |
| Mode M9 | |||
|---|---|---|---|
| Quadrant | BADHDUFLAG | Total packets | Discarded packets |
| A | 0 | 8 | 0 |
| B | 0 | 8 | 0 |
| C | 0 | 8 | 0 |
| D | 0 | 8 | 0 |
| Mode M0 | |||
|---|---|---|---|
| Quadrant | BADHDUFLAG | Total packets | Discarded packets |
| A | 0 | 16815 | 2 |
| B | 0 | 17338 | 2 |
| C | 0 | 17272 | 2 |
| D | 0 | 22169 | 3 |
| Quadrant | Total seconds | Saturated seconds | Saturation percentage |
|---|---|---|---|
| A | 7996 | 81 | 1.013007% |
| B | 7996 | 159 | 1.988494% |
| C | 7996 | 197 | 2.463732% |
| D | 7995 | 408 | 5.103189% |
Noise dominated data is calculated using 1-second bins in cleaned event files. If a bin has >2000 counts, and if more than 50% of those come from <1% of pixels, then it is considered to be noise-dominated and hence unusable.
| Quadrant | # 1 sec bins | Bins with >0 counts | Bins with >2000 counts | High rate bins dominated by noise | Noise dominated (total time) | Noise dominated (detector-on time) | Marked lightcurve |
|---|---|---|---|---|---|---|---|
| A | 8896 | 7998 | 0 | 0 | 0.00% | 0.00% | 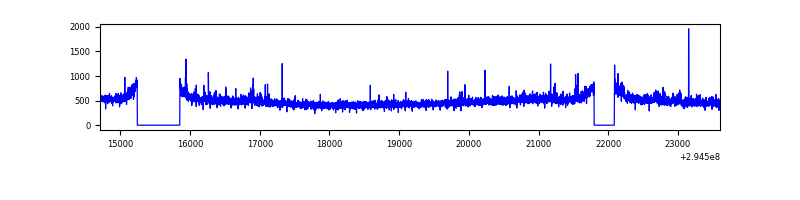 |
| B | 8896 | 7997 | 20 | 20 | 0.22% | 0.25% | 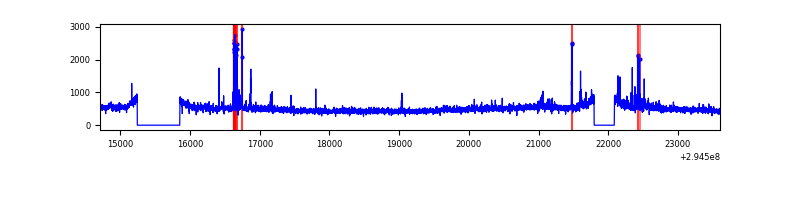 |
| C | 8896 | 7998 | 29 | 29 | 0.33% | 0.36% | 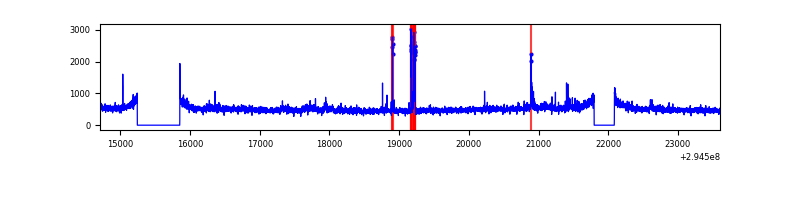 |
| D | 8895 | 7996 | 280 | 280 | 3.15% | 3.50% | 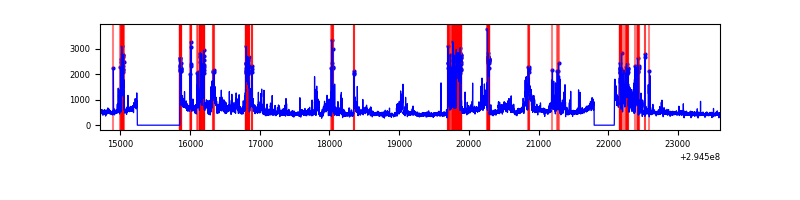 |
Top three noisy pixels from each quadrant. If the there are fewer than three noisy pixels in the level2.evt file, extra rows are filled as -1
| Pixel properties | Quadrant properties | ||||||
|---|---|---|---|---|---|---|---|
| Quadrant | DetID | PixID | Counts | Sigma | Mean | Median | Sigma |
| A | 3 | 1 | 36250 | 173.61 | 999 | 976 | 203.2 |
| A | 9 | 143 | 18296 | 85.24 | 999 | 976 | 203.2 |
| A | 12 | 96 | 16848 | 78.12 | 999 | 976 | 203.2 |
| B | 7 | 220 | 88431 | 457.2 | 997 | 972 | 191.3 |
| B | 0 | 198 | 42119 | 215.1 | 997 | 972 | 191.3 |
| B | 0 | 190 | 26507 | 133.49 | 997 | 972 | 191.3 |
| C | 9 | 221 | 262243 | 1150.17 | 956 | 960 | 227.2 |
| C | 14 | 238 | 147072 | 643.18 | 956 | 960 | 227.2 |
| C | 3 | 233 | 25470 | 107.89 | 956 | 960 | 227.2 |
| D | 7 | 238 | 1198421 | 5098.66 | 958 | 928 | 234.9 |
| D | 12 | 218 | 545145 | 2317.16 | 958 | 928 | 234.9 |
| D | 1 | 52 | 147521 | 624.16 | 958 | 928 | 234.9 |
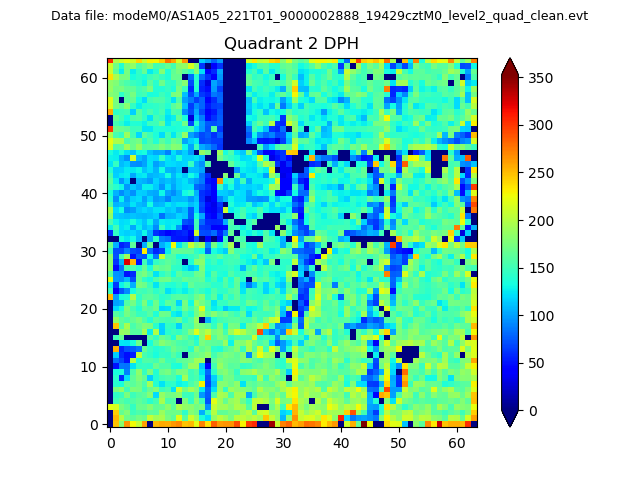
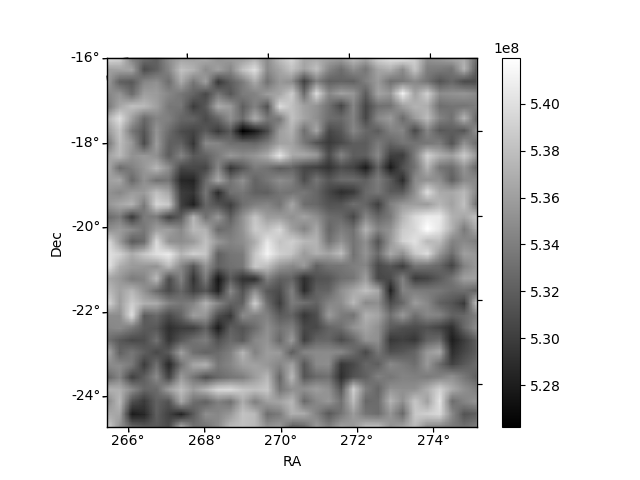
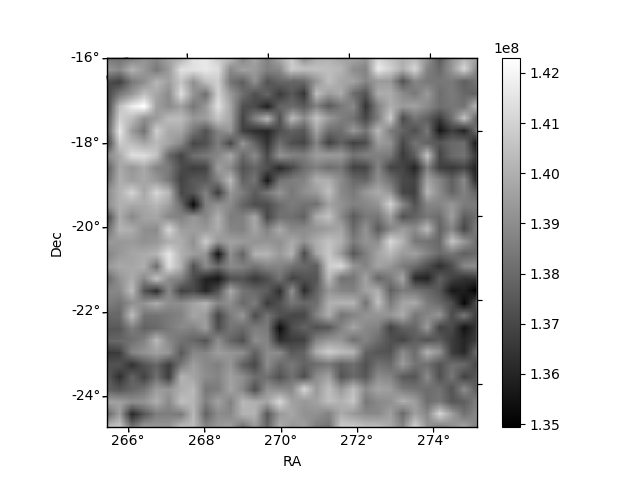
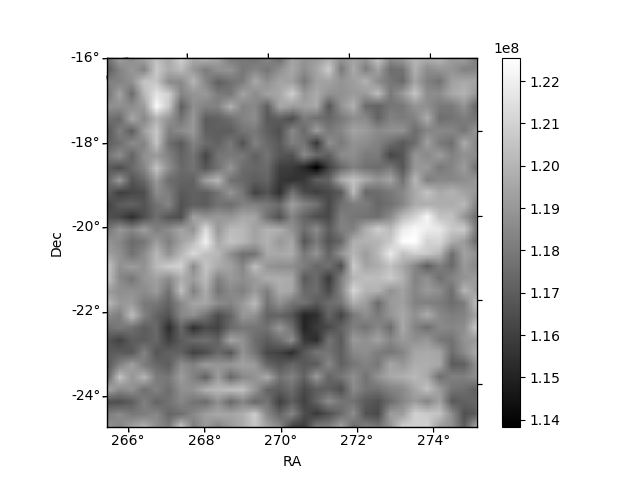
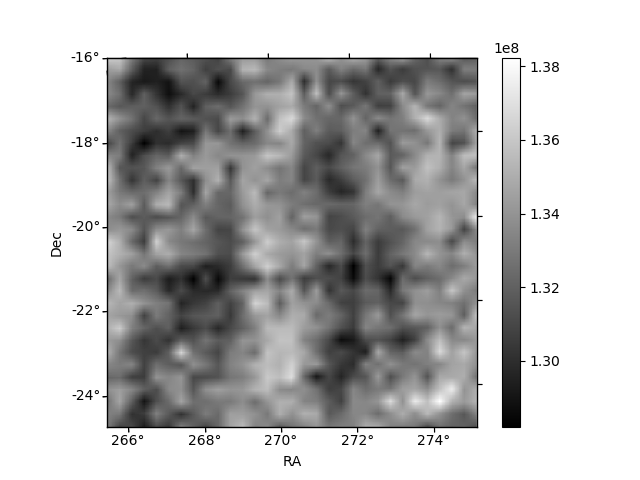
Histogram calculated using DETX and DETY for each event in the final _common_clean file
| Quadrant A | 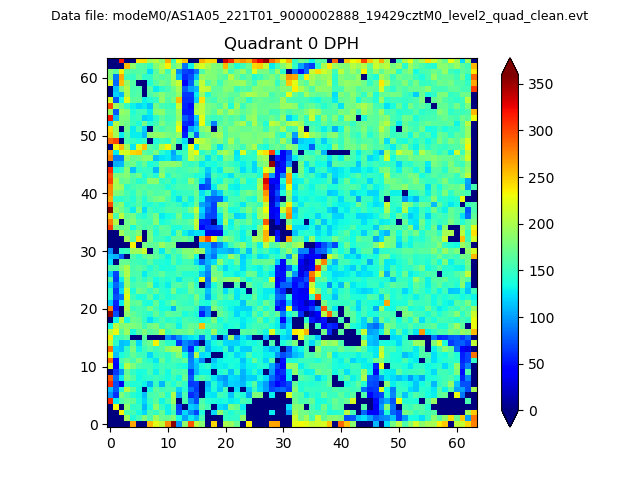 |
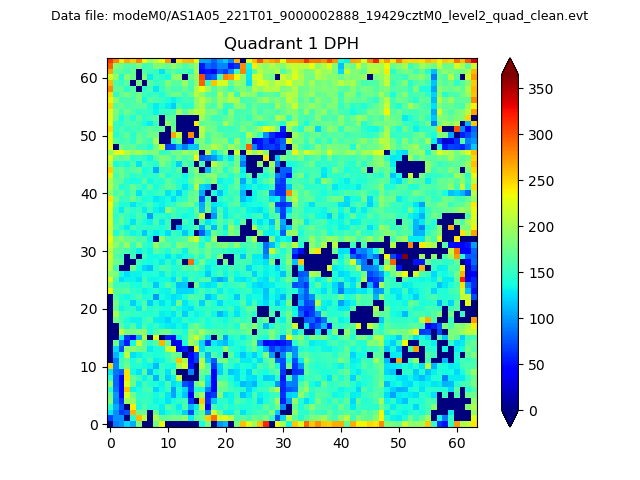 |
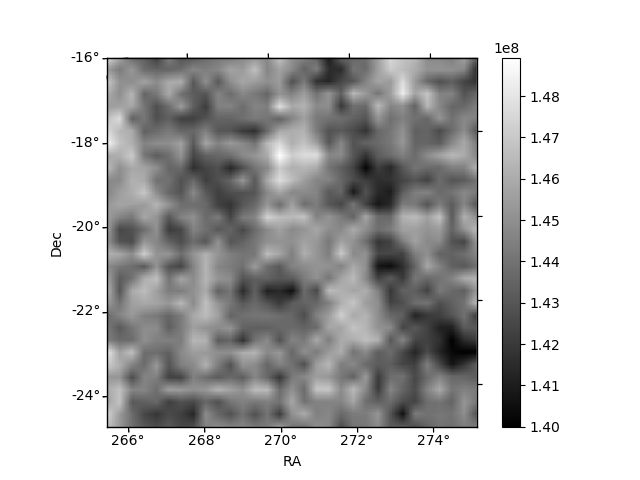
Quadrant B |
|---|---|---|---|
| Quadrant D | 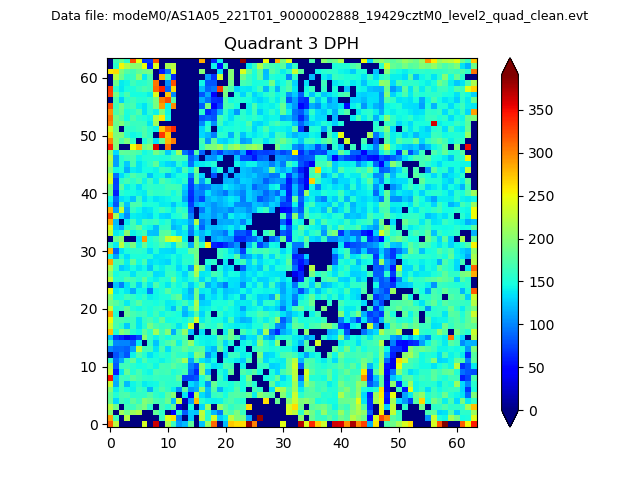 |
 |
Quadrant C |
| Plot type | Count rate plots | Images |
|---|---|---|
| Comparison with Poisson distribution Blue bars denote a histogram of data divided into 1 sec bins. Red curve is a Poisson curve with rate = median count rate of data. |
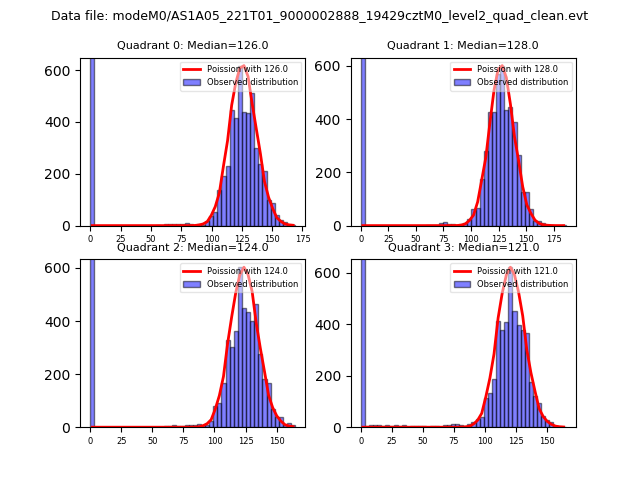 |
 |
| Quadrant-wise count rates Data is divided into 100 sec bins |
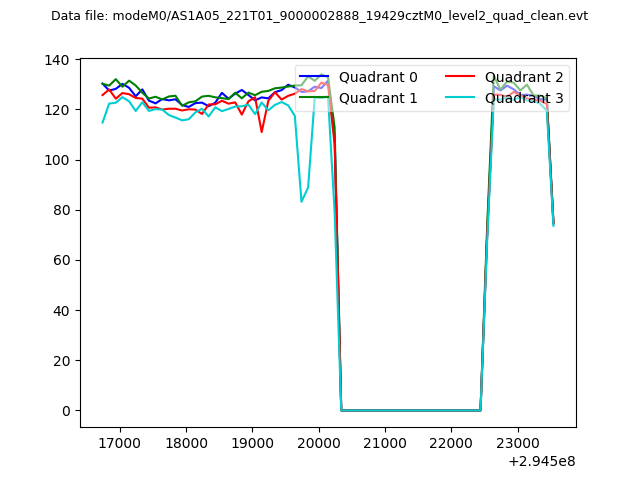 |
|
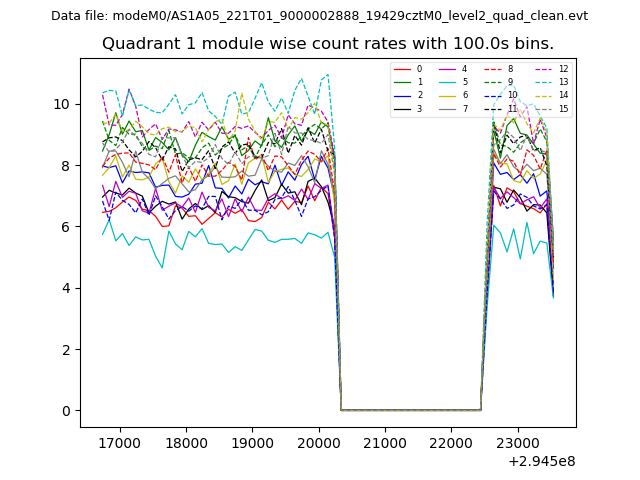
| Module-wise count rates for Quadrant A Data is divided into 100 sec bins |
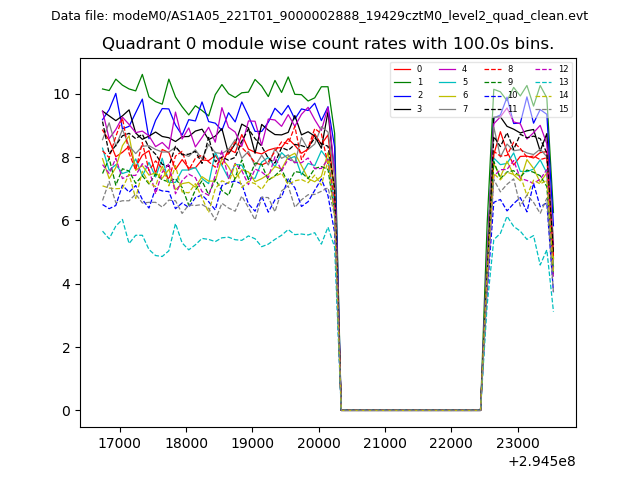 |
 |
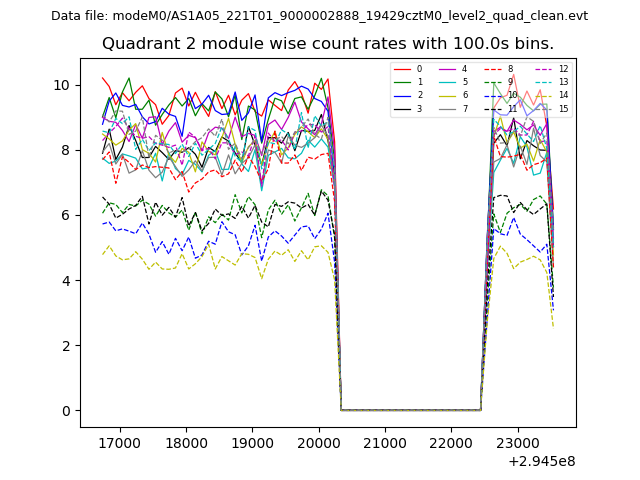
| Module-wise count rates for Quadrant B Data is divided into 100 sec bins |
 |
 |
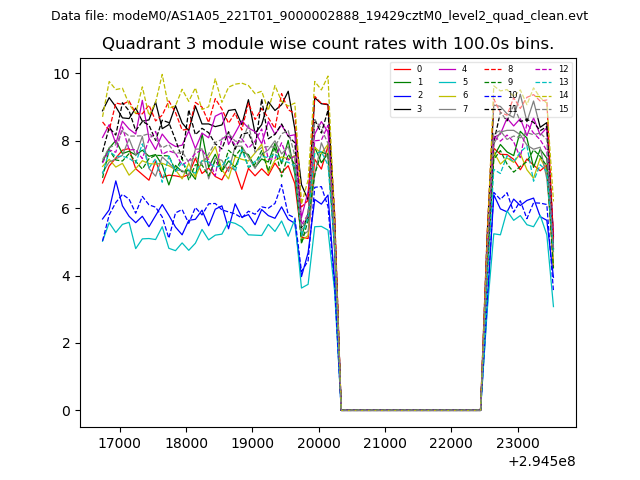
| Module-wise count rates for Quadrant C Data is divided into 100 sec bins |
 |
 |
| Module-wise count rates for Quadrant D Data is divided into 100 sec bins |
 |
 |
| Parameter | Plot |
|---|---|
| CZT HV Monitor | 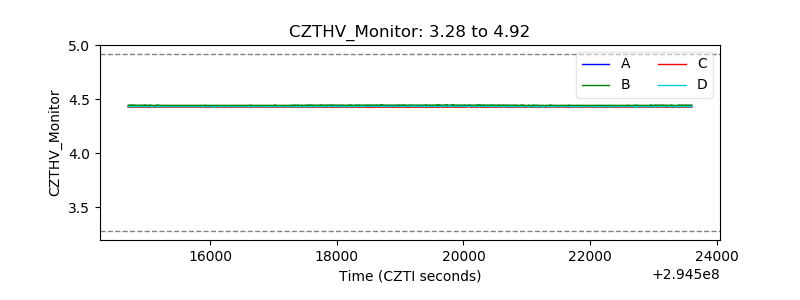 |
| D_VDD | 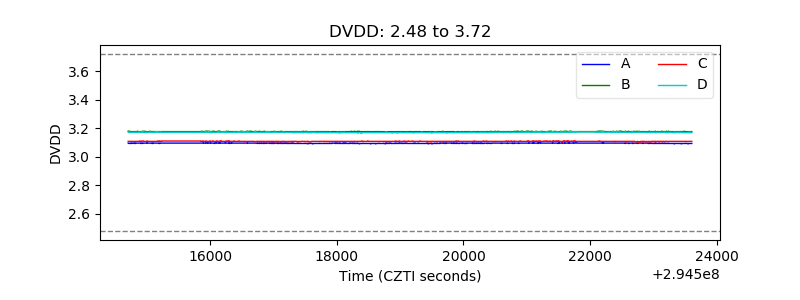 |
| Temperature 1 | 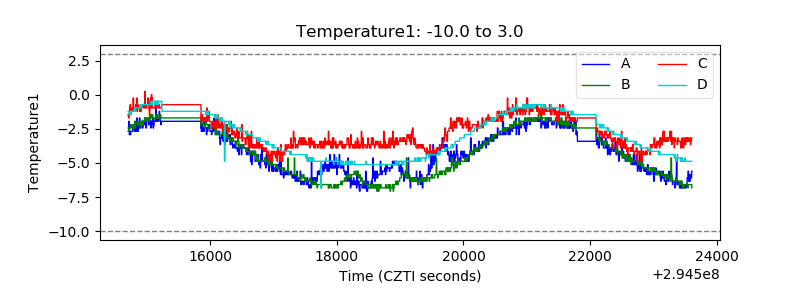 |
| Veto HV Monitor | 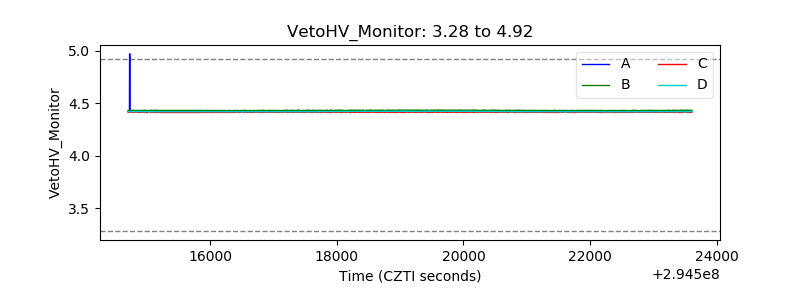 |
| Veto LLD | 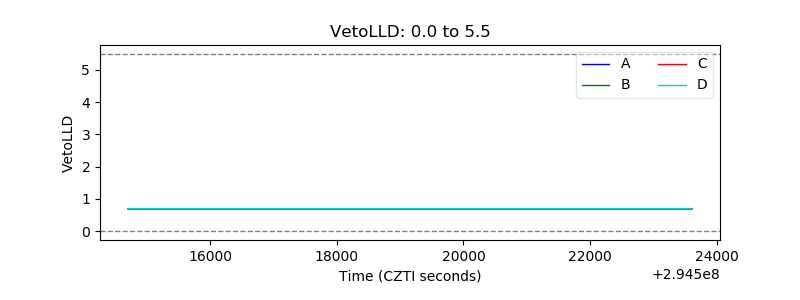 |
| Alpha Counter | 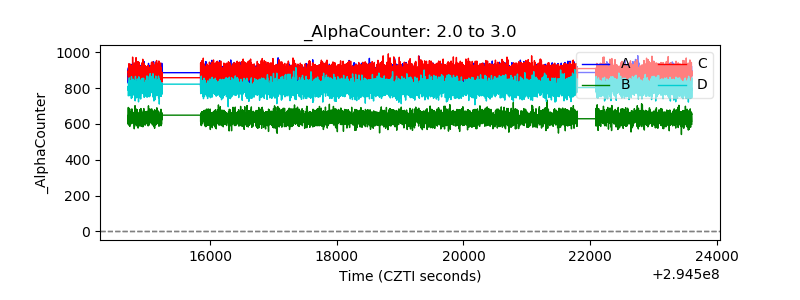 |
| _CPM_Rate | 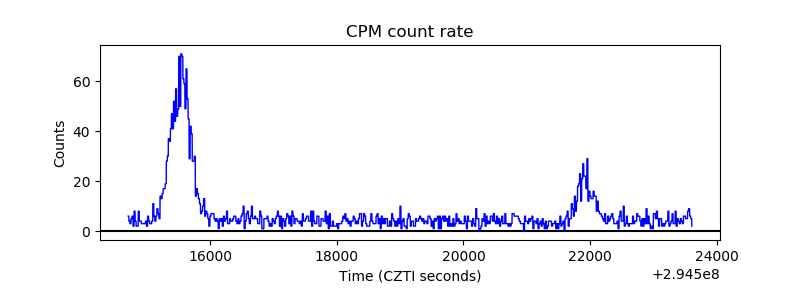 |
| CZT Counter | 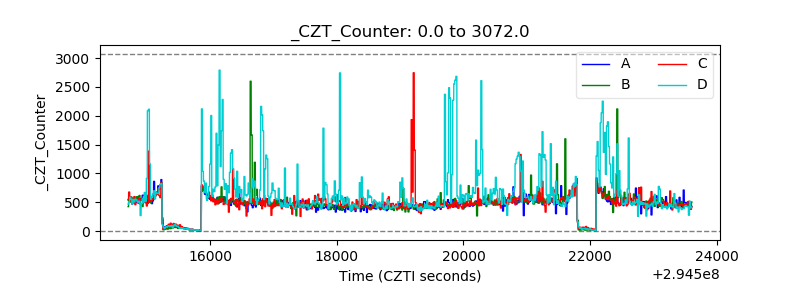 |
| +2.5 Volts monitor | 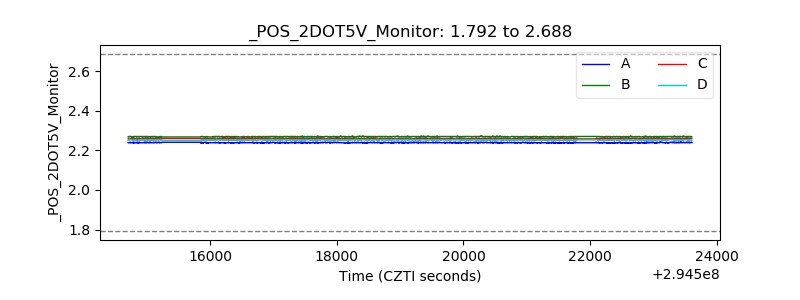 |
| +5 Volts monitor | 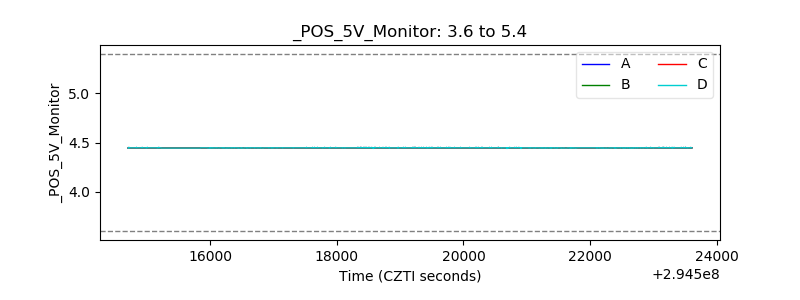 |
| _ROLL_ROT | 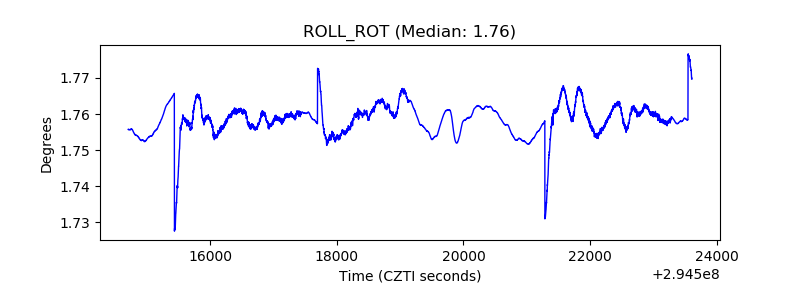 |
| _Roll_DEC | 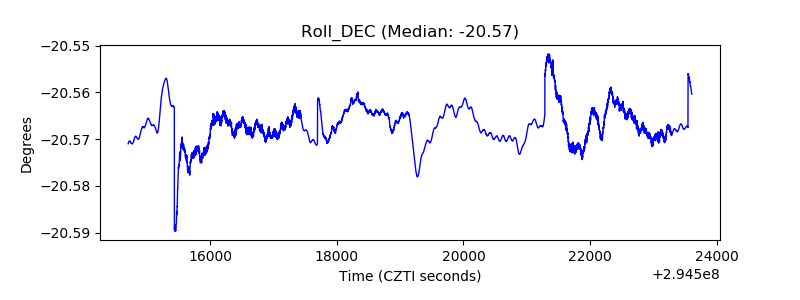 |
| _Roll_RA | 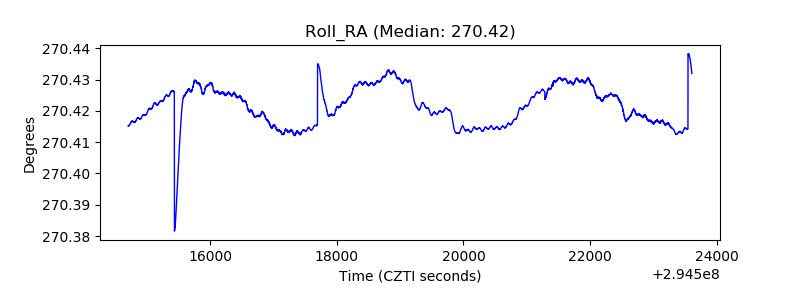 |
| Veto Counter | 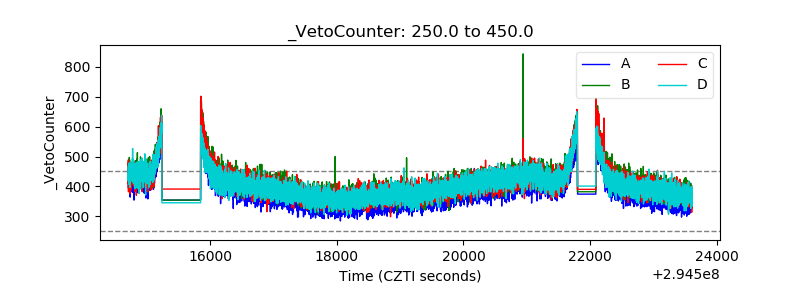 |