| Param | Original file | Final file |
|---|---|---|
| Filename | modeM0/AS1A05_221T01_9000002888_19430cztM0_level2.evt | modeM0/AS1A05_221T01_9000002888_19430cztM0_level2_quad_clean.evt |
| Size (bytes) | 539,712,000 | 99,025,920 |
| Size | 514.7 MB | 94.4 MB |
| Events in quadrant A | 3,540,516 | 630,685 |
| Events in quadrant B | 3,685,767 | 638,093 |
| Events in quadrant C | 3,529,600 | 622,374 |
| Events in quadrant D | 5,090,379 | 595,937 |
| Mode SS | |||
|---|---|---|---|
| Quadrant | BADHDUFLAG | Total packets | Discarded packets |
| A | 0 | 148 | 0 |
| B | 0 | 148 | 0 |
| C | 0 | 148 | 0 |
| D | 0 | 148 | 0 |
| Mode M9 | |||
|---|---|---|---|
| Quadrant | BADHDUFLAG | Total packets | Discarded packets |
| A | 0 | 4 | 0 |
| B | 0 | 4 | 0 |
| C | 0 | 4 | 0 |
| D | 0 | 4 | 0 |
| Mode M0 | |||
|---|---|---|---|
| Quadrant | BADHDUFLAG | Total packets | Discarded packets |
| A | 0 | 15242 | 1 |
| B | 0 | 15797 | 1 |
| C | 0 | 15128 | 1 |
| D | 0 | 20196 | 1 |
| Quadrant | Total seconds | Saturated seconds | Saturation percentage |
|---|---|---|---|
| A | 7355 | 28 | 0.380693% |
| B | 7356 | 86 | 1.169114% |
| C | 7356 | 69 | 0.938010% |
| D | 7356 | 347 | 4.717238% |
Noise dominated data is calculated using 1-second bins in cleaned event files. If a bin has >2000 counts, and if more than 50% of those come from <1% of pixels, then it is considered to be noise-dominated and hence unusable.
| Quadrant | # 1 sec bins | Bins with >0 counts | Bins with >2000 counts | High rate bins dominated by noise | Noise dominated (total time) | Noise dominated (detector-on time) | Marked lightcurve |
|---|---|---|---|---|---|---|---|
| A | 7690 | 7356 | 0 | 0 | 0.00% | 0.00% | 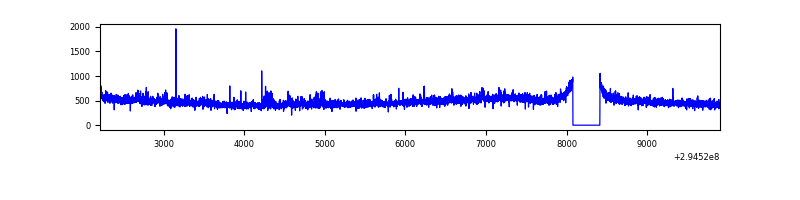 |
| B | 7691 | 7357 | 14 | 14 | 0.18% | 0.19% | 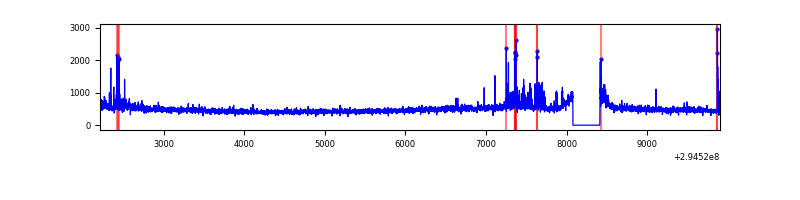 |
| C | 7691 | 7357 | 0 | 0 | 0.00% | 0.00% | 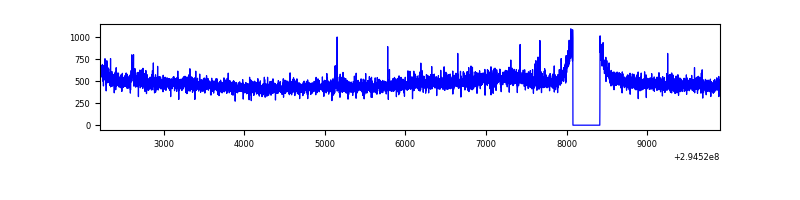 |
| D | 7691 | 7357 | 211 | 211 | 2.74% | 2.87% | 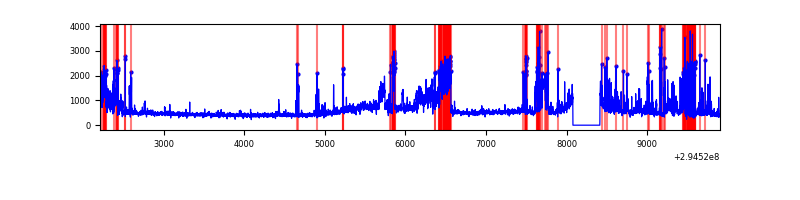 |
Top three noisy pixels from each quadrant. If the there are fewer than three noisy pixels in the level2.evt file, extra rows are filled as -1
| Pixel properties | Quadrant properties | ||||||
|---|---|---|---|---|---|---|---|
| Quadrant | DetID | PixID | Counts | Sigma | Mean | Median | Sigma |
| A | 3 | 1 | 96435 | 524.75 | 889 | 868 | 182.1 |
| A | 13 | 254 | 12590 | 64.36 | 889 | 868 | 182.1 |
| A | 0 | 226 | 7750 | 37.79 | 889 | 868 | 182.1 |
| B | 7 | 220 | 111775 | 654.46 | 887 | 865 | 169.5 |
| B | 0 | 197 | 25744 | 146.81 | 887 | 865 | 169.5 |
| B | 15 | 32 | 24575 | 139.91 | 887 | 865 | 169.5 |
| C | 14 | 238 | 130769 | 632.06 | 861 | 866 | 205.5 |
| C | 9 | 221 | 28613 | 135.01 | 861 | 866 | 205.5 |
| C | 3 | 233 | 14945 | 68.5 | 861 | 866 | 205.5 |
| D | 12 | 218 | 1065646 | 5071.41 | 856 | 830 | 210.0 |
| D | 1 | 52 | 699145 | 3325.87 | 856 | 830 | 210.0 |
| D | 7 | 238 | 47805 | 223.73 | 856 | 830 | 210.0 |
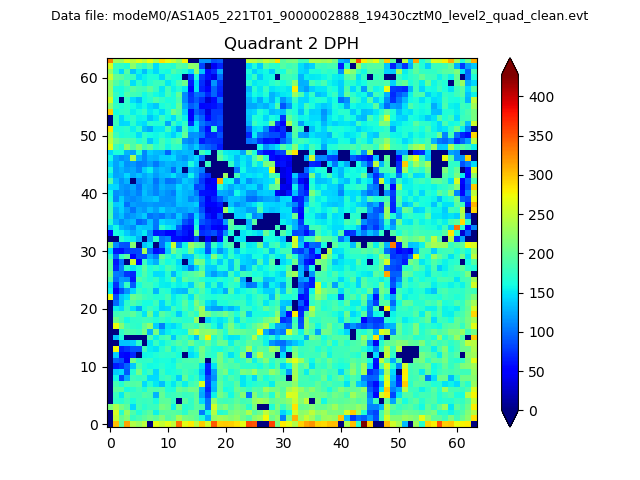
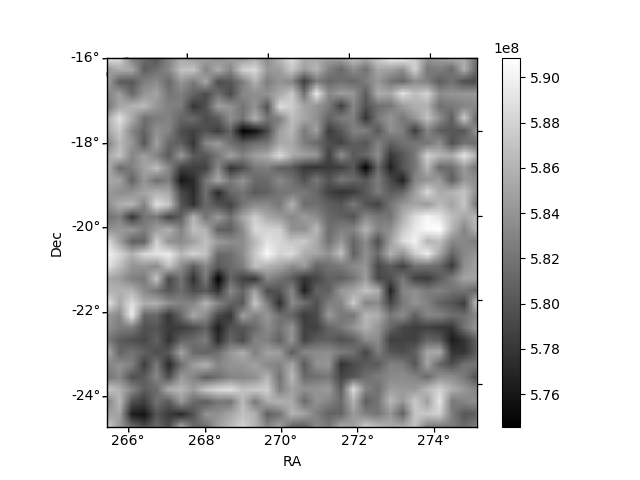
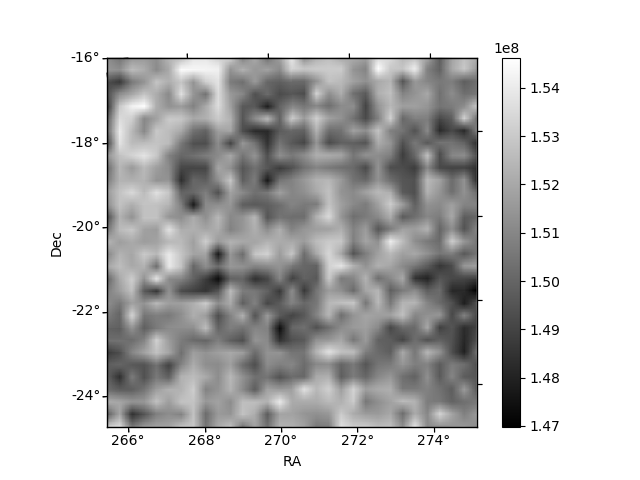
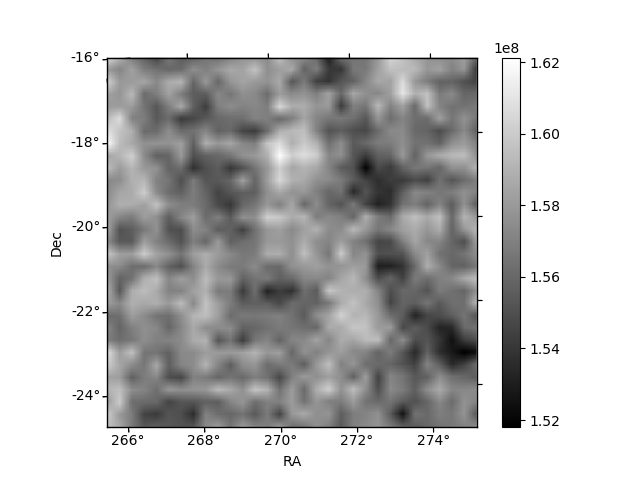
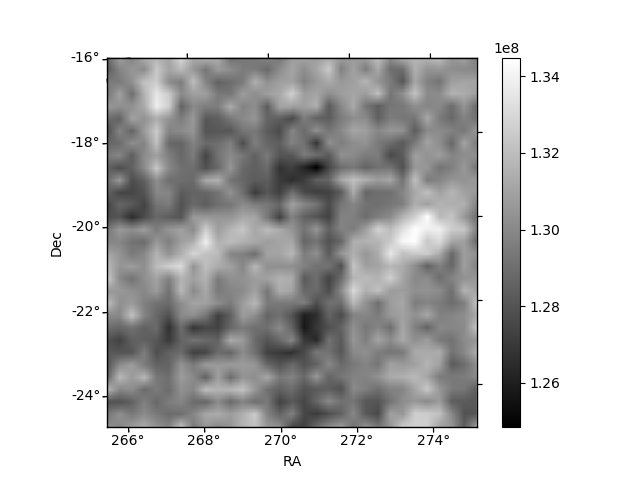
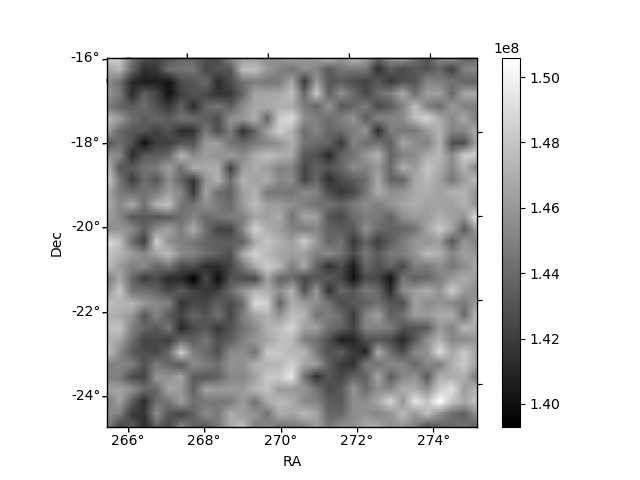
Histogram calculated using DETX and DETY for each event in the final _common_clean file
| Quadrant A | 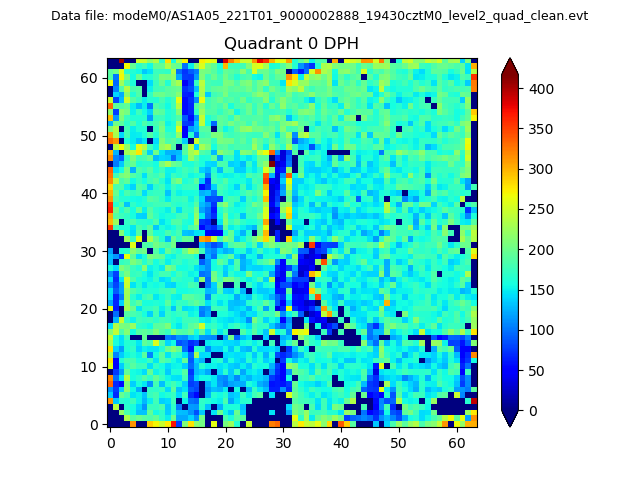 |
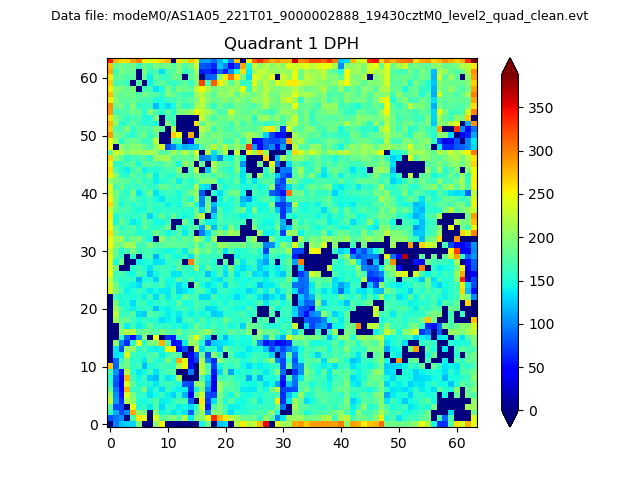 |
Quadrant B |
|---|---|---|---|
| Quadrant D | 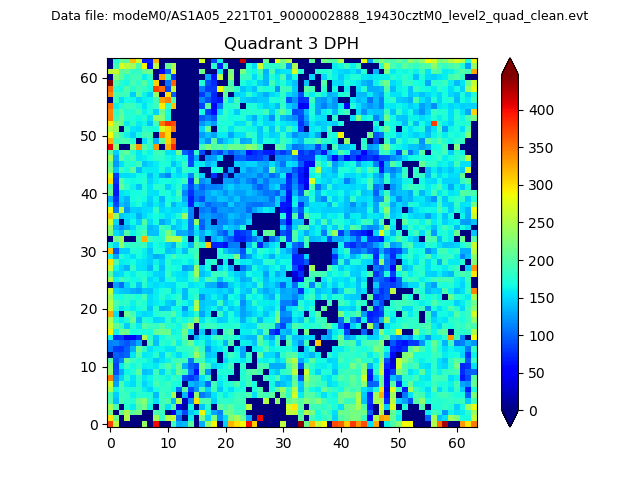 |
 |
Quadrant C |
| Plot type | Count rate plots | Images |
|---|---|---|
| Comparison with Poisson distribution Blue bars denote a histogram of data divided into 1 sec bins. Red curve is a Poisson curve with rate = median count rate of data. |
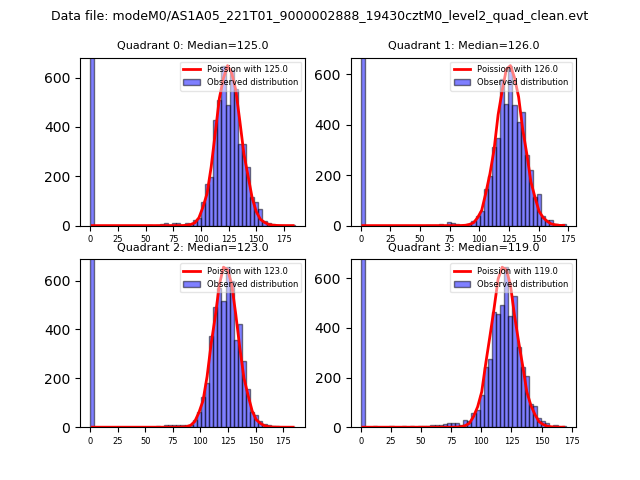 |
 |
| Quadrant-wise count rates Data is divided into 100 sec bins |
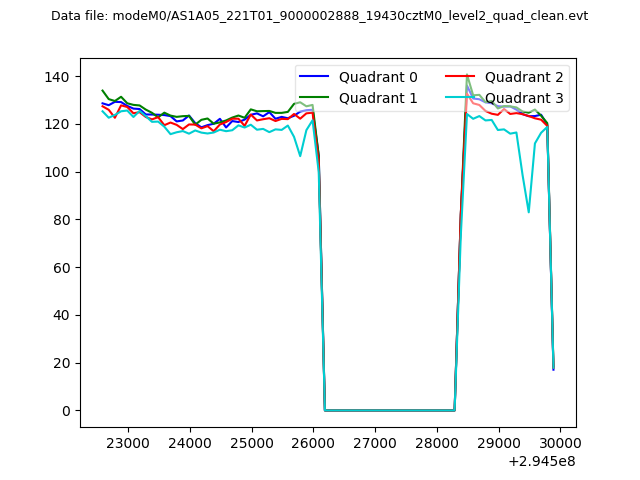 |
|
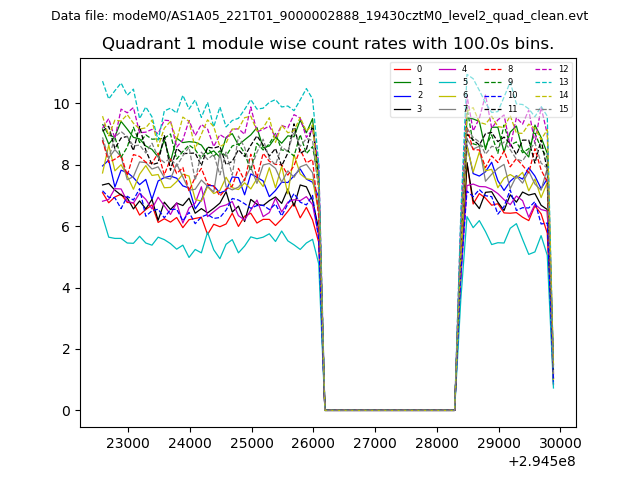
| Module-wise count rates for Quadrant A Data is divided into 100 sec bins |
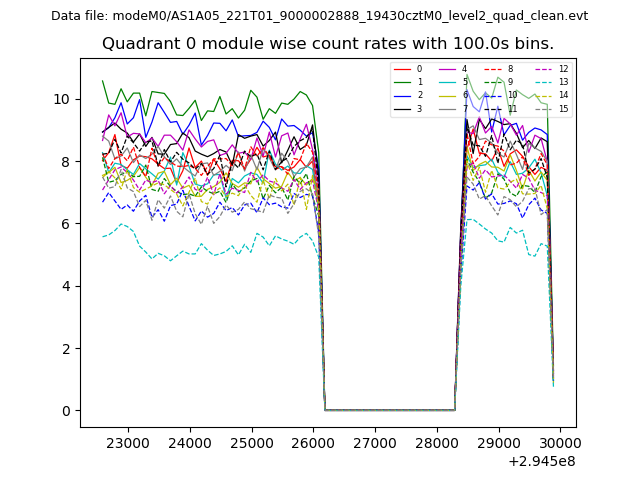 |
 |
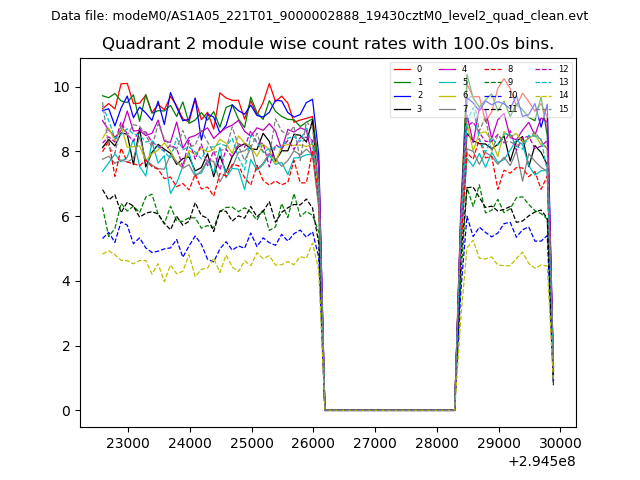
| Module-wise count rates for Quadrant B Data is divided into 100 sec bins |
 |
 |
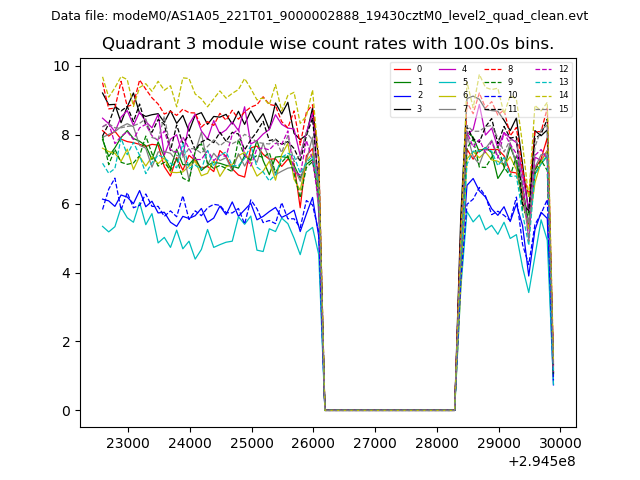
| Module-wise count rates for Quadrant C Data is divided into 100 sec bins |
 |
 |
| Module-wise count rates for Quadrant D Data is divided into 100 sec bins |
 |
 |
| Parameter | Plot |
|---|---|
| CZT HV Monitor | 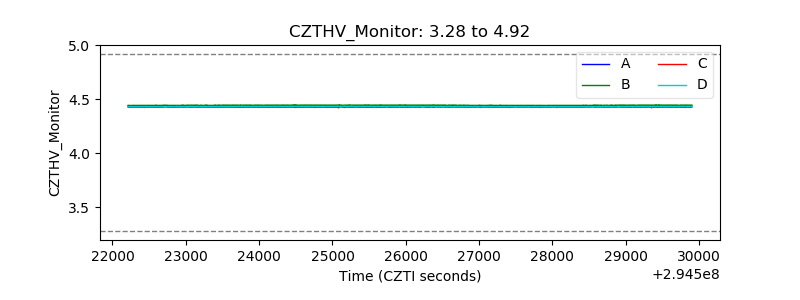 |
| D_VDD | 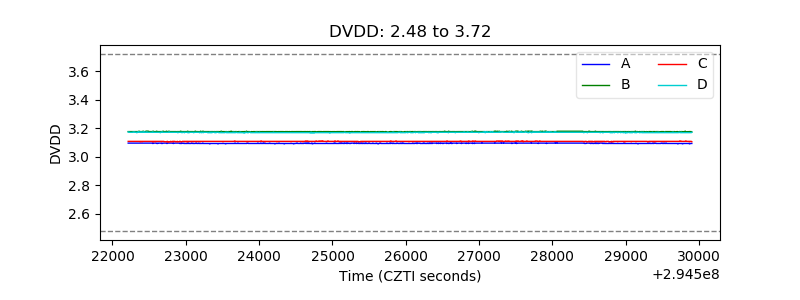 |
| Temperature 1 | 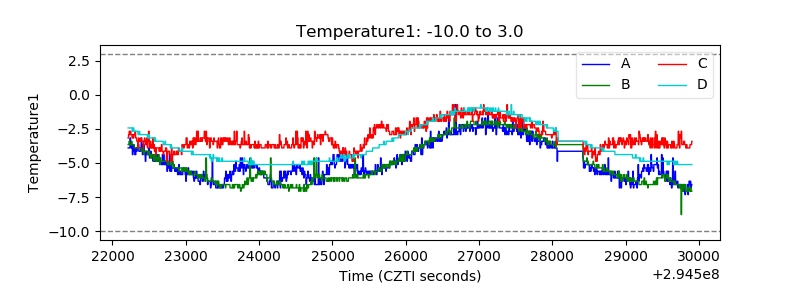 |
| Veto HV Monitor | 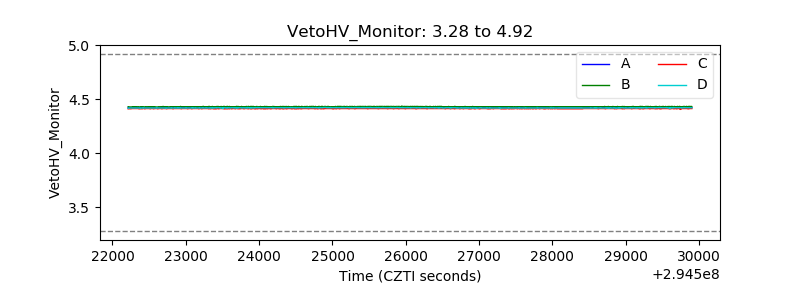 |
| Veto LLD | 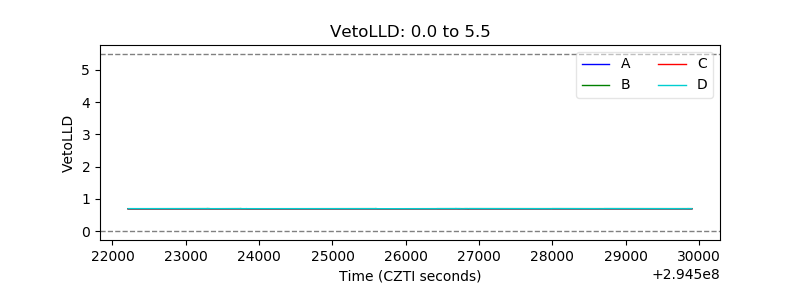 |
| Alpha Counter | 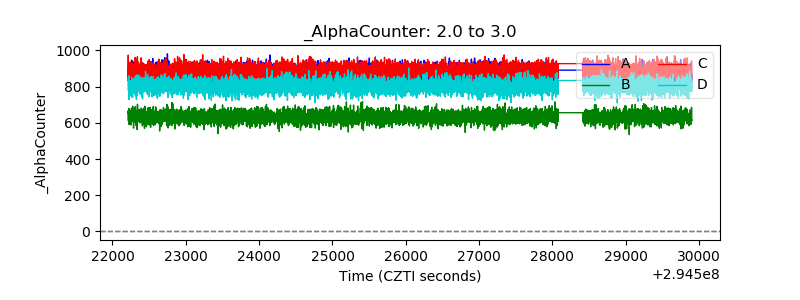 |
| _CPM_Rate | 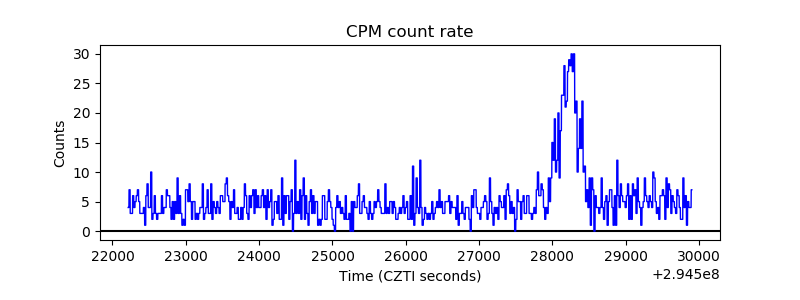 |
| CZT Counter | 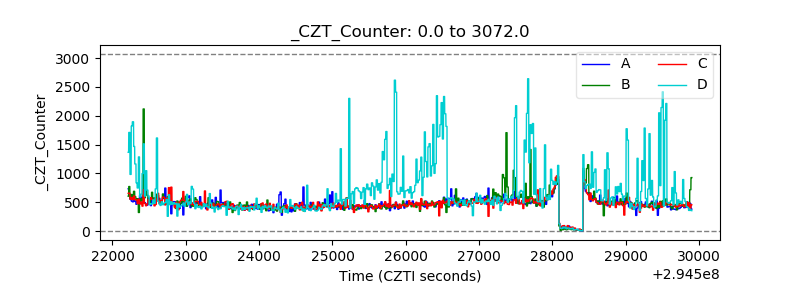 |
| +2.5 Volts monitor |  |
| +5 Volts monitor |  |
| _ROLL_ROT | 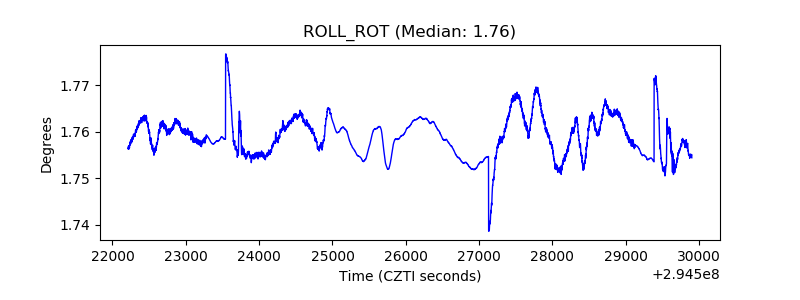 |
| _Roll_DEC | 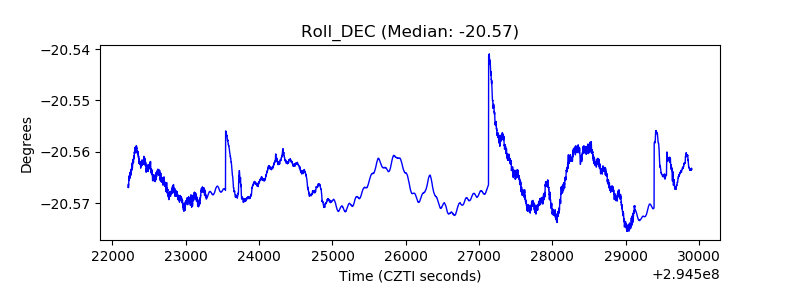 |
| _Roll_RA | 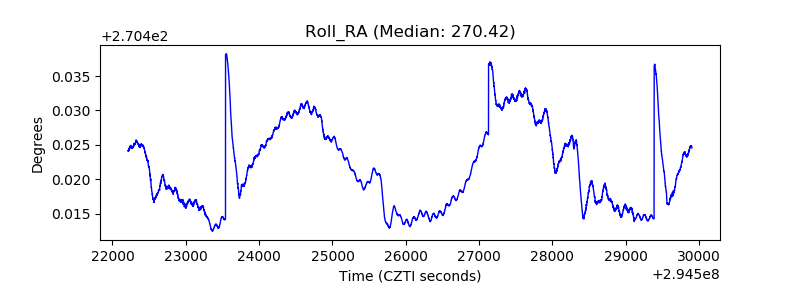 |
| Veto Counter | 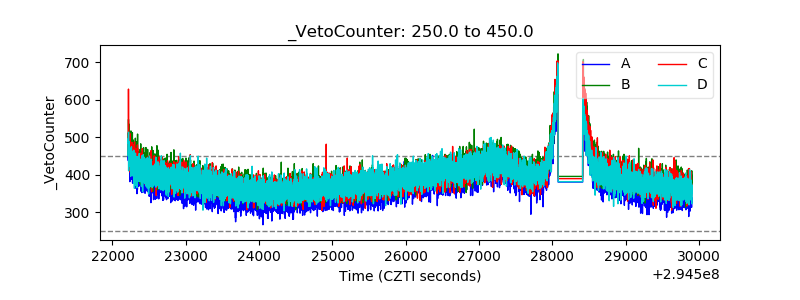 |