| Param | Original file | Final file |
|---|---|---|
| Filename | modeM0/AS1A05_221T01_9000002888_19434cztM0_level2.evt | modeM0/AS1A05_221T01_9000002888_19434cztM0_level2_quad_clean.evt |
| Size (bytes) | 900,691,200 | 151,007,040 |
| Size | 859.0 MB | 144.0 MB |
| Events in quadrant A | 5,954,508 | 943,996 |
| Events in quadrant B | 6,293,206 | 957,720 |
| Events in quadrant C | 6,097,131 | 929,374 |
| Events in quadrant D | 8,116,217 | 907,721 |
| Mode SS | |||
|---|---|---|---|
| Quadrant | BADHDUFLAG | Total packets | Discarded packets |
| A | 0 | 287 | 41 |
| B | 0 | 293 | 51 |
| C | 0 | 291 | 48 |
| D | 0 | 292 | 46 |
| Mode M9 | |||
|---|---|---|---|
| Quadrant | BADHDUFLAG | Total packets | Discarded packets |
| A | 0 | 24 | 1 |
| B | 0 | 24 | 1 |
| C | 0 | 24 | 1 |
| D | 0 | 25 | 2 |
| Mode M0 | |||
|---|---|---|---|
| Quadrant | BADHDUFLAG | Total packets | Discarded packets |
| A | 0 | 29835 | 4781 |
| B | 0 | 31187 | 5028 |
| C | 0 | 30086 | 4716 |
| D | 0 | 37466 | 5417 |
| Quadrant | Total seconds | Saturated seconds | Saturation percentage |
|---|---|---|---|
| A | 12070 | 74 | 0.613090% |
| B | 12100 | 155 | 1.280992% |
| C | 12071 | 175 | 1.449756% |
| D | 12070 | 568 | 4.705882% |
Noise dominated data is calculated using 1-second bins in cleaned event files. If a bin has >2000 counts, and if more than 50% of those come from <1% of pixels, then it is considered to be noise-dominated and hence unusable.
| Quadrant | # 1 sec bins | Bins with >0 counts | Bins with >2000 counts | High rate bins dominated by noise | Noise dominated (total time) | Noise dominated (detector-on time) | Marked lightcurve |
|---|---|---|---|---|---|---|---|
| A | 23133 | 12216 | 3 | 3 | 0.01% | 0.02% | 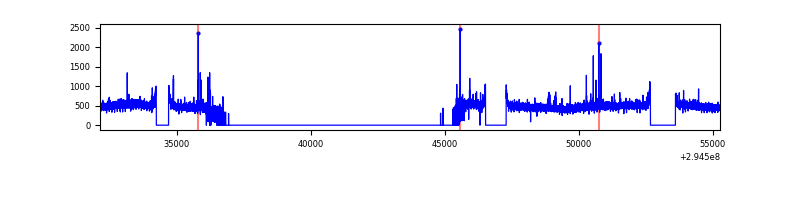 |
| B | 23133 | 12257 | 28 | 28 | 0.12% | 0.23% | 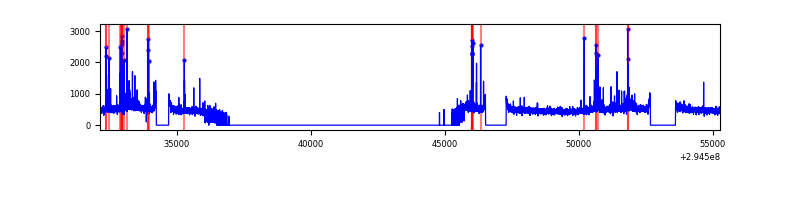 |
| C | 23133 | 12230 | 3 | 3 | 0.01% | 0.02% | 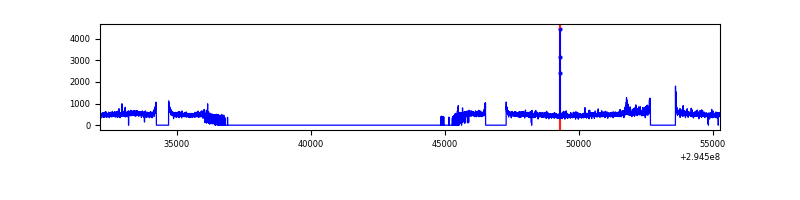 |
| D | 23133 | 12221 | 408 | 408 | 1.76% | 3.34% | 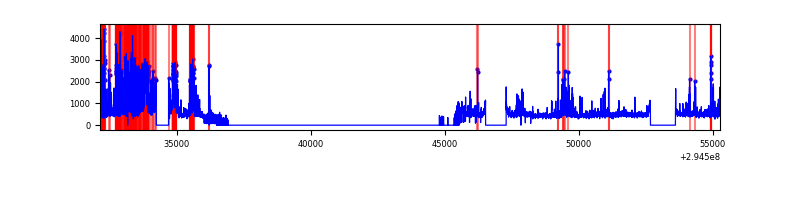 |
Top three noisy pixels from each quadrant. If the there are fewer than three noisy pixels in the level2.evt file, extra rows are filled as -1
| Pixel properties | Quadrant properties | ||||||
|---|---|---|---|---|---|---|---|
| Quadrant | DetID | PixID | Counts | Sigma | Mean | Median | Sigma |
| A | 3 | 1 | 120830 | 388.82 | 1506 | 1471 | 307.0 |
| A | 13 | 254 | 17978 | 53.77 | 1506 | 1471 | 307.0 |
| A | 12 | 96 | 15597 | 46.02 | 1506 | 1471 | 307.0 |
| B | 7 | 220 | 174394 | 603.51 | 1501 | 1463 | 286.5 |
| B | 0 | 198 | 66598 | 227.31 | 1501 | 1463 | 286.5 |
| B | 0 | 197 | 47857 | 161.91 | 1501 | 1463 | 286.5 |
| C | 14 | 238 | 224821 | 658.27 | 1447 | 1459 | 339.3 |
| C | 3 | 233 | 157982 | 461.29 | 1447 | 1459 | 339.3 |
| C | 9 | 221 | 63706 | 183.45 | 1447 | 1459 | 339.3 |
| D | 7 | 238 | 1995990 | 5656.82 | 1447 | 1403 | 352.6 |
| D | 1 | 52 | 464169 | 1312.45 | 1447 | 1403 | 352.6 |
| D | 12 | 218 | 57352 | 158.68 | 1447 | 1403 | 352.6 |
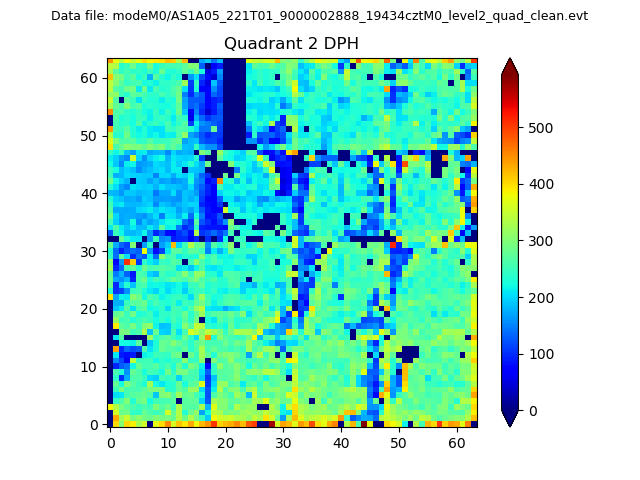
Histogram calculated using DETX and DETY for each event in the final _common_clean file
| Quadrant A | 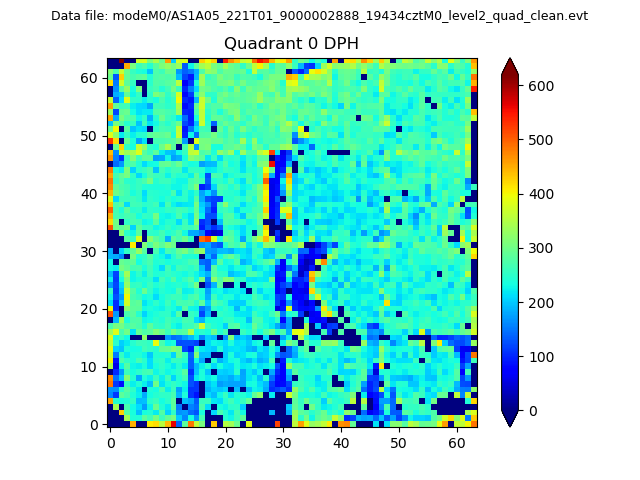 |
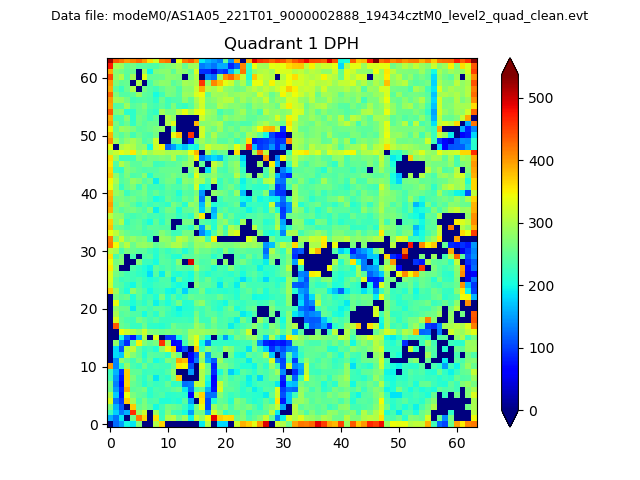 |
Quadrant B |
|---|---|---|---|
| Quadrant D | 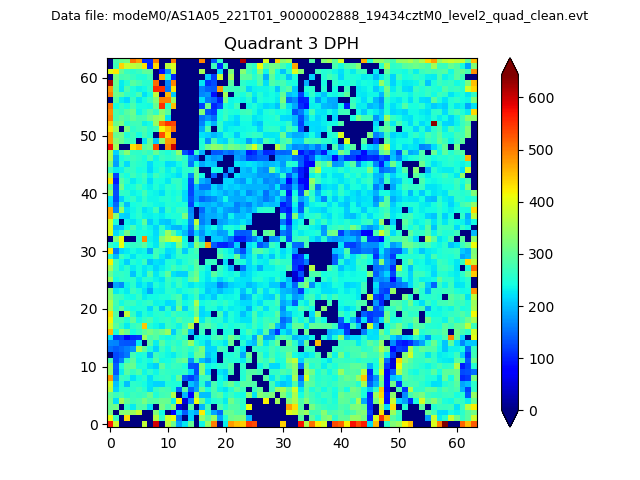 |
 |
Quadrant C |
| Plot type | Count rate plots | Images |
|---|---|---|
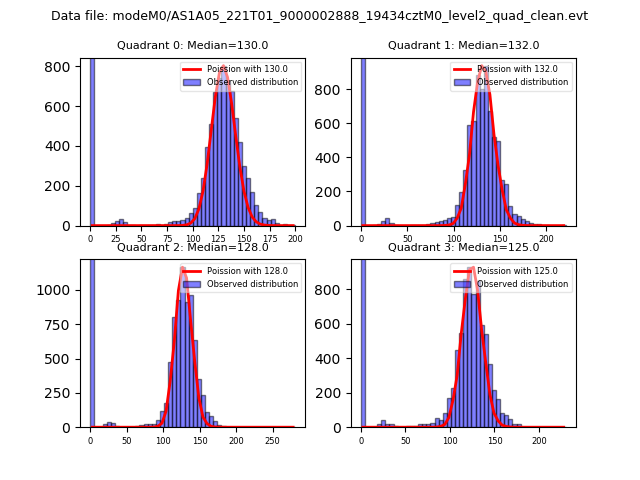
| Comparison with Poisson distribution Blue bars denote a histogram of data divided into 1 sec bins. Red curve is a Poisson curve with rate = median count rate of data. |
 |
 |
| Quadrant-wise count rates Data is divided into 100 sec bins |
 |
|
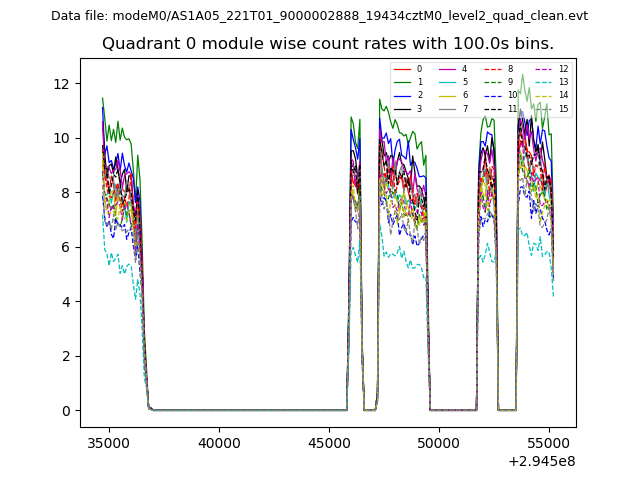
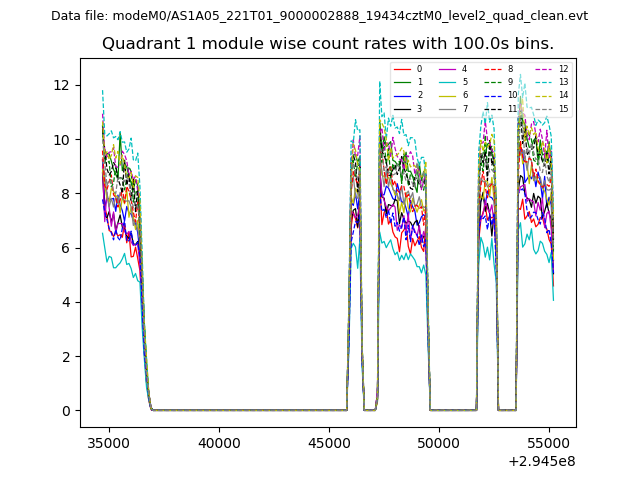
| Module-wise count rates for Quadrant A Data is divided into 100 sec bins |
 |
 |
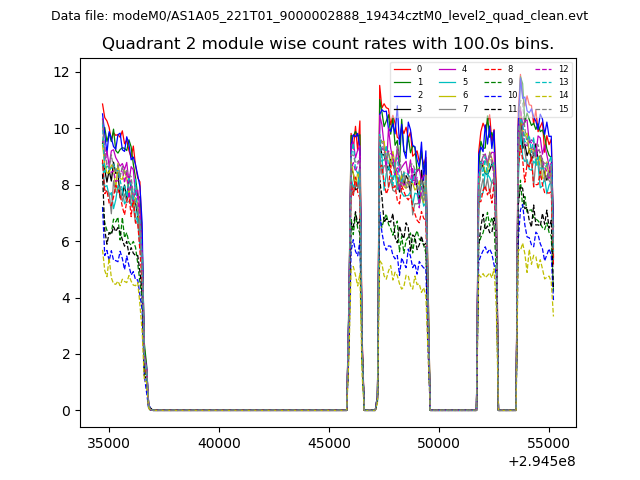
| Module-wise count rates for Quadrant B Data is divided into 100 sec bins |
 |
 |
| Module-wise count rates for Quadrant C Data is divided into 100 sec bins |
 |
 |
| Module-wise count rates for Quadrant D Data is divided into 100 sec bins |
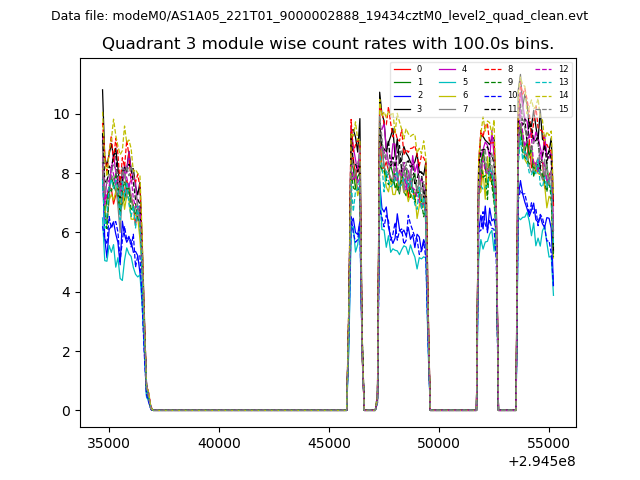 |
 |
| Parameter | Plot |
|---|---|
| CZT HV Monitor | 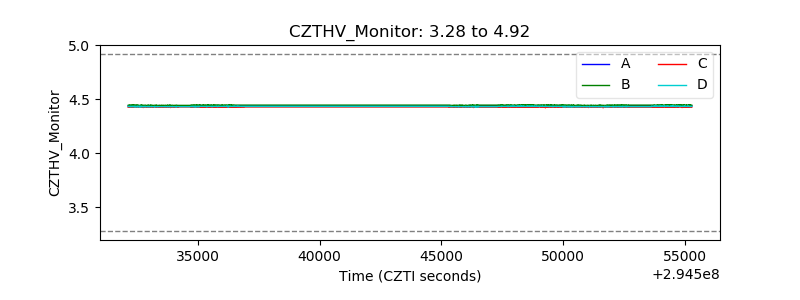 |
| D_VDD | 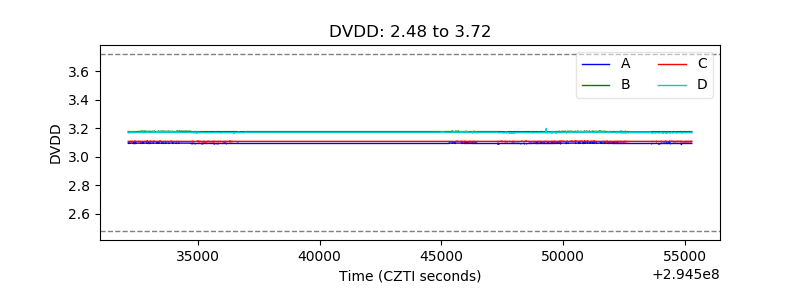 |
| Temperature 1 | 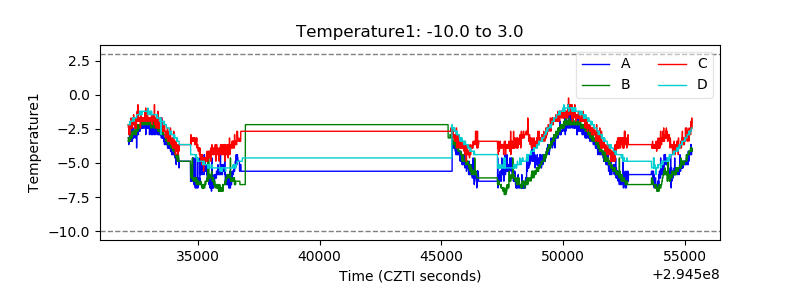 |
| Veto HV Monitor | 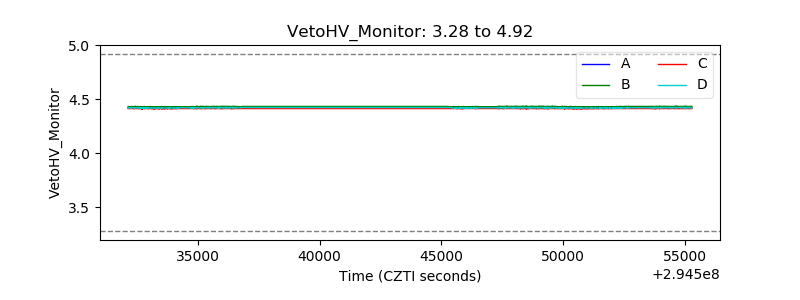 |
| Veto LLD | 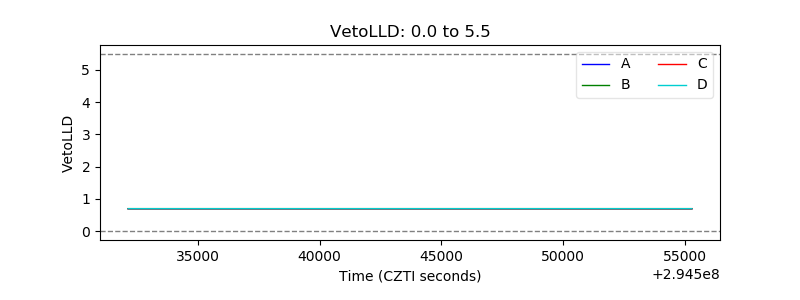 |
| Alpha Counter | 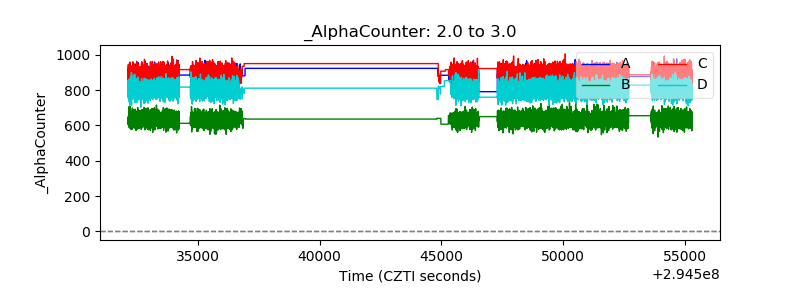 |
| _CPM_Rate | 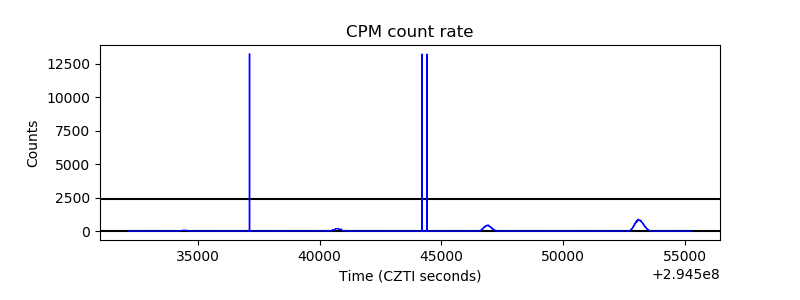 |
| CZT Counter | 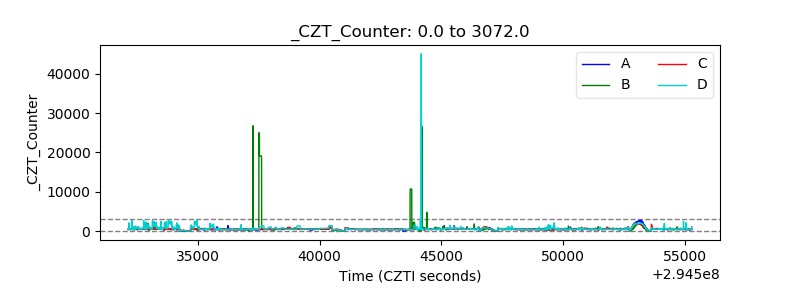 |
| +2.5 Volts monitor |  |
| +5 Volts monitor |  |
| _ROLL_ROT | 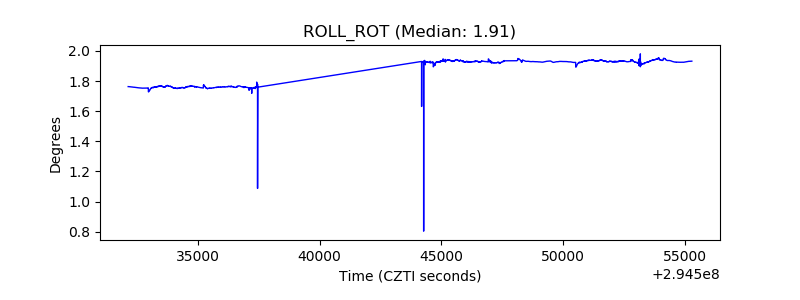 |
| _Roll_DEC | 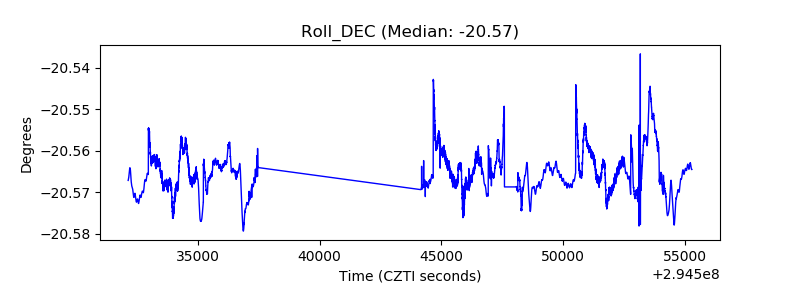 |
| _Roll_RA | 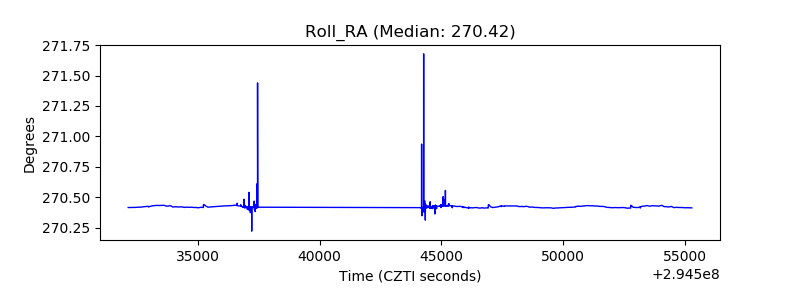 |
| Veto Counter | 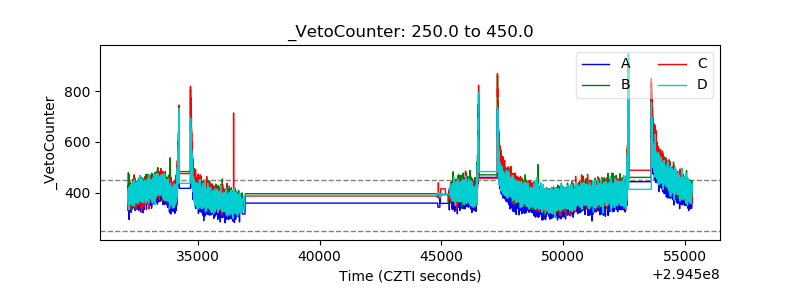 |