| Param | Original file | Final file |
|---|---|---|
| Filename | modeM0/AS1A05_221T01_9000002888_19436cztM0_level2.evt | modeM0/AS1A05_221T01_9000002888_19436cztM0_level2_quad_clean.evt |
| Size (bytes) | 605,105,280 | 95,244,480 |
| Size | 577.1 MB | 90.8 MB |
| Events in quadrant A | 3,372,641 | 615,445 |
| Events in quadrant B | 3,433,822 | 623,110 |
| Events in quadrant C | 3,402,450 | 601,564 |
| Events in quadrant D | 7,655,579 | 569,544 |
| Mode SS | |||
|---|---|---|---|
| Quadrant | BADHDUFLAG | Total packets | Discarded packets |
| A | 0 | 138 | 0 |
| B | 0 | 138 | 0 |
| C | 0 | 138 | 0 |
| D | 0 | 138 | 0 |
| Mode M9 | |||
|---|---|---|---|
| Quadrant | BADHDUFLAG | Total packets | Discarded packets |
| A | 0 | 12 | 0 |
| B | 0 | 13 | 0 |
| C | 0 | 13 | 0 |
| D | 0 | 13 | 0 |
| Mode M0 | |||
|---|---|---|---|
| Quadrant | BADHDUFLAG | Total packets | Discarded packets |
| A | 0 | 14099 | 2 |
| B | 0 | 14256 | 2 |
| C | 0 | 14227 | 2 |
| D | 0 | 27361 | 3 |
| Quadrant | Total seconds | Saturated seconds | Saturation percentage |
|---|---|---|---|
| A | 6811 | 41 | 0.601967% |
| B | 6811 | 36 | 0.528557% |
| C | 6811 | 77 | 1.130524% |
| D | 6810 | 1102 | 16.182085% |
Noise dominated data is calculated using 1-second bins in cleaned event files. If a bin has >2000 counts, and if more than 50% of those come from <1% of pixels, then it is considered to be noise-dominated and hence unusable.
| Quadrant | # 1 sec bins | Bins with >0 counts | Bins with >2000 counts | High rate bins dominated by noise | Noise dominated (total time) | Noise dominated (detector-on time) | Marked lightcurve |
|---|---|---|---|---|---|---|---|
| A | 7881 | 6811 | 0 | 0 | 0.00% | 0.00% | 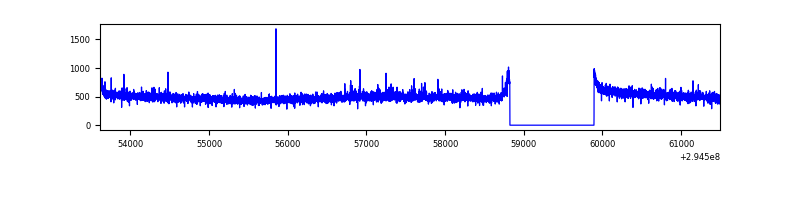 |
| B | 7881 | 6811 | 1 | 1 | 0.01% | 0.01% | 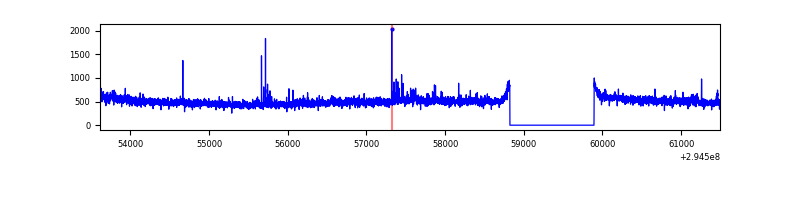 |
| C | 7881 | 6811 | 0 | 0 | 0.00% | 0.00% | 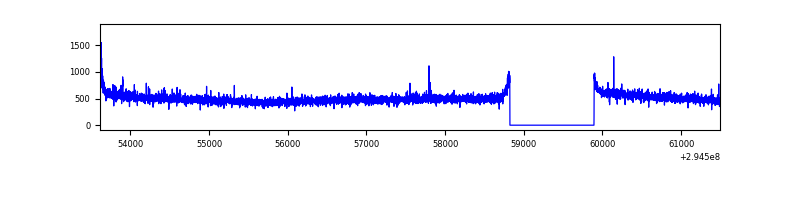 |
| D | 7880 | 6810 | 973 | 973 | 12.35% | 14.29% | 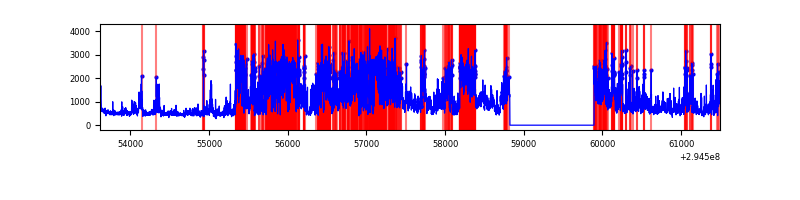 |
Top three noisy pixels from each quadrant. If the there are fewer than three noisy pixels in the level2.evt file, extra rows are filled as -1
| Pixel properties | Quadrant properties | ||||||
|---|---|---|---|---|---|---|---|
| Quadrant | DetID | PixID | Counts | Sigma | Mean | Median | Sigma |
| A | 3 | 1 | 34114 | 192.36 | 864 | 847 | 172.9 |
| A | 13 | 254 | 9863 | 52.13 | 864 | 847 | 172.9 |
| A | 0 | 226 | 7561 | 38.82 | 864 | 847 | 172.9 |
| B | 0 | 198 | 30152 | 181.92 | 852 | 830 | 161.2 |
| B | 0 | 197 | 22374 | 133.66 | 852 | 830 | 161.2 |
| B | 12 | 111 | 19429 | 115.39 | 852 | 830 | 161.2 |
| C | 14 | 238 | 130829 | 671.28 | 827 | 835 | 193.7 |
| C | 3 | 233 | 38636 | 195.2 | 827 | 835 | 193.7 |
| C | 9 | 221 | 7106 | 32.38 | 827 | 835 | 193.7 |
| D | 7 | 238 | 4614447 | 23965.39 | 802 | 781 | 192.5 |
| D | 2 | 234 | 26669 | 134.47 | 802 | 781 | 192.5 |
| D | 14 | 226 | 7866 | 36.8 | 802 | 781 | 192.5 |
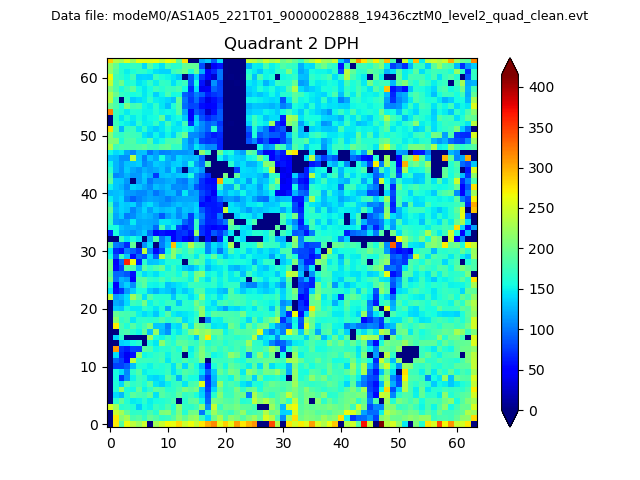
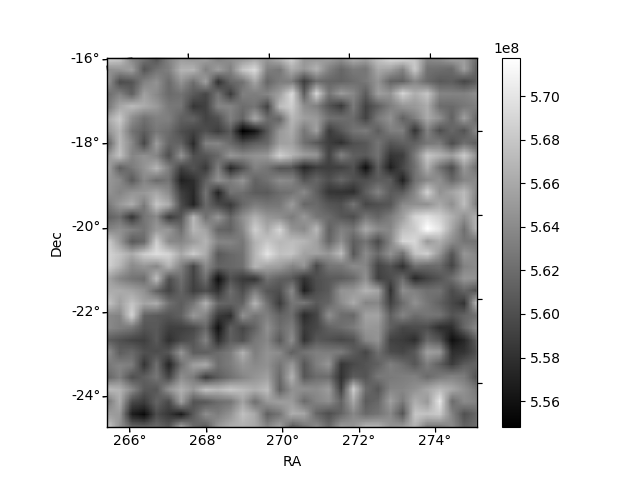
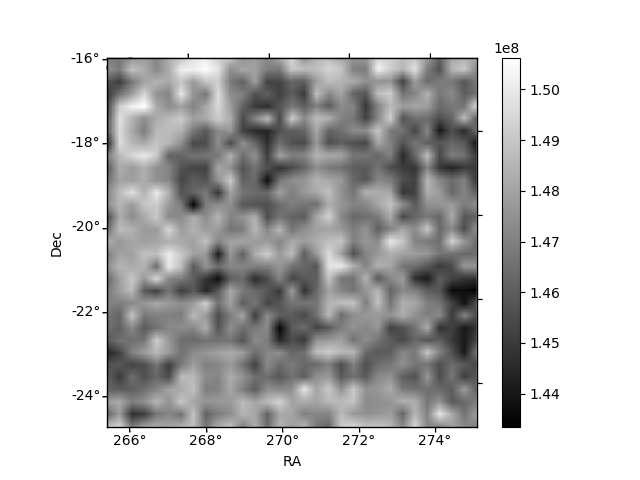
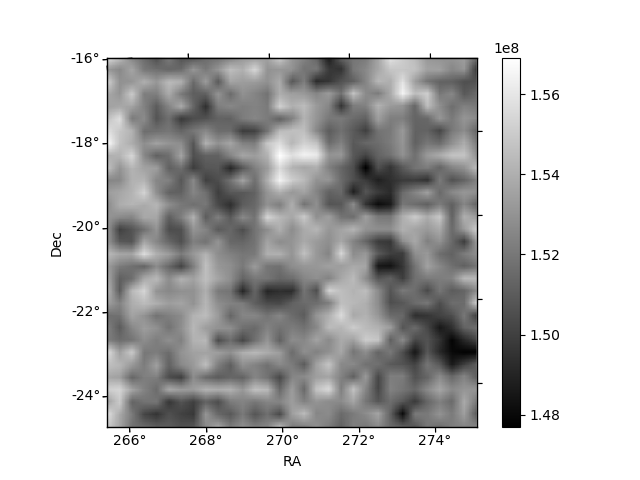
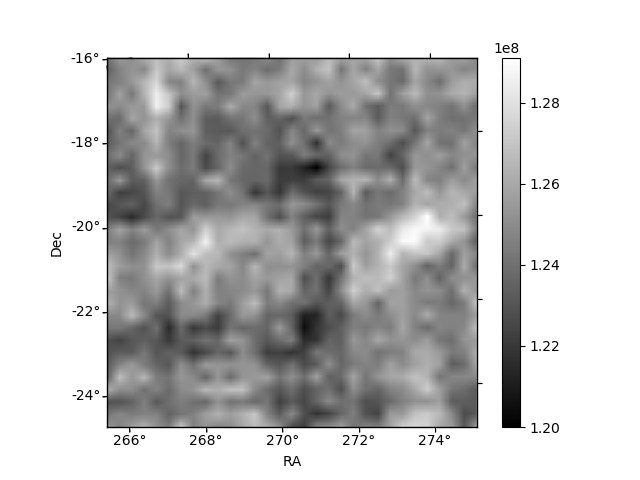
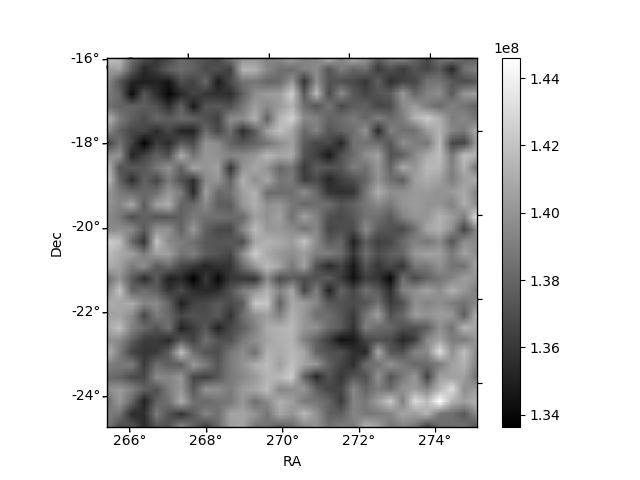
Histogram calculated using DETX and DETY for each event in the final _common_clean file
| Quadrant A | 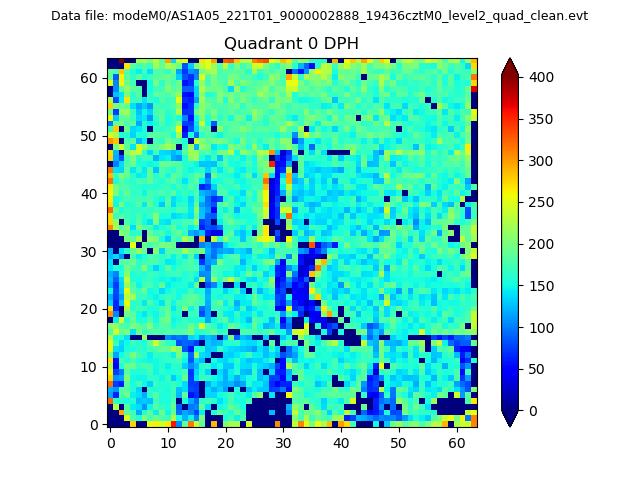 |
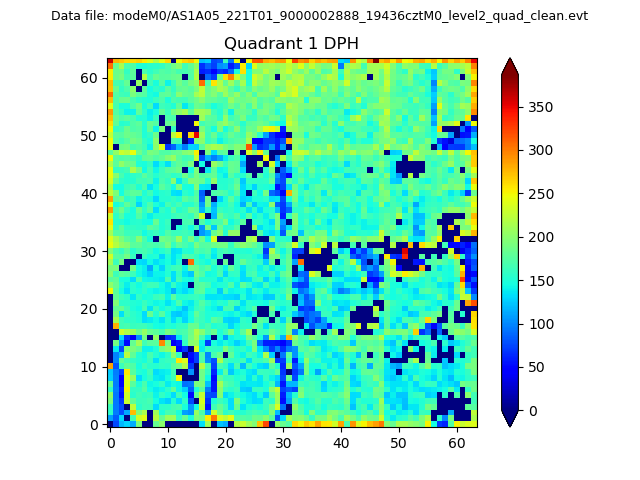 |
Quadrant B |
|---|---|---|---|
| Quadrant D | 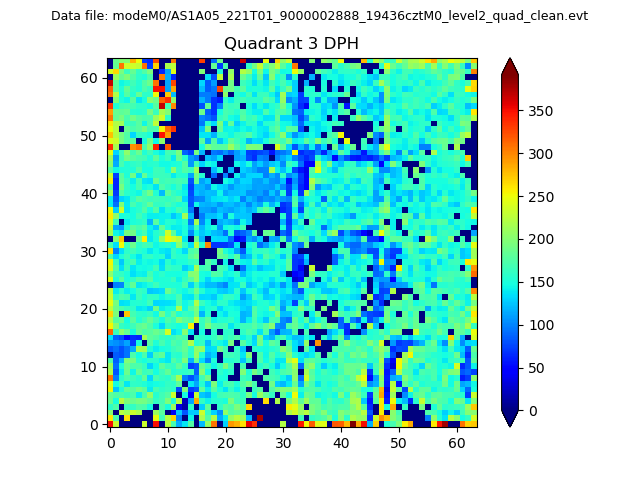 |
 |
Quadrant C |
| Plot type | Count rate plots | Images |
|---|---|---|
| Comparison with Poisson distribution Blue bars denote a histogram of data divided into 1 sec bins. Red curve is a Poisson curve with rate = median count rate of data. |
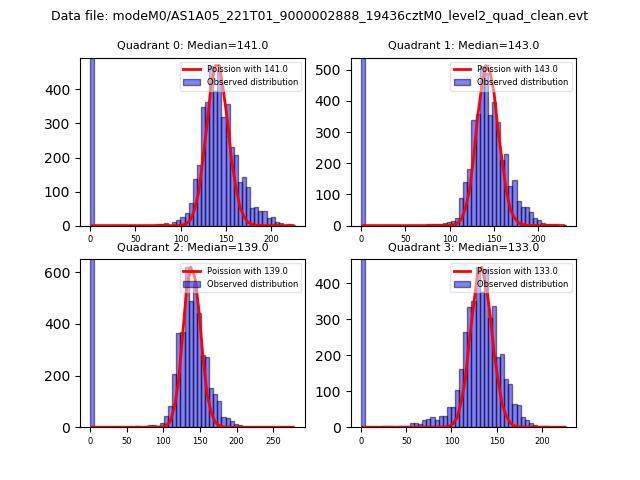 |
 |
| Quadrant-wise count rates Data is divided into 100 sec bins |
 |
|
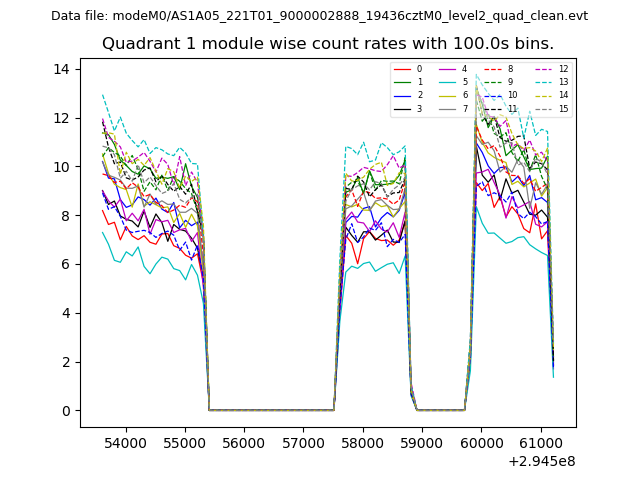
| Module-wise count rates for Quadrant A Data is divided into 100 sec bins |
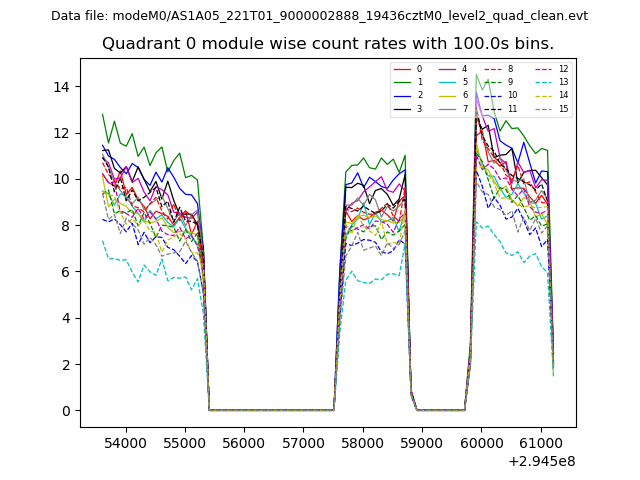 |
 |
| Module-wise count rates for Quadrant B Data is divided into 100 sec bins |
 |
 |
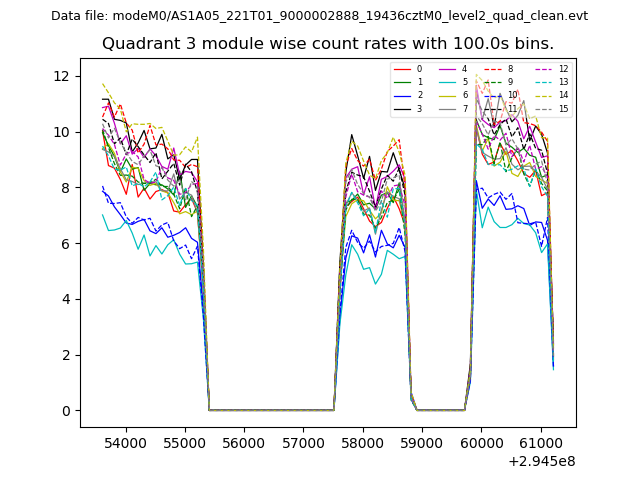
| Module-wise count rates for Quadrant C Data is divided into 100 sec bins |
 |
 |
| Module-wise count rates for Quadrant D Data is divided into 100 sec bins |
 |
 |
| Parameter | Plot |
|---|---|
| CZT HV Monitor |  |
| D_VDD | 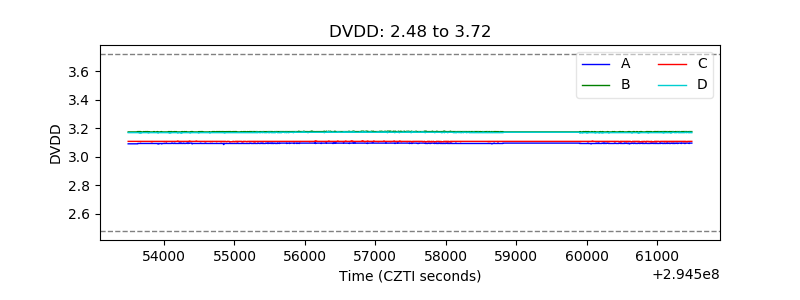 |
| Temperature 1 | 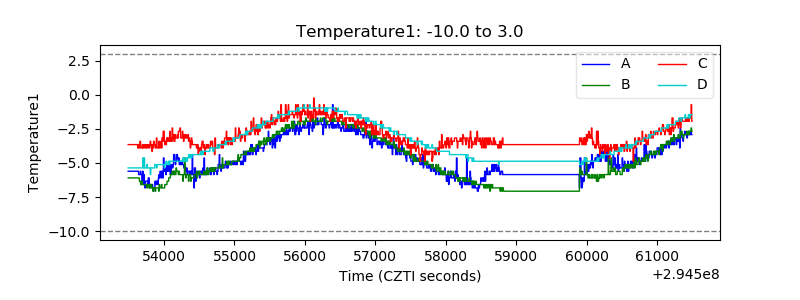 |
| Veto HV Monitor | 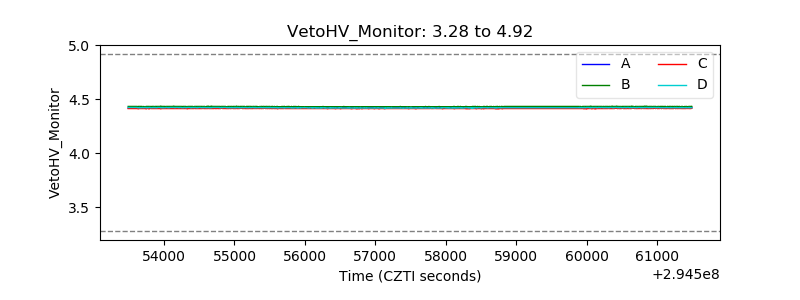 |
| Veto LLD | 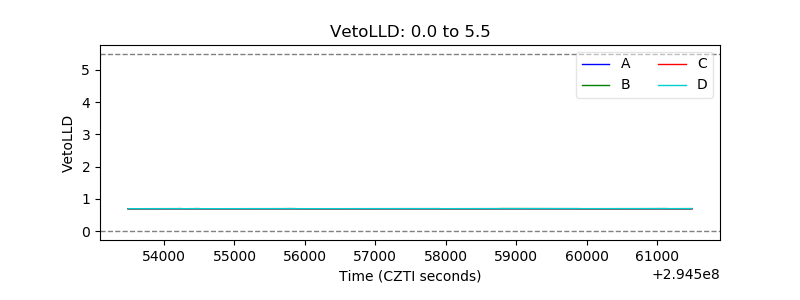 |
| Alpha Counter | 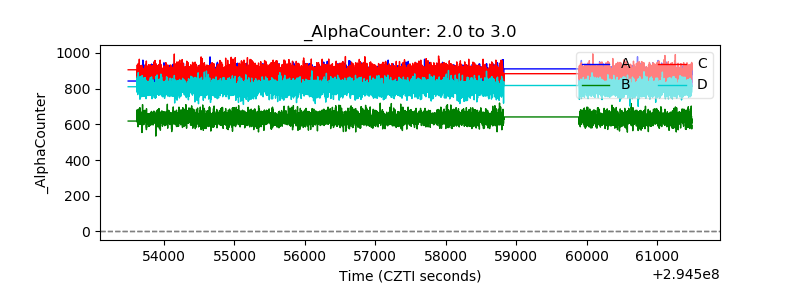 |
| _CPM_Rate | 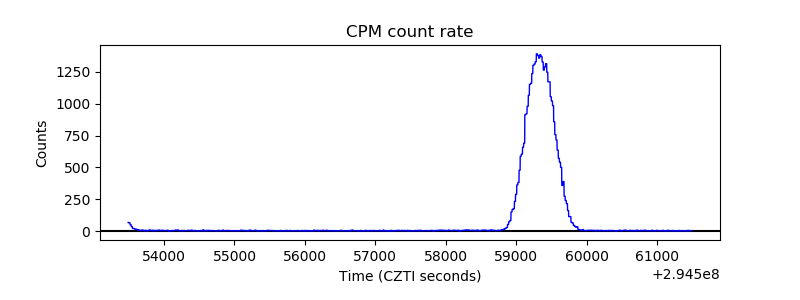 |
| CZT Counter | 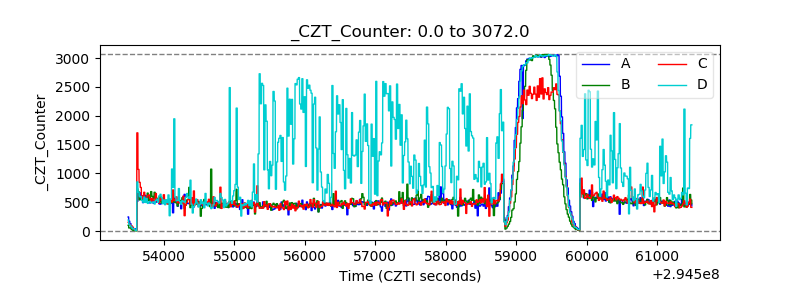 |
| +2.5 Volts monitor |  |
| +5 Volts monitor |  |
| _ROLL_ROT | 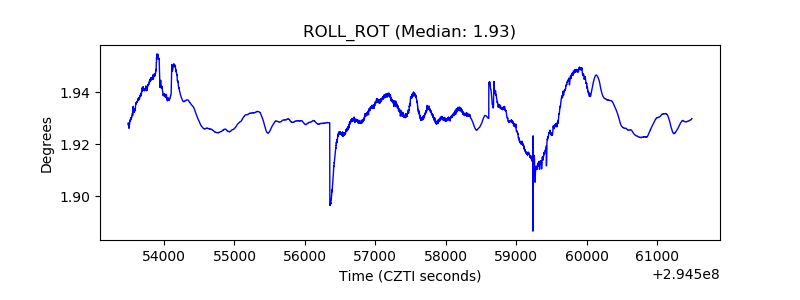 |
| _Roll_DEC | 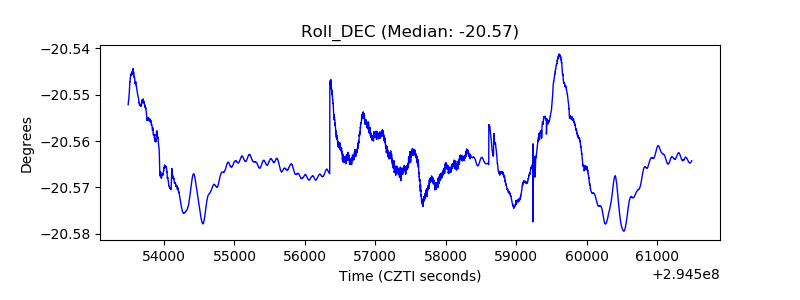 |
| _Roll_RA | 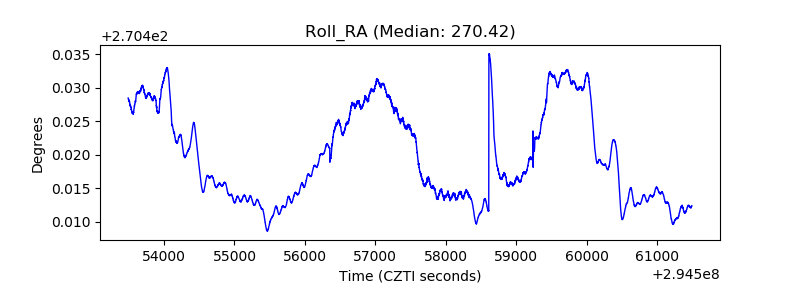 |
| Veto Counter | 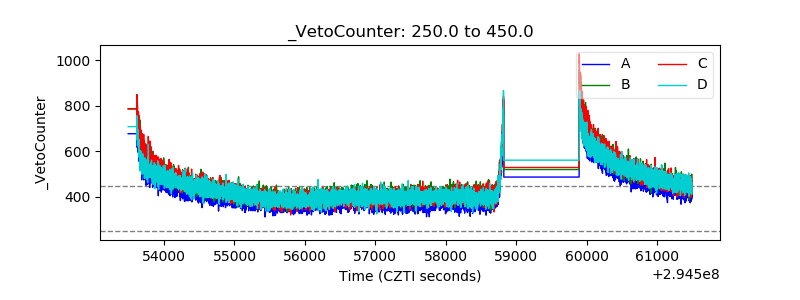 |