| Param | Original file | Final file |
|---|---|---|
| Filename | modeM0/AS1A05_221T01_9000002888_19437cztM0_level2.evt | modeM0/AS1A05_221T01_9000002888_19437cztM0_level2_quad_clean.evt |
| Size (bytes) | 2,578,824,000 | 404,245,440 |
| Size | 2.4 GB | 385.5 MB |
| Events in quadrant A | 16,180,804 | 2,529,916 |
| Events in quadrant B | 16,967,939 | 2,560,187 |
| Events in quadrant C | 16,480,131 | 2,487,537 |
| Events in quadrant D | 26,228,959 | 2,380,984 |
| Mode SS | |||
|---|---|---|---|
| Quadrant | BADHDUFLAG | Total packets | Discarded packets |
| A | 0 | 674 | 0 |
| B | 0 | 674 | 0 |
| C | 0 | 674 | 0 |
| D | 0 | 674 | 0 |
| Mode M9 | |||
|---|---|---|---|
| Quadrant | BADHDUFLAG | Total packets | Discarded packets |
| A | 0 | 52 | 0 |
| B | 0 | 52 | 0 |
| C | 0 | 52 | 0 |
| D | 0 | 52 | 0 |
| Mode M0 | |||
|---|---|---|---|
| Quadrant | BADHDUFLAG | Total packets | Discarded packets |
| A | 0 | 69047 | 6 |
| B | 0 | 71261 | 6 |
| C | 0 | 69692 | 6 |
| D | 0 | 100703 | 6 |
| Quadrant | Total seconds | Saturated seconds | Saturation percentage |
|---|---|---|---|
| A | 33267 | 196 | 0.589172% |
| B | 33267 | 370 | 1.112213% |
| C | 33267 | 362 | 1.088165% |
| D | 33267 | 2463 | 7.403733% |
Noise dominated data is calculated using 1-second bins in cleaned event files. If a bin has >2000 counts, and if more than 50% of those come from <1% of pixels, then it is considered to be noise-dominated and hence unusable.
| Quadrant | # 1 sec bins | Bins with >0 counts | Bins with >2000 counts | High rate bins dominated by noise | Noise dominated (total time) | Noise dominated (detector-on time) | Marked lightcurve |
|---|---|---|---|---|---|---|---|
| A | 38292 | 33270 | 3 | 3 | 0.01% | 0.01% | 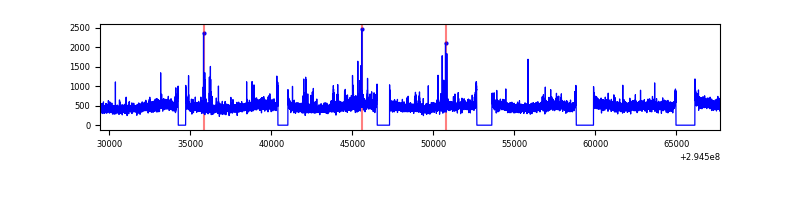 |
| B | 38292 | 33268 | 73 | 73 | 0.19% | 0.22% | 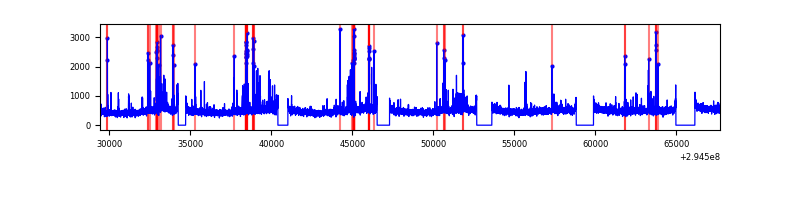 |
| C | 38292 | 33268 | 4 | 4 | 0.01% | 0.01% | 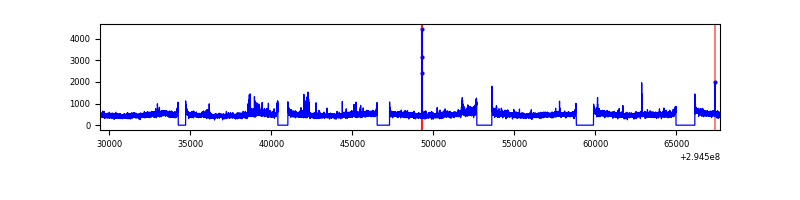 |
| D | 38292 | 33269 | 2018 | 2018 | 5.27% | 6.07% | 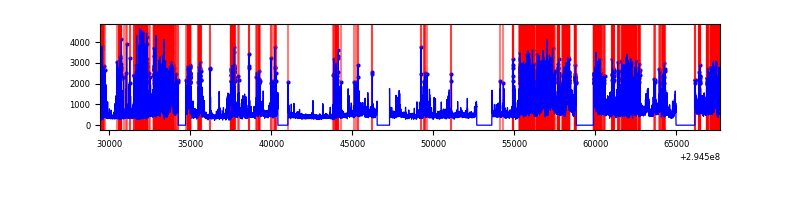 |
Top three noisy pixels from each quadrant. If the there are fewer than three noisy pixels in the level2.evt file, extra rows are filled as -1
| Pixel properties | Quadrant properties | ||||||
|---|---|---|---|---|---|---|---|
| Quadrant | DetID | PixID | Counts | Sigma | Mean | Median | Sigma |
| A | 3 | 1 | 272393 | 324.35 | 4110 | 4027 | 827.4 |
| A | 13 | 254 | 51652 | 57.56 | 4110 | 4027 | 827.4 |
| A | 12 | 96 | 38860 | 42.1 | 4110 | 4027 | 827.4 |
| B | 7 | 220 | 364907 | 470.1 | 4073 | 3968 | 767.8 |
| B | 0 | 198 | 175983 | 224.04 | 4073 | 3968 | 767.8 |
| B | 3 | 64 | 139474 | 176.49 | 4073 | 3968 | 767.8 |
| C | 14 | 238 | 615112 | 666.63 | 3942 | 3976 | 916.8 |
| C | 9 | 221 | 298576 | 321.35 | 3942 | 3976 | 916.8 |
| C | 3 | 233 | 178156 | 190.0 | 3942 | 3976 | 916.8 |
| D | 7 | 238 | 9559418 | 10076.61 | 3914 | 3802 | 948.3 |
| D | 1 | 52 | 1590923 | 1673.65 | 3914 | 3802 | 948.3 |
| D | 2 | 234 | 136194 | 139.61 | 3914 | 3802 | 948.3 |
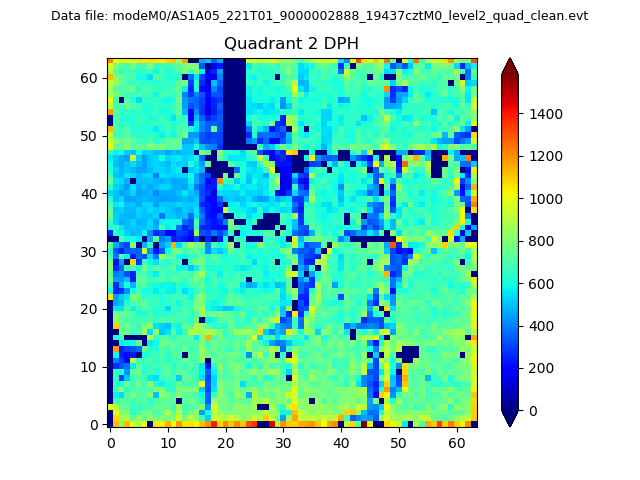
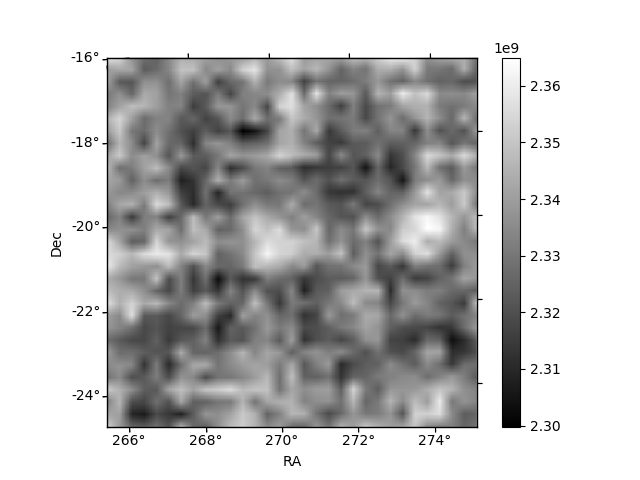
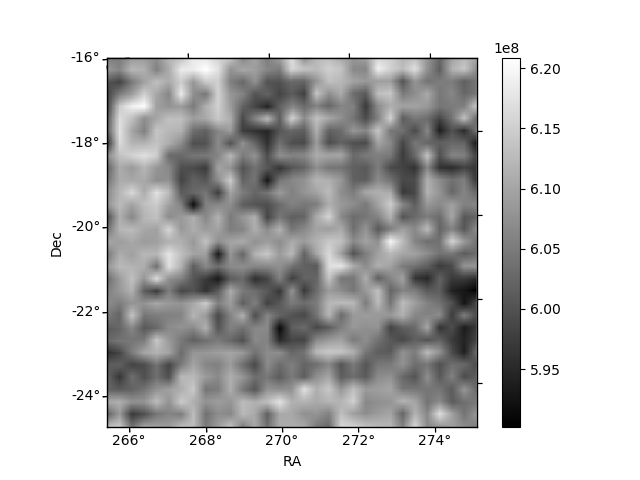
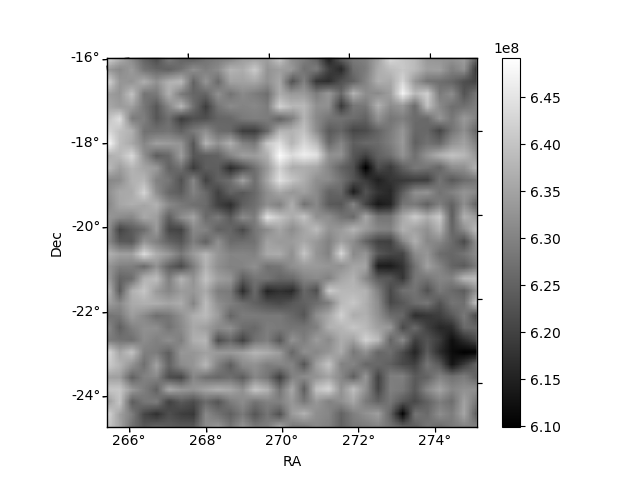
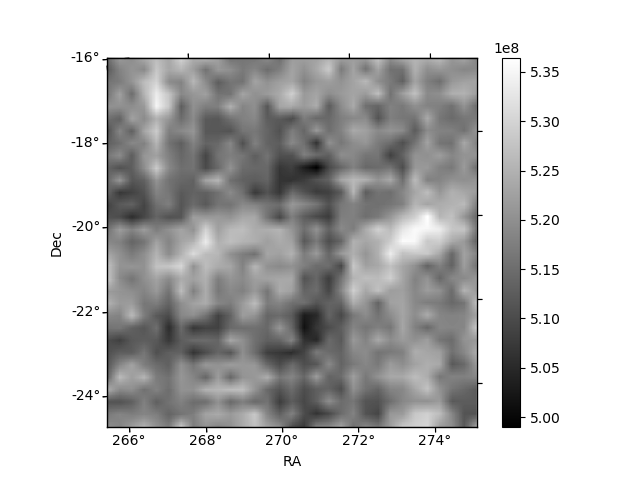
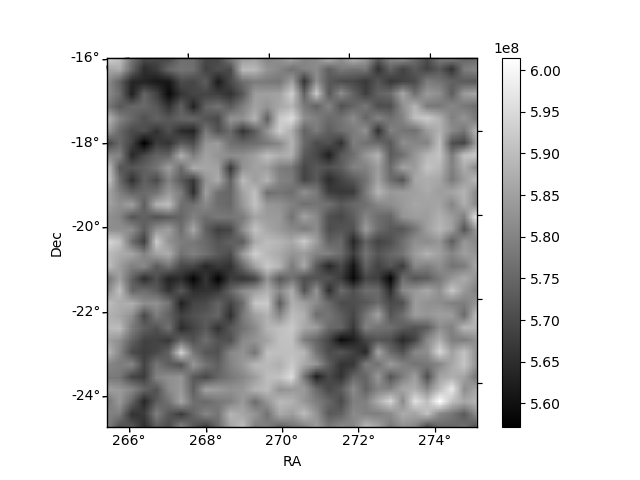
Histogram calculated using DETX and DETY for each event in the final _common_clean file
| Quadrant A | 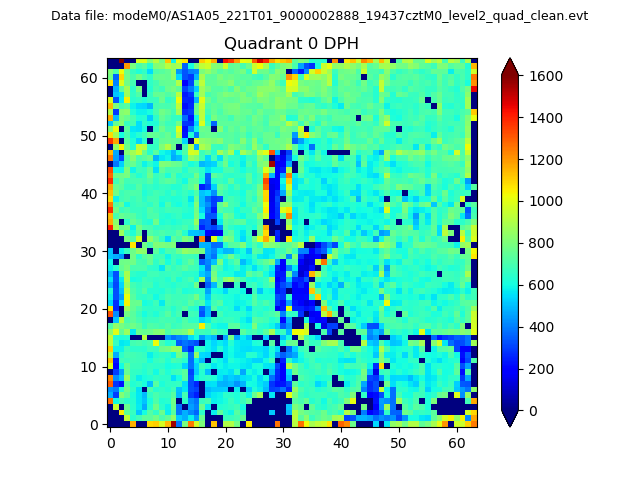 |
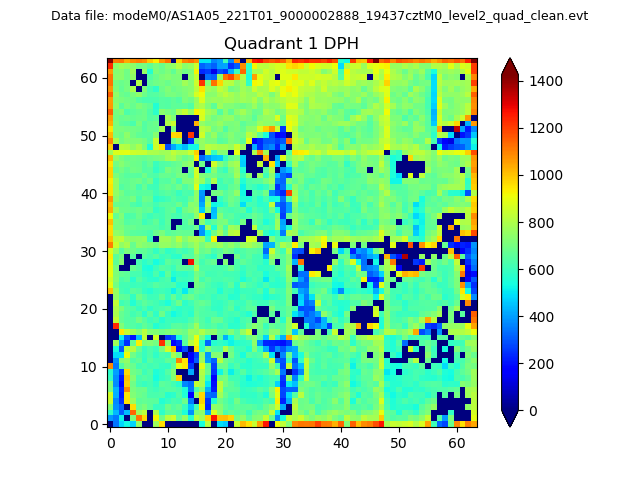 |
Quadrant B |
|---|---|---|---|
| Quadrant D | 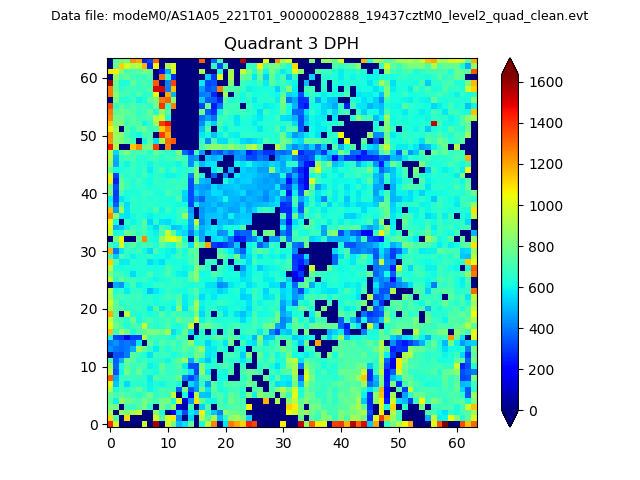 |
 |
Quadrant C |
| Plot type | Count rate plots | Images |
|---|---|---|
| Comparison with Poisson distribution Blue bars denote a histogram of data divided into 1 sec bins. Red curve is a Poisson curve with rate = median count rate of data. |
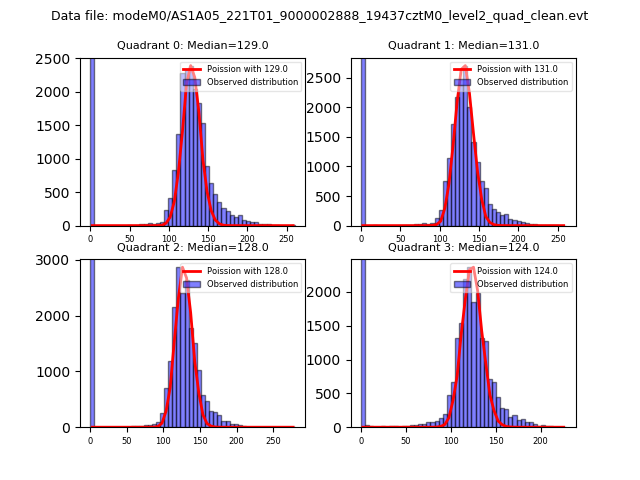 |
 |
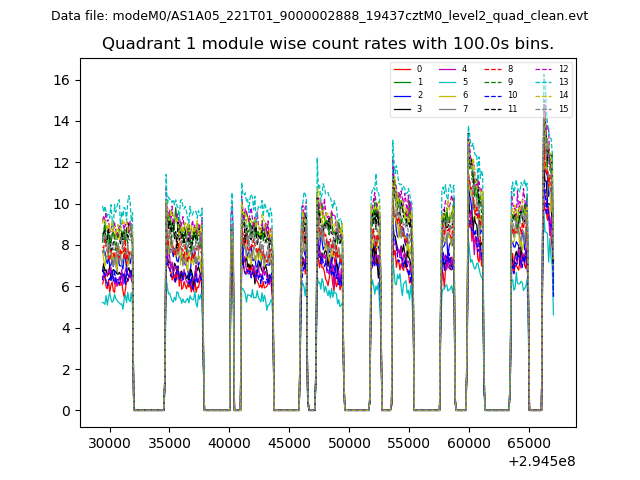
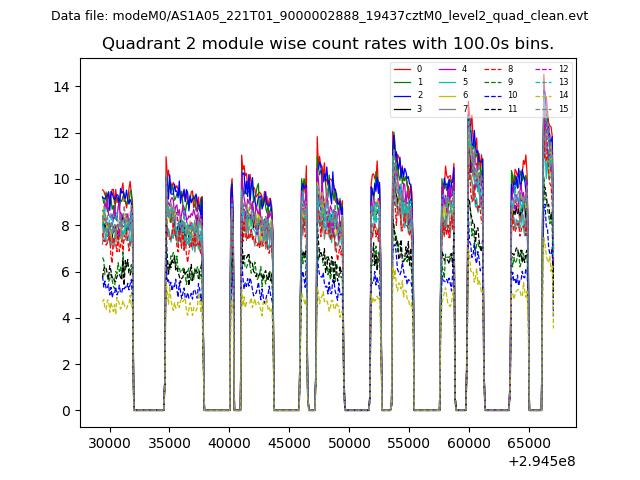
| Quadrant-wise count rates Data is divided into 100 sec bins |
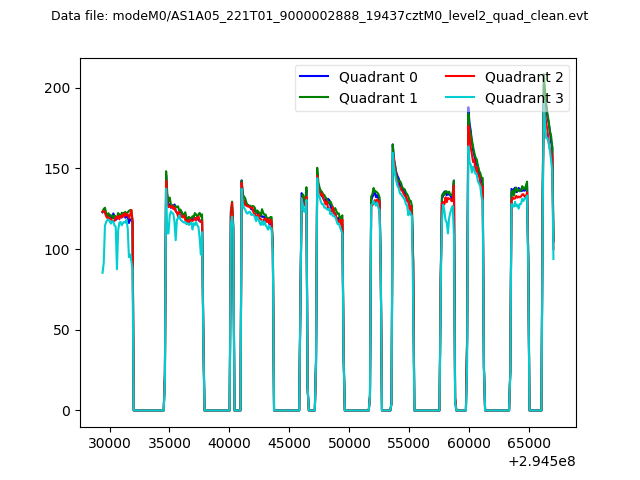 |
|
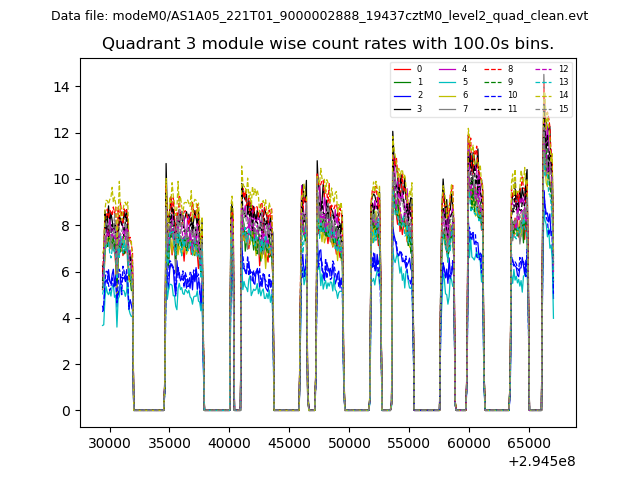
| Module-wise count rates for Quadrant A Data is divided into 100 sec bins |
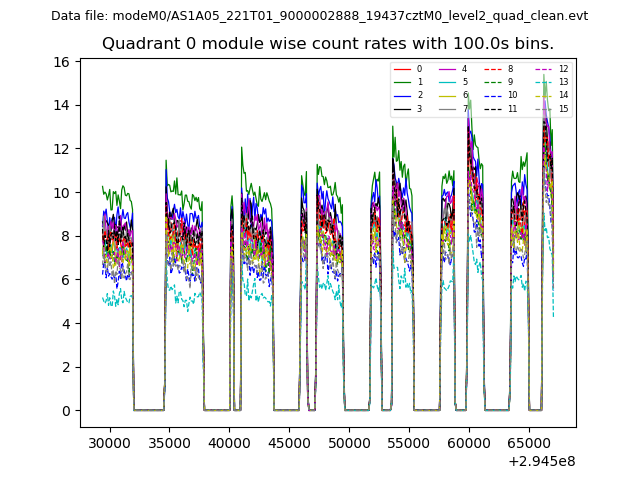 |
 |
| Module-wise count rates for Quadrant B Data is divided into 100 sec bins |
 |
 |
| Module-wise count rates for Quadrant C Data is divided into 100 sec bins |
 |
 |
| Module-wise count rates for Quadrant D Data is divided into 100 sec bins |
 |
 |
| Parameter | Plot |
|---|---|
| CZT HV Monitor | 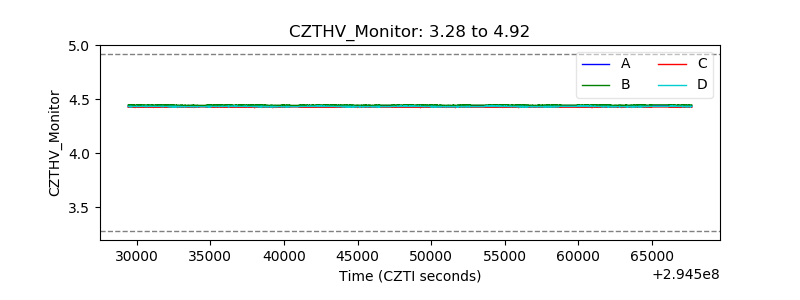 |
| D_VDD | 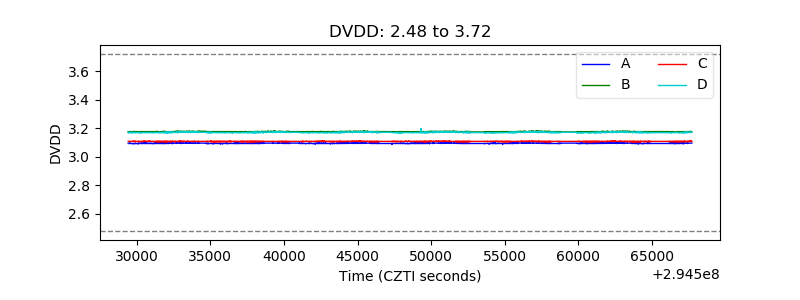 |
| Temperature 1 | 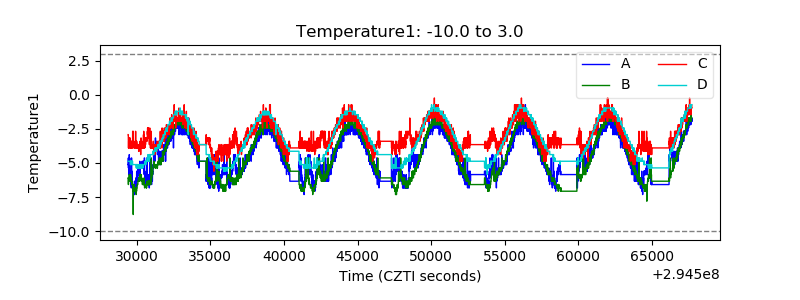 |
| Veto HV Monitor | 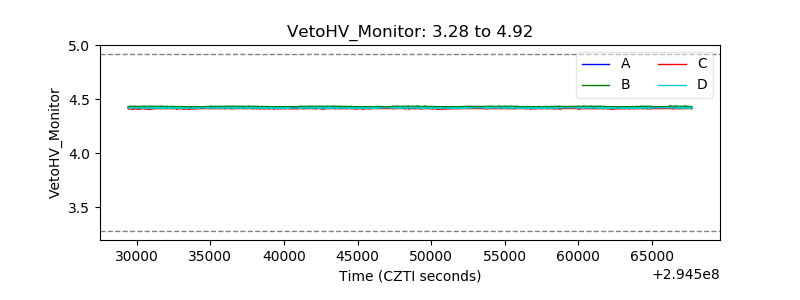 |
| Veto LLD | 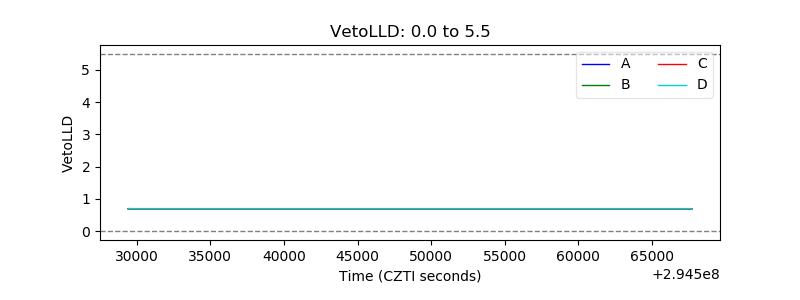 |
| Alpha Counter |  |
| _CPM_Rate | 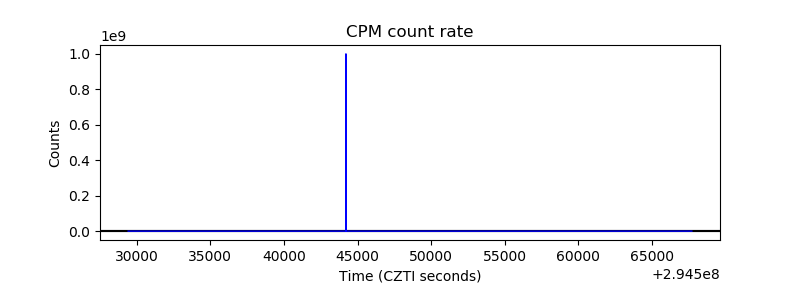 |
| CZT Counter | 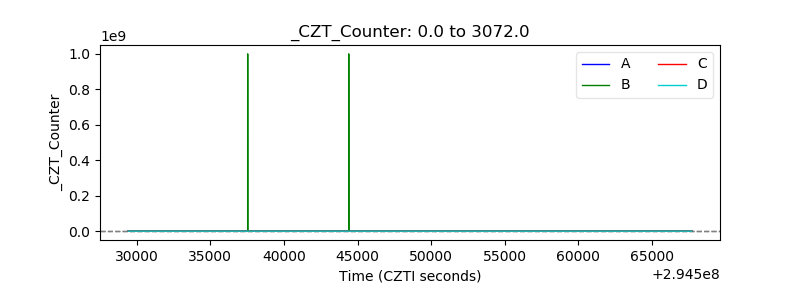 |
| +2.5 Volts monitor | 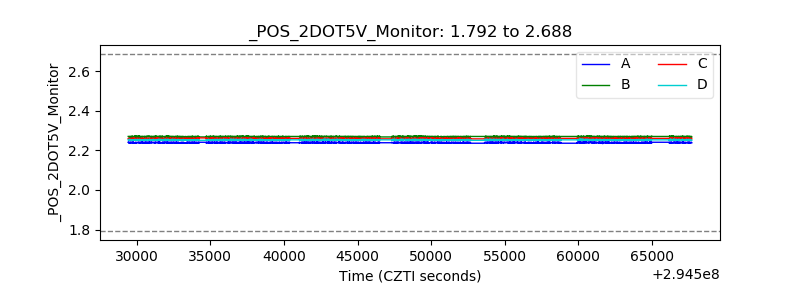 |
| +5 Volts monitor |  |
| _ROLL_ROT | 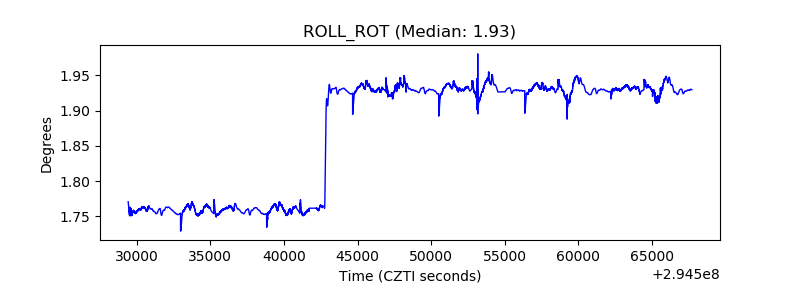 |
| _Roll_DEC | 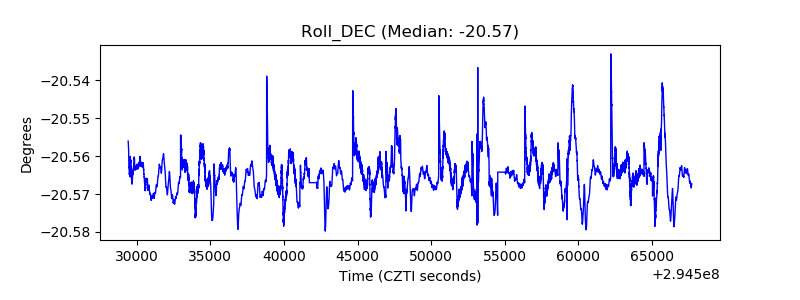 |
| _Roll_RA | 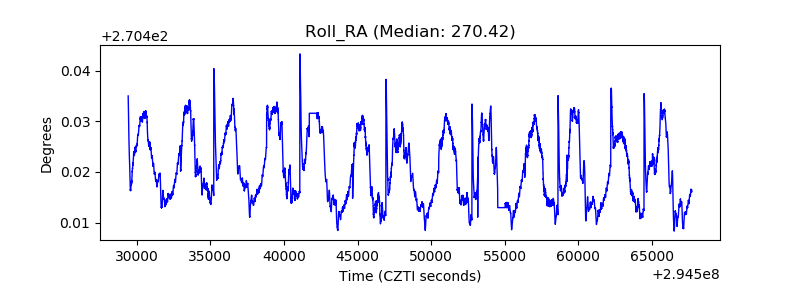 |
| Veto Counter | 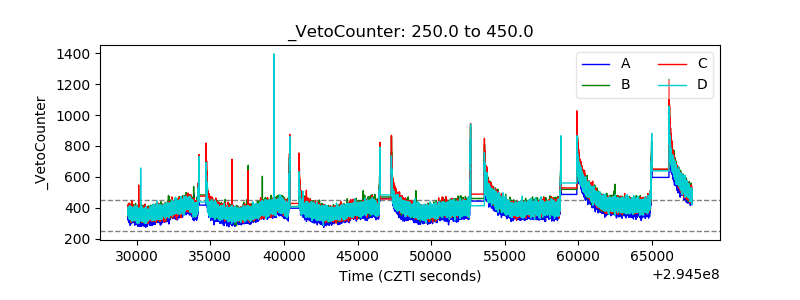 |