| Param | Original file | Final file |
|---|---|---|
| Filename | modeM0/AS1A05_221T01_9000002888_19438cztM0_level2.evt | modeM0/AS1A05_221T01_9000002888_19438cztM0_level2_quad_clean.evt |
| Size (bytes) | 598,253,760 | 83,171,520 |
| Size | 570.5 MB | 79.3 MB |
| Events in quadrant A | 3,612,203 | 528,201 |
| Events in quadrant B | 3,696,619 | 533,006 |
| Events in quadrant C | 3,682,820 | 505,430 |
| Events in quadrant D | 6,679,023 | 490,857 |
| Mode SS | |||
|---|---|---|---|
| Quadrant | BADHDUFLAG | Total packets | Discarded packets |
| A | 0 | 134 | 0 |
| B | 0 | 134 | 0 |
| C | 0 | 134 | 0 |
| D | 0 | 134 | 0 |
| Mode M9 | |||
|---|---|---|---|
| Quadrant | BADHDUFLAG | Total packets | Discarded packets |
| A | 0 | 13 | 0 |
| B | 0 | 14 | 0 |
| C | 0 | 14 | 0 |
| D | 0 | 14 | 0 |
| Mode M0 | |||
|---|---|---|---|
| Quadrant | BADHDUFLAG | Total packets | Discarded packets |
| A | 0 | 14749 | 2 |
| B | 0 | 14960 | 2 |
| C | 0 | 14940 | 2 |
| D | 0 | 24403 | 2 |
| Quadrant | Total seconds | Saturated seconds | Saturation percentage |
|---|---|---|---|
| A | 6612 | 76 | 1.149425% |
| B | 6612 | 90 | 1.361162% |
| C | 6612 | 112 | 1.693890% |
| D | 6612 | 1001 | 15.139141% |
Noise dominated data is calculated using 1-second bins in cleaned event files. If a bin has >2000 counts, and if more than 50% of those come from <1% of pixels, then it is considered to be noise-dominated and hence unusable.
| Quadrant | # 1 sec bins | Bins with >0 counts | Bins with >2000 counts | High rate bins dominated by noise | Noise dominated (total time) | Noise dominated (detector-on time) | Marked lightcurve |
|---|---|---|---|---|---|---|---|
| A | 7877 | 6612 | 0 | 0 | 0.00% | 0.00% | 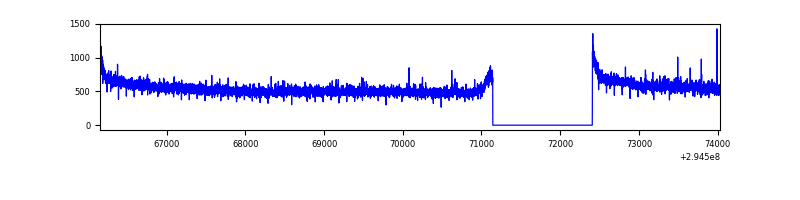 |
| B | 7877 | 6612 | 1 | 1 | 0.01% | 0.02% | 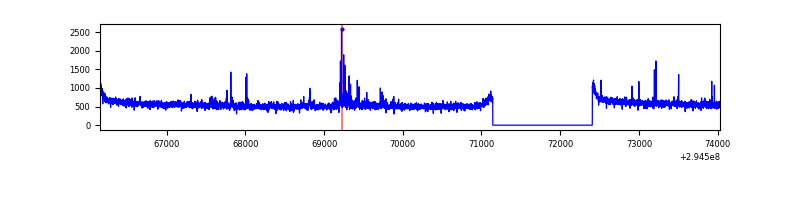 |
| C | 7877 | 6612 | 7 | 7 | 0.09% | 0.11% | 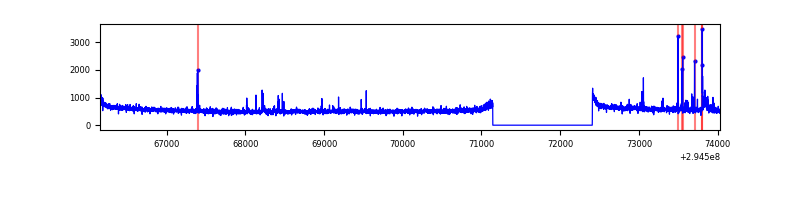 |
| D | 7877 | 6612 | 861 | 861 | 10.93% | 13.02% | 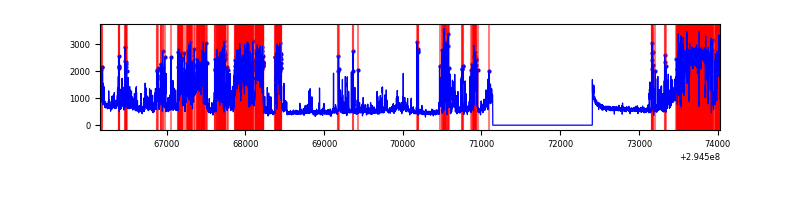 |
Top three noisy pixels from each quadrant. If the there are fewer than three noisy pixels in the level2.evt file, extra rows are filled as -1
| Pixel properties | Quadrant properties | ||||||
|---|---|---|---|---|---|---|---|
| Quadrant | DetID | PixID | Counts | Sigma | Mean | Median | Sigma |
| A | 3 | 1 | 25416 | 132.81 | 927 | 910 | 184.5 |
| A | 11 | 29 | 20992 | 108.83 | 927 | 910 | 184.5 |
| A | 13 | 254 | 10101 | 49.81 | 927 | 910 | 184.5 |
| B | 0 | 214 | 26636 | 152.93 | 906 | 887 | 168.4 |
| B | 0 | 198 | 23774 | 135.94 | 906 | 887 | 168.4 |
| B | 7 | 220 | 23582 | 134.8 | 906 | 887 | 168.4 |
| C | 14 | 238 | 138636 | 688.88 | 870 | 877 | 200.0 |
| C | 9 | 221 | 82554 | 408.44 | 870 | 877 | 200.0 |
| C | 0 | 207 | 66204 | 326.68 | 870 | 877 | 200.0 |
| D | 7 | 238 | 3336446 | 16163.01 | 852 | 829 | 206.4 |
| D | 1 | 52 | 51831 | 247.13 | 852 | 829 | 206.4 |
| D | 12 | 218 | 46899 | 223.24 | 852 | 829 | 206.4 |
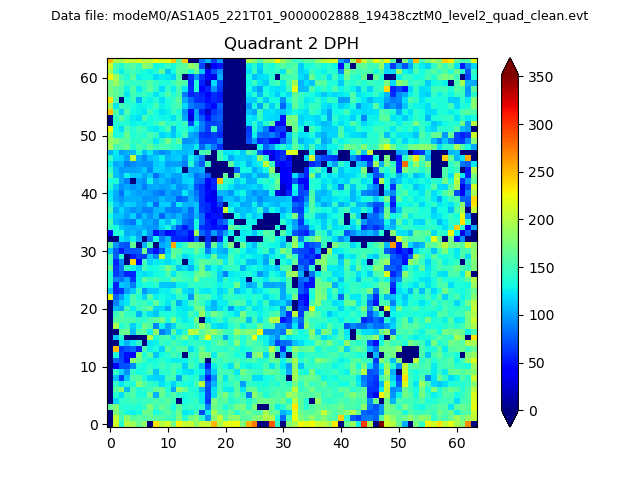
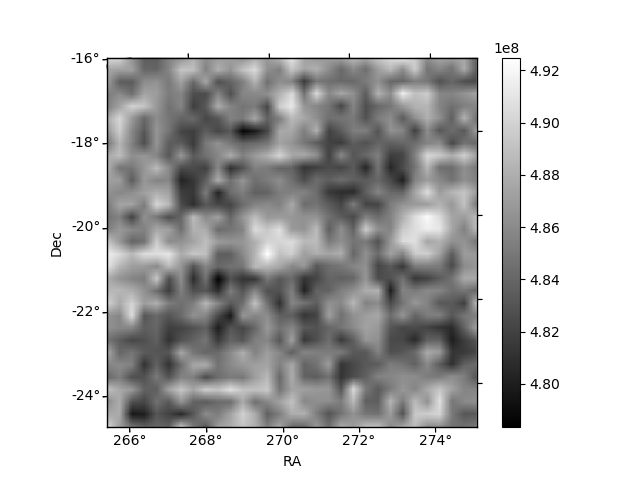
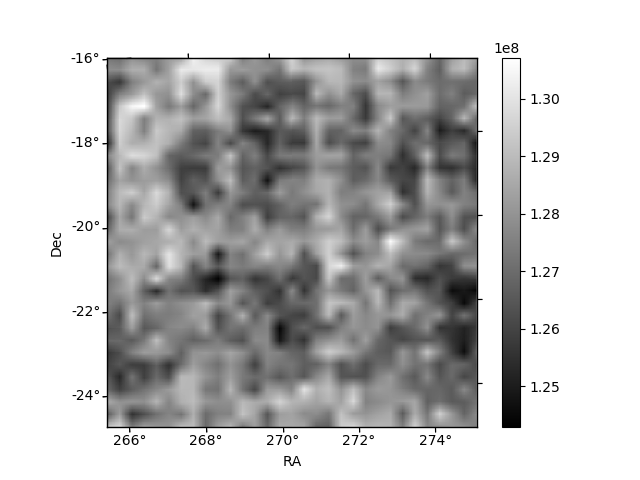
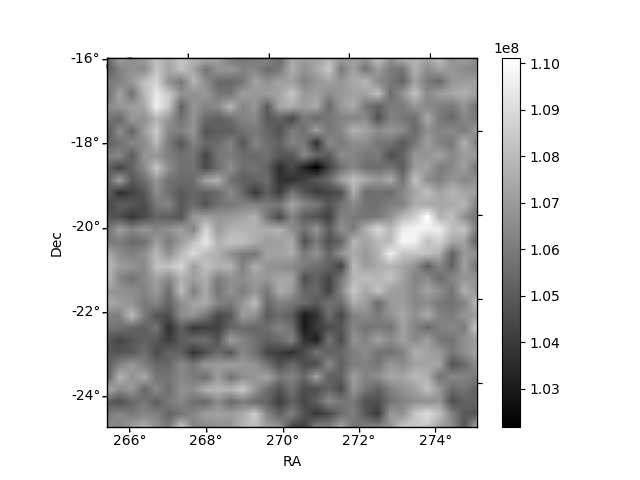
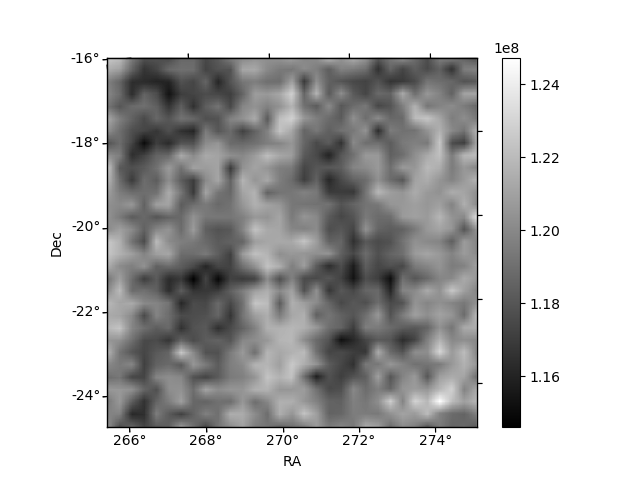
Histogram calculated using DETX and DETY for each event in the final _common_clean file
| Quadrant A | 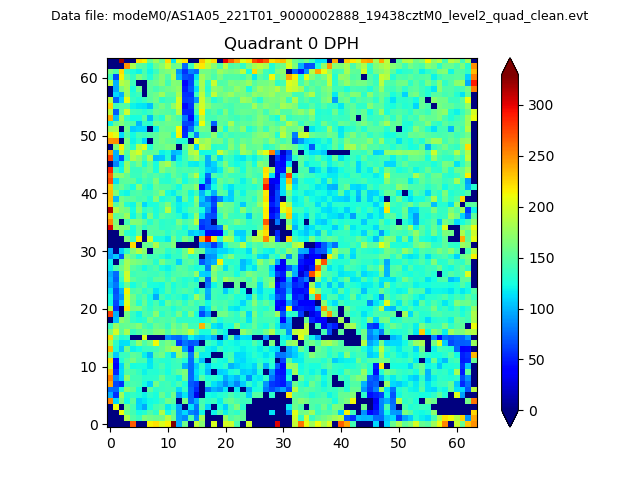 |
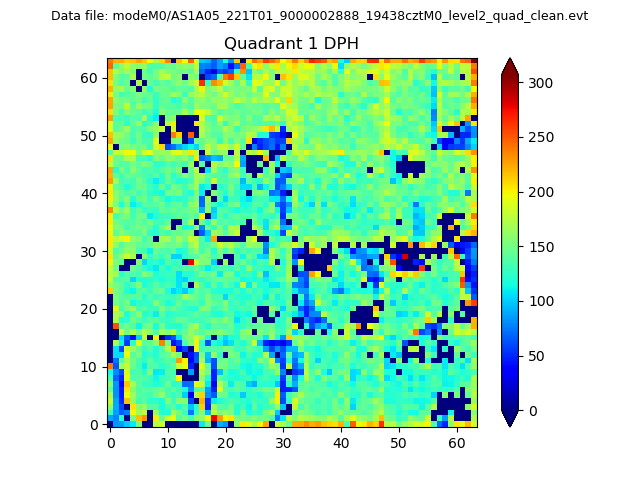 |
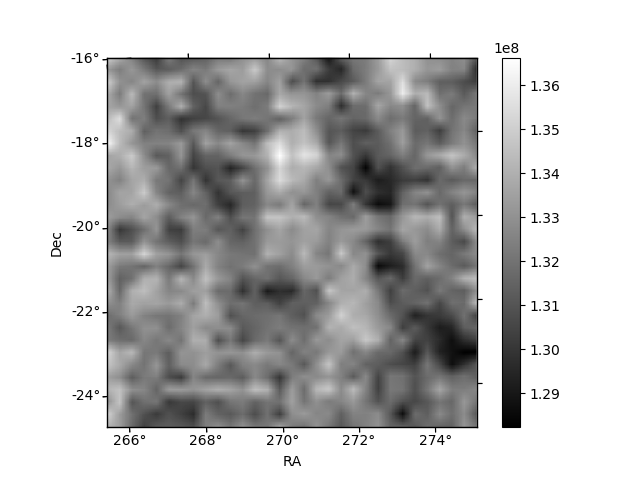
Quadrant B |
|---|---|---|---|
| Quadrant D | 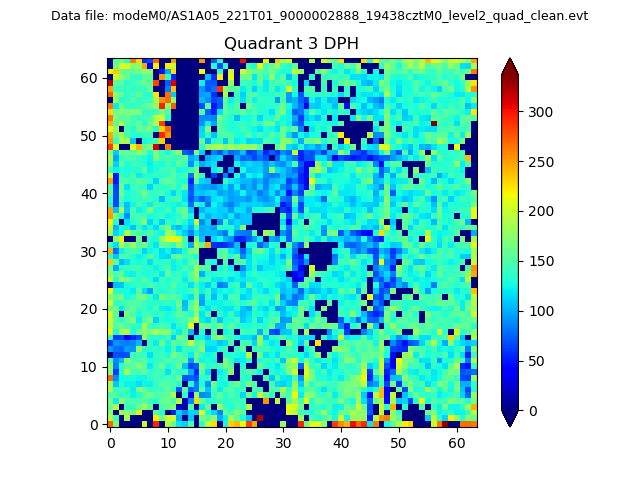 |
 |
Quadrant C |
| Plot type | Count rate plots | Images |
|---|---|---|
| Comparison with Poisson distribution Blue bars denote a histogram of data divided into 1 sec bins. Red curve is a Poisson curve with rate = median count rate of data. |
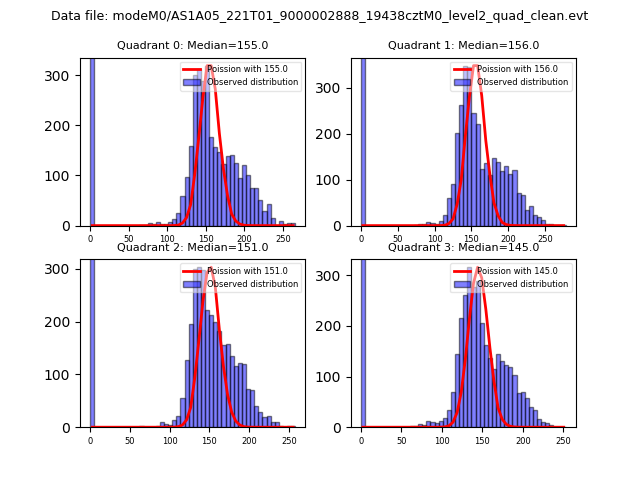 |
 |
| Quadrant-wise count rates Data is divided into 100 sec bins |
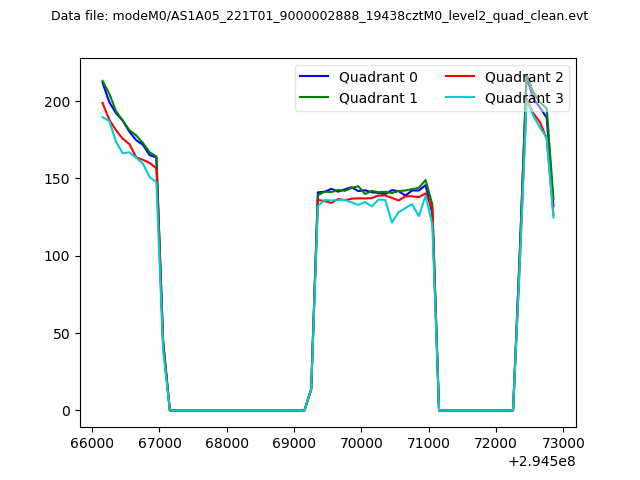 |
|
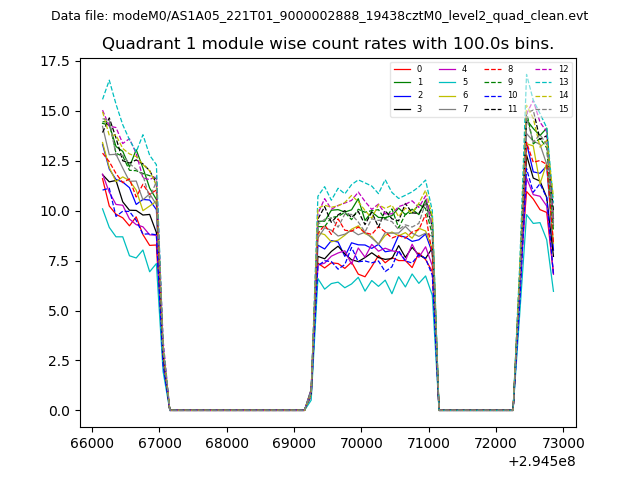
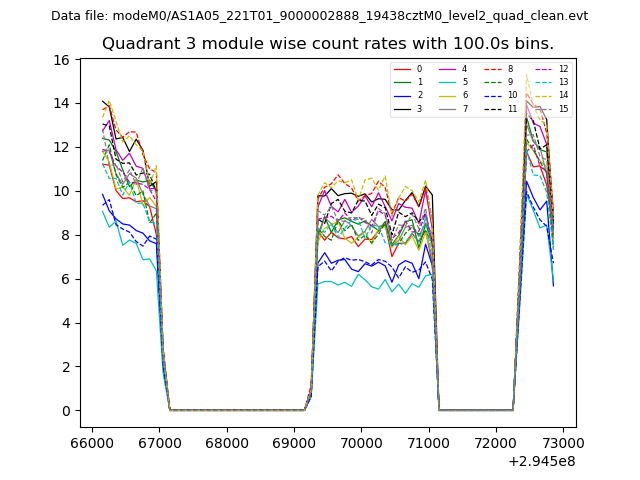
| Module-wise count rates for Quadrant A Data is divided into 100 sec bins |
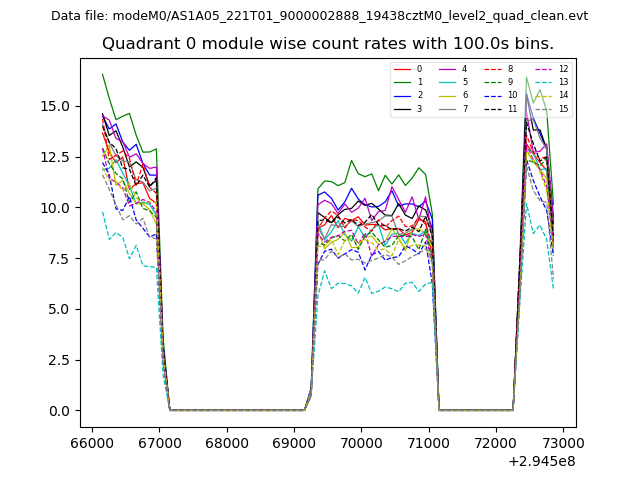 |
 |
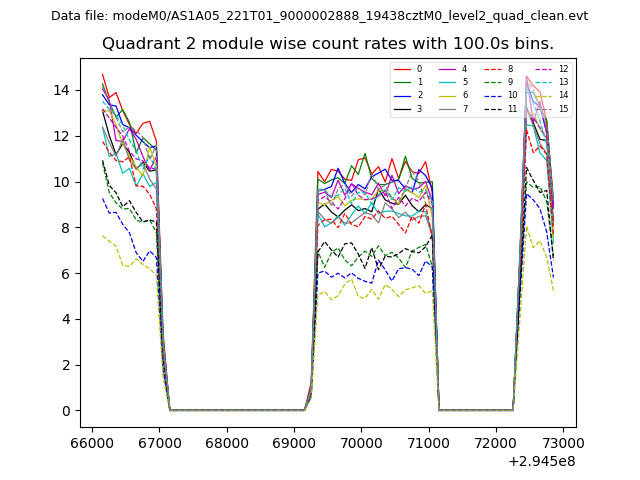
| Module-wise count rates for Quadrant B Data is divided into 100 sec bins |
 |
 |
| Module-wise count rates for Quadrant C Data is divided into 100 sec bins |
 |
 |
| Module-wise count rates for Quadrant D Data is divided into 100 sec bins |
 |
 |
| Parameter | Plot |
|---|---|
| CZT HV Monitor | 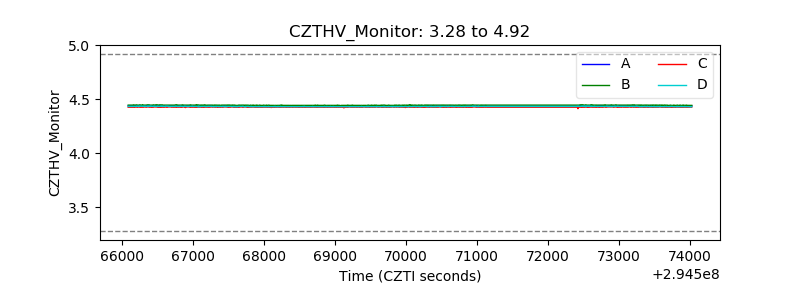 |
| D_VDD | 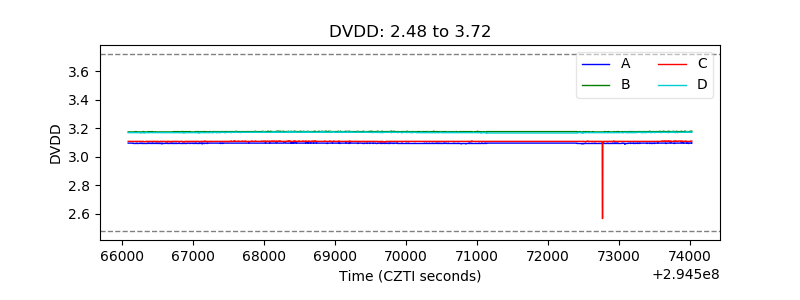 |
| Temperature 1 | 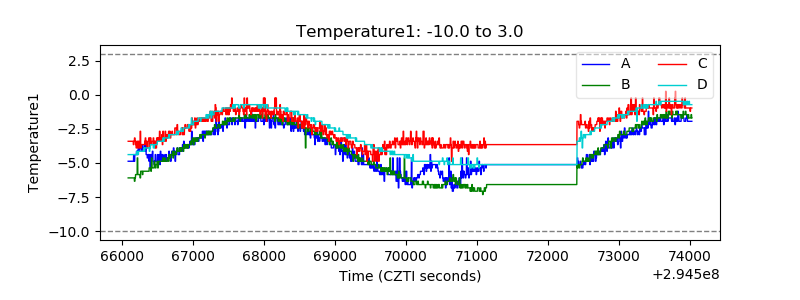 |
| Veto HV Monitor | 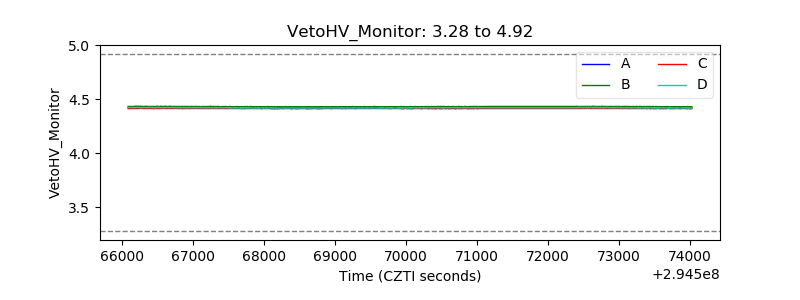 |
| Veto LLD | 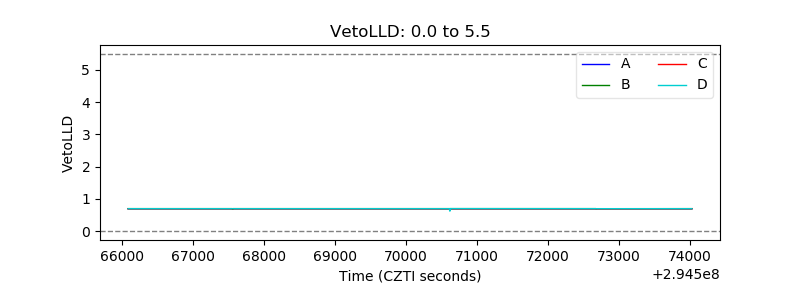 |
| Alpha Counter | 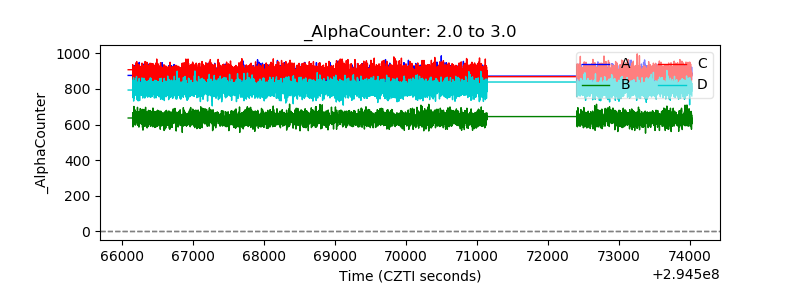 |
| _CPM_Rate | 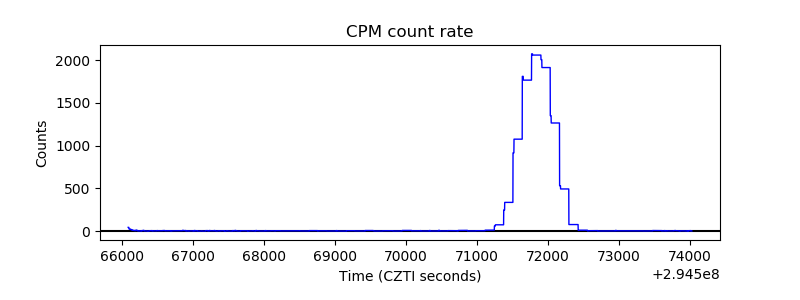 |
| CZT Counter | 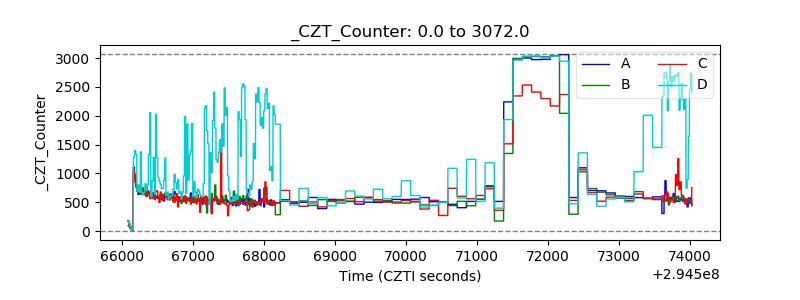 |
| +2.5 Volts monitor | 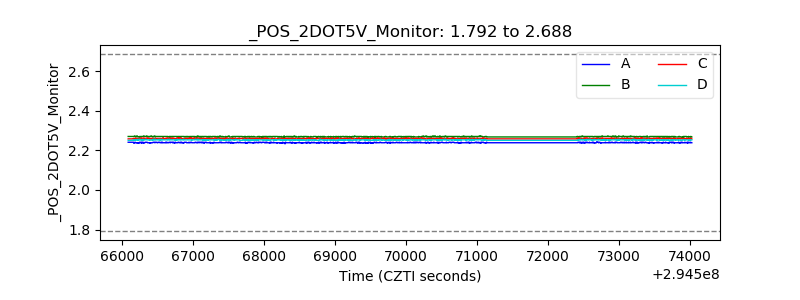 |
| +5 Volts monitor |  |
| _ROLL_ROT | 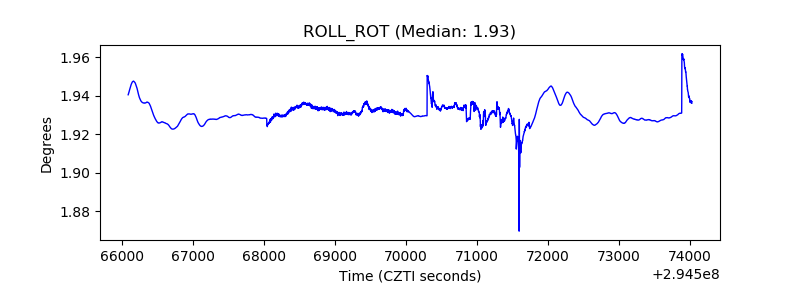 |
| _Roll_DEC | 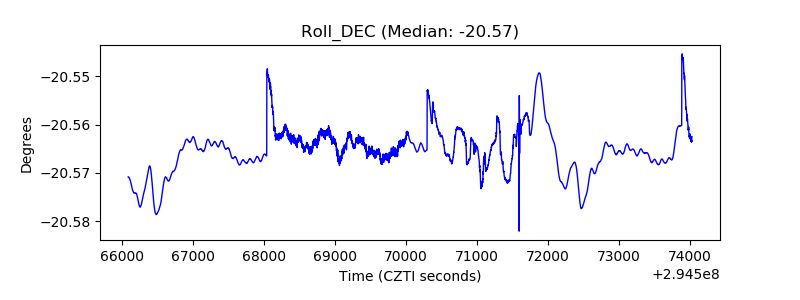 |
| _Roll_RA | 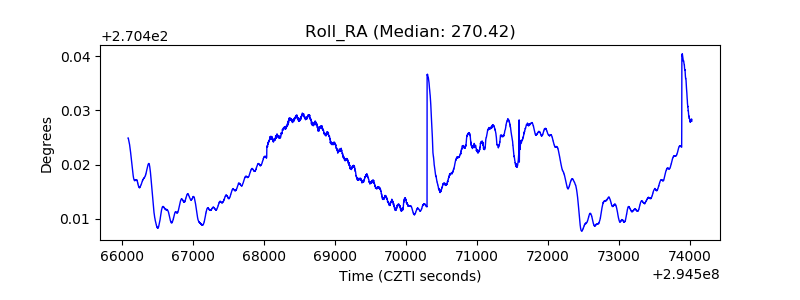 |
| Veto Counter | 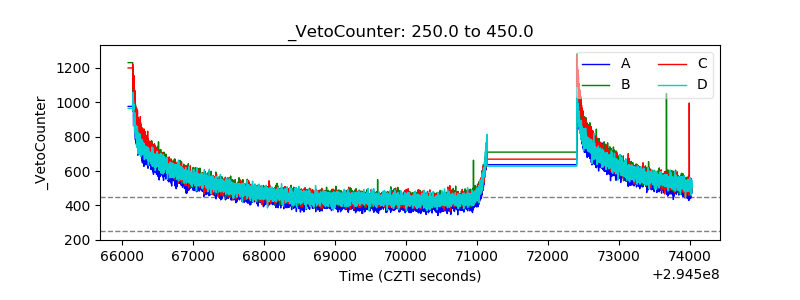 |