| Param | Original file | Final file |
|---|---|---|
| Filename | modeM0/AS1A05_221T01_9000002888_19439cztM0_level2.evt | modeM0/AS1A05_221T01_9000002888_19439cztM0_level2_quad_clean.evt |
| Size (bytes) | 598,403,520 | 61,649,280 |
| Size | 570.7 MB | 58.8 MB |
| Events in quadrant A | 3,382,006 | 377,224 |
| Events in quadrant B | 3,492,258 | 378,336 |
| Events in quadrant C | 3,435,514 | 361,612 |
| Events in quadrant D | 7,395,189 | 318,353 |
| Mode SS | |||
|---|---|---|---|
| Quadrant | BADHDUFLAG | Total packets | Discarded packets |
| A | 0 | 126 | 0 |
| B | 0 | 126 | 0 |
| C | 0 | 126 | 0 |
| D | 0 | 126 | 0 |
| Mode M9 | |||
|---|---|---|---|
| Quadrant | BADHDUFLAG | Total packets | Discarded packets |
| A | 0 | 13 | 0 |
| B | 0 | 13 | 0 |
| C | 0 | 13 | 0 |
| D | 0 | 13 | 0 |
| Mode M0 | |||
|---|---|---|---|
| Quadrant | BADHDUFLAG | Total packets | Discarded packets |
| A | 0 | 13723 | 1 |
| B | 0 | 14146 | 1 |
| C | 0 | 13846 | 1 |
| D | 0 | 26103 | 1 |
| Quadrant | Total seconds | Saturated seconds | Saturation percentage |
|---|---|---|---|
| A | 6166 | 78 | 1.265002% |
| B | 6167 | 97 | 1.572888% |
| C | 6167 | 107 | 1.735041% |
| D | 6167 | 1535 | 24.890546% |
Noise dominated data is calculated using 1-second bins in cleaned event files. If a bin has >2000 counts, and if more than 50% of those come from <1% of pixels, then it is considered to be noise-dominated and hence unusable.
| Quadrant | # 1 sec bins | Bins with >0 counts | Bins with >2000 counts | High rate bins dominated by noise | Noise dominated (total time) | Noise dominated (detector-on time) | Marked lightcurve |
|---|---|---|---|---|---|---|---|
| A | 7491 | 6166 | 1 | 1 | 0.01% | 0.02% | 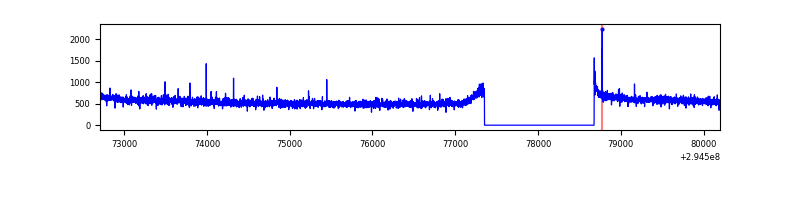 |
| B | 7492 | 6167 | 6 | 6 | 0.08% | 0.10% | 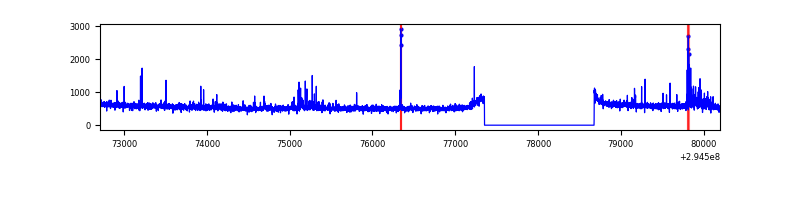 |
| C | 7492 | 6167 | 6 | 6 | 0.08% | 0.10% | 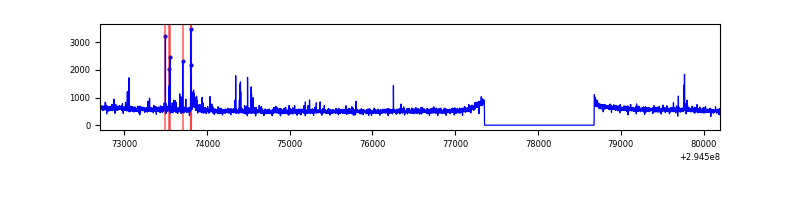 |
| D | 7492 | 6167 | 1413 | 1413 | 18.86% | 22.91% | 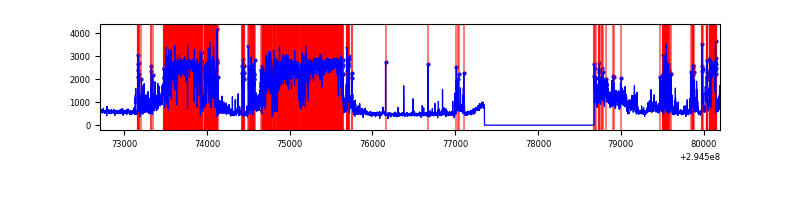 |
Top three noisy pixels from each quadrant. If the there are fewer than three noisy pixels in the level2.evt file, extra rows are filled as -1
| Pixel properties | Quadrant properties | ||||||
|---|---|---|---|---|---|---|---|
| Quadrant | DetID | PixID | Counts | Sigma | Mean | Median | Sigma |
| A | 3 | 1 | 33971 | 194.68 | 862 | 849 | 170.1 |
| A | 11 | 29 | 21784 | 123.05 | 862 | 849 | 170.1 |
| A | 13 | 254 | 9767 | 52.42 | 862 | 849 | 170.1 |
| B | 7 | 220 | 53226 | 329.39 | 848 | 829 | 159.1 |
| B | 3 | 64 | 25134 | 152.79 | 848 | 829 | 159.1 |
| B | 4 | 216 | 21030 | 126.99 | 848 | 829 | 159.1 |
| C | 14 | 238 | 129960 | 695.6 | 810 | 817 | 185.7 |
| C | 9 | 221 | 73469 | 391.33 | 810 | 817 | 185.7 |
| C | 0 | 207 | 68399 | 364.02 | 810 | 817 | 185.7 |
| D | 7 | 238 | 4463301 | 24698.81 | 753 | 736 | 180.7 |
| D | 12 | 218 | 32566 | 176.17 | 753 | 736 | 180.7 |
| D | 2 | 234 | 25141 | 135.07 | 753 | 736 | 180.7 |
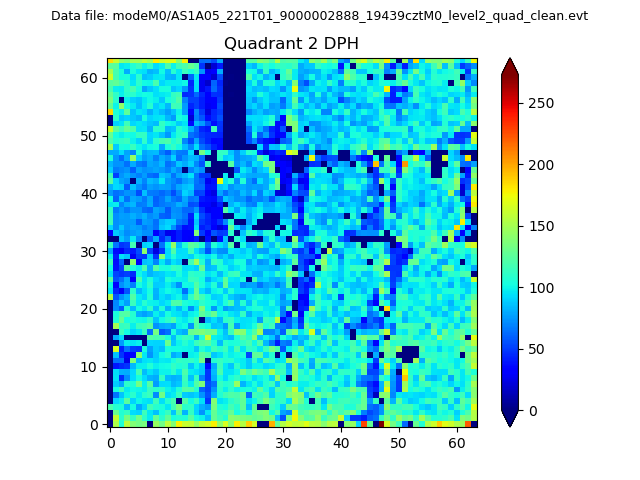
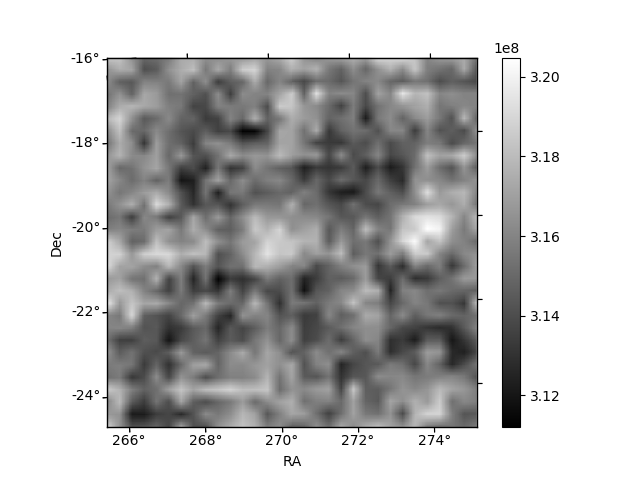
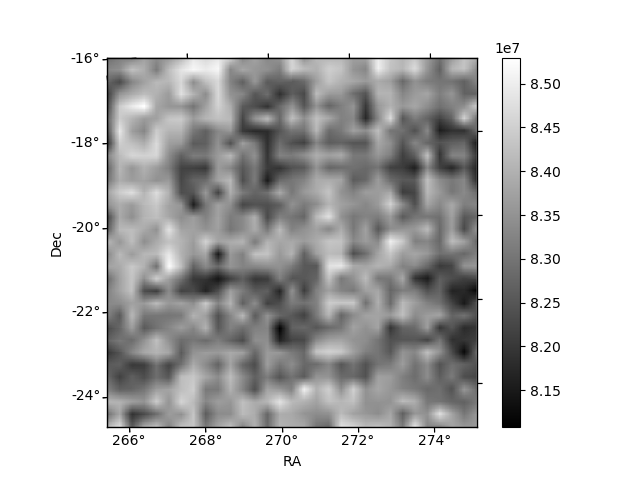
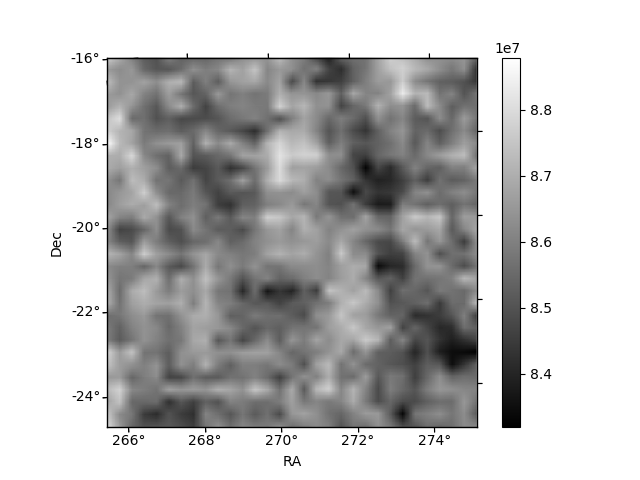
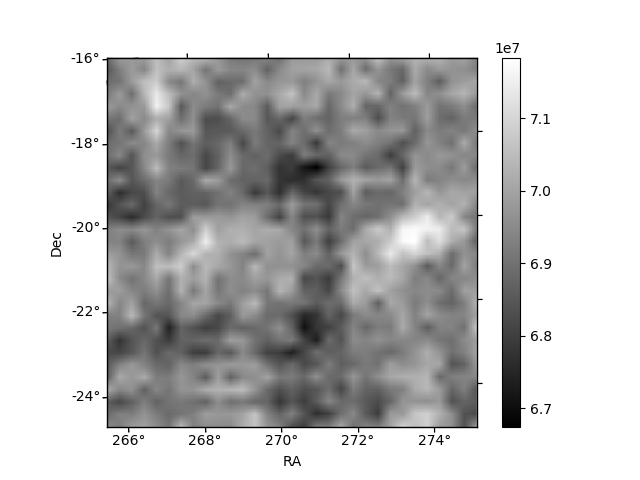
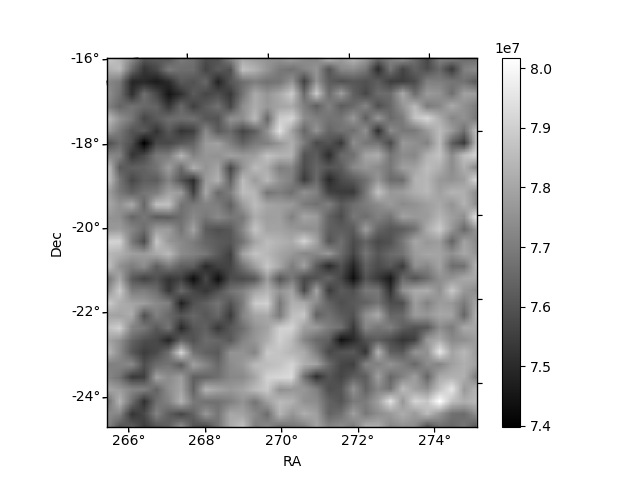
Histogram calculated using DETX and DETY for each event in the final _common_clean file
| Quadrant A | 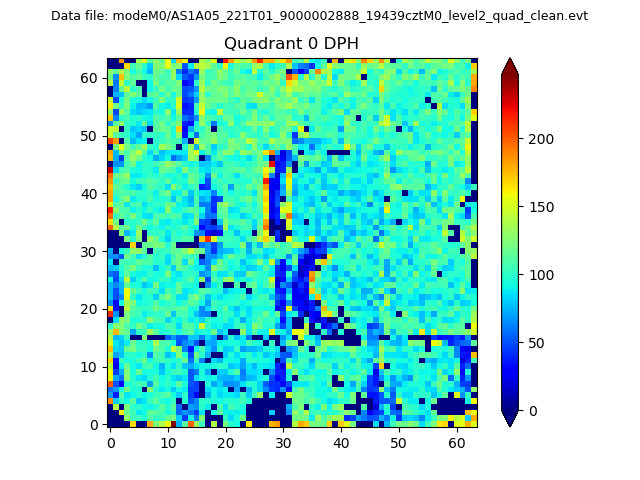 |
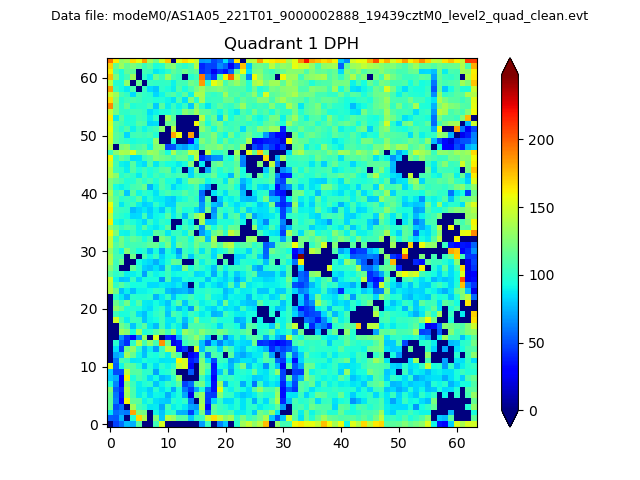 |
Quadrant B |
|---|---|---|---|
| Quadrant D | 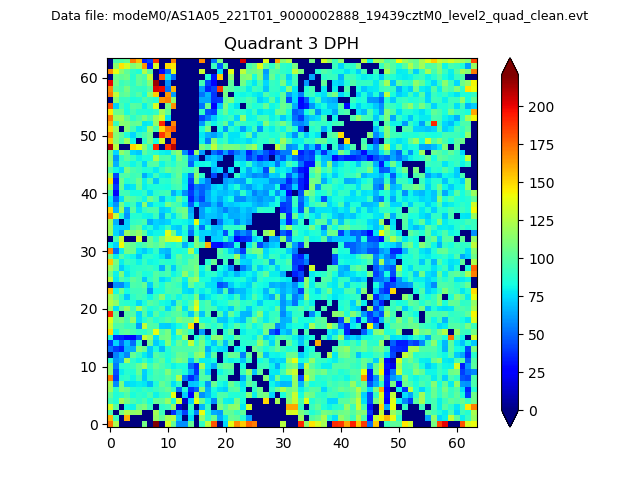 |
 |
Quadrant C |
| Plot type | Count rate plots | Images |
|---|---|---|
| Comparison with Poisson distribution Blue bars denote a histogram of data divided into 1 sec bins. Red curve is a Poisson curve with rate = median count rate of data. |
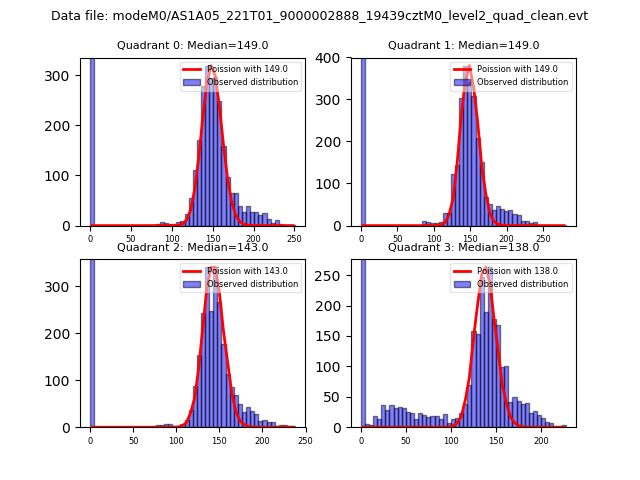 |
 |
| Quadrant-wise count rates Data is divided into 100 sec bins |
 |
|
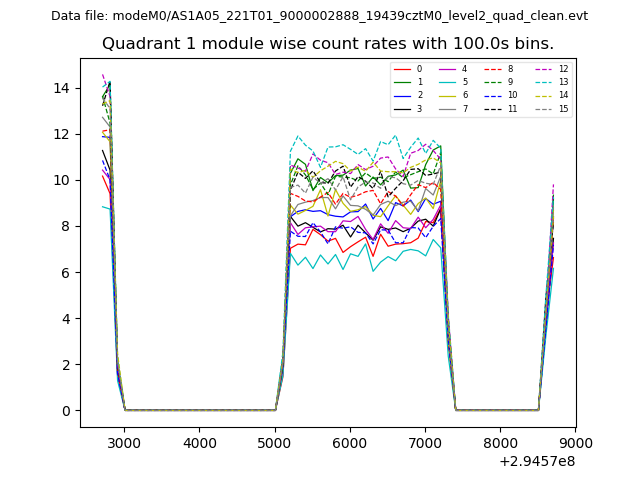
| Module-wise count rates for Quadrant A Data is divided into 100 sec bins |
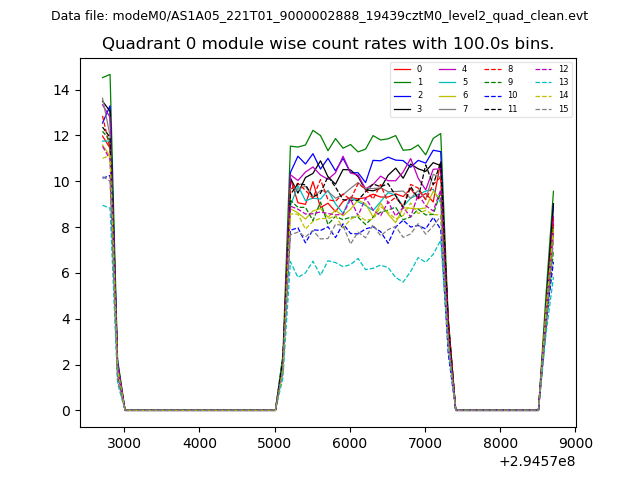 |
 |
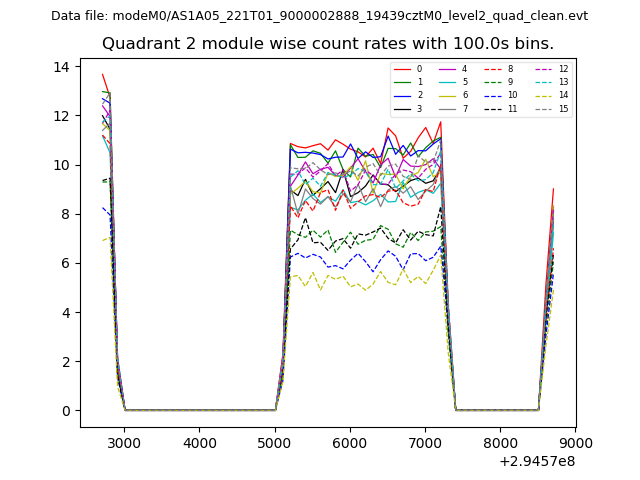
| Module-wise count rates for Quadrant B Data is divided into 100 sec bins |
 |
 |
| Module-wise count rates for Quadrant C Data is divided into 100 sec bins |
 |
 |
| Module-wise count rates for Quadrant D Data is divided into 100 sec bins |
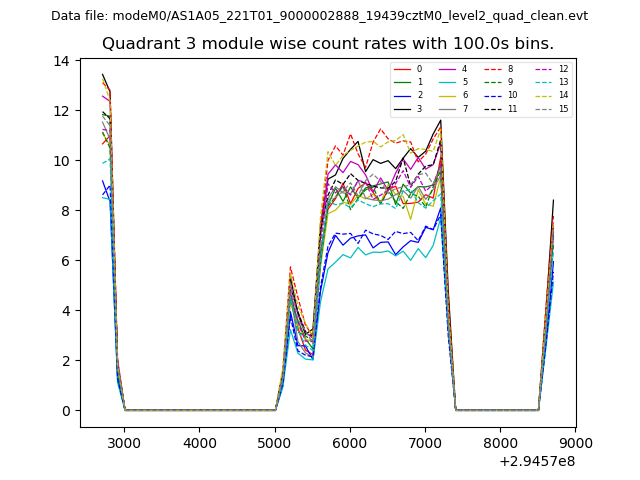 |
 |
| Parameter | Plot |
|---|---|
| CZT HV Monitor | 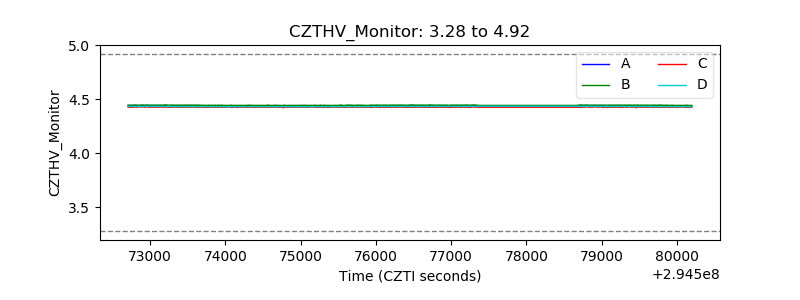 |
| D_VDD | 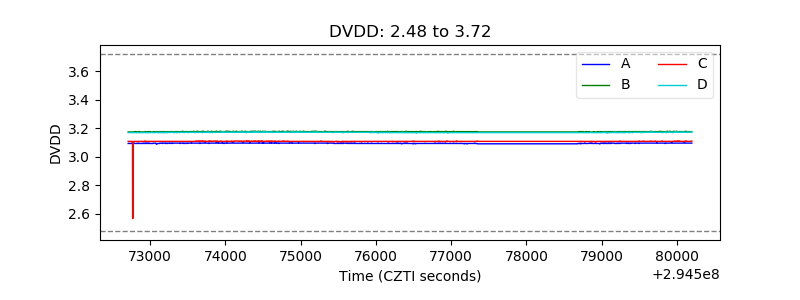 |
| Temperature 1 | 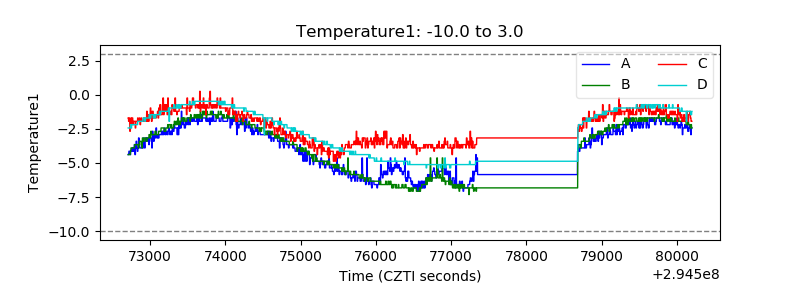 |
| Veto HV Monitor | 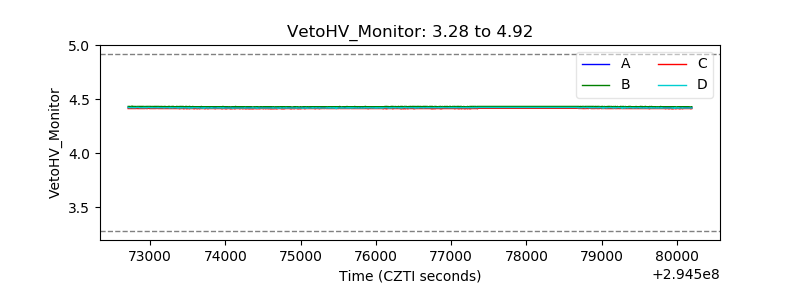 |
| Veto LLD | 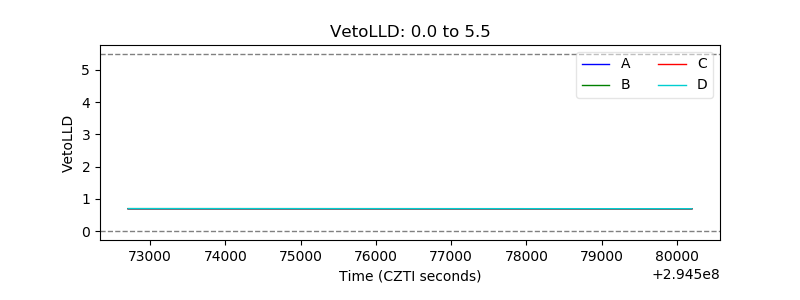 |
| Alpha Counter | 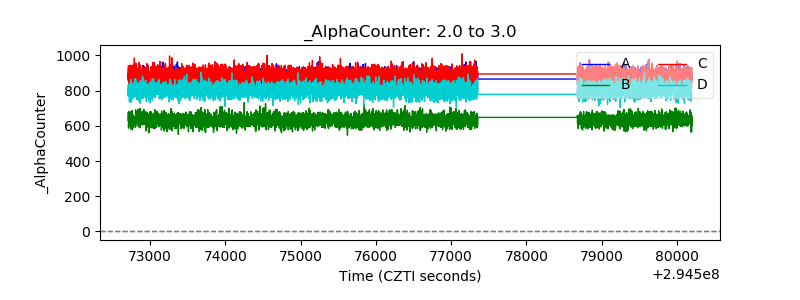 |
| _CPM_Rate | 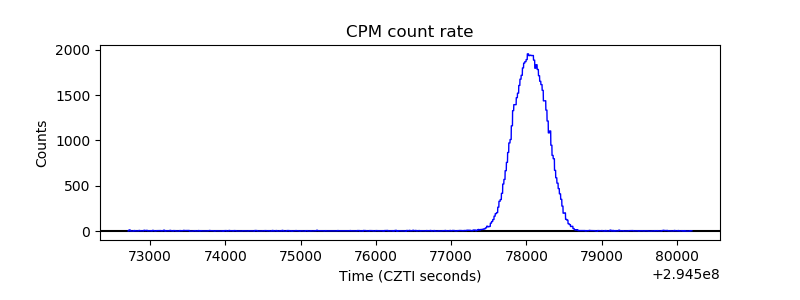 |
| CZT Counter | 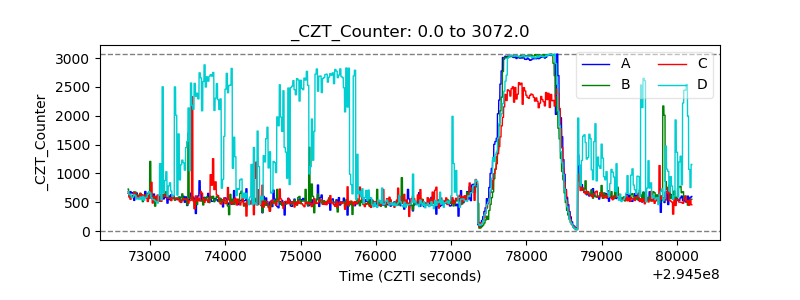 |
| +2.5 Volts monitor |  |
| +5 Volts monitor |  |
| _ROLL_ROT | 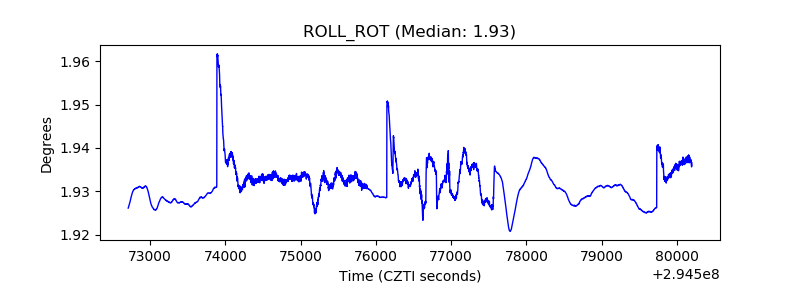 |
| _Roll_DEC | 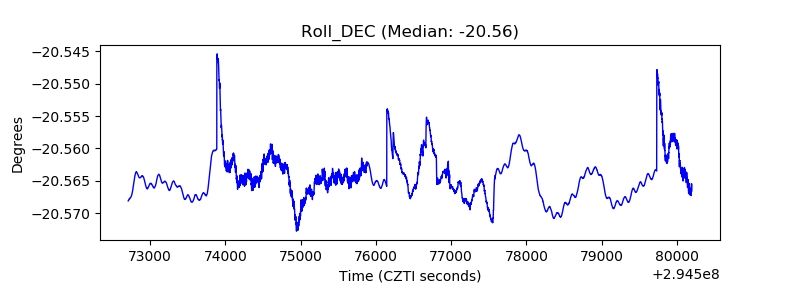 |
| _Roll_RA | 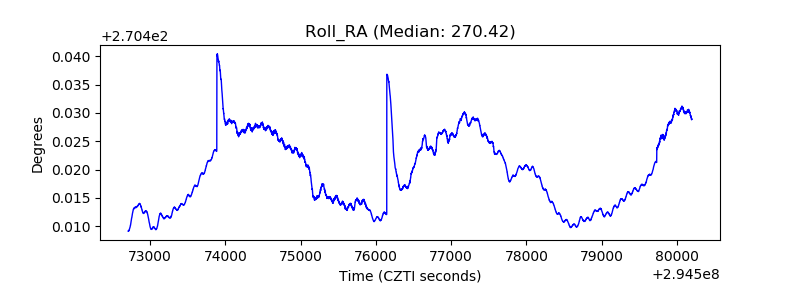 |
| Veto Counter | 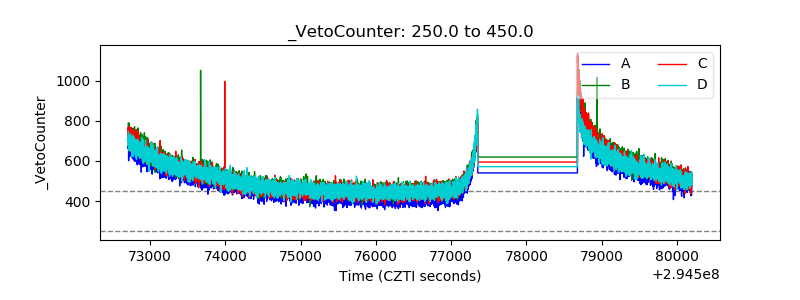 |