| Param | Original file | Final file |
|---|---|---|
| Filename | modeM0/AS1A05_221T01_9000002888_19441cztM0_level2.evt | modeM0/AS1A05_221T01_9000002888_19441cztM0_level2_quad_clean.evt |
| Size (bytes) | 544,314,240 | 72,495,360 |
| Size | 519.1 MB | 69.1 MB |
| Events in quadrant A | 3,601,408 | 443,219 |
| Events in quadrant B | 3,417,420 | 452,245 |
| Events in quadrant C | 3,271,335 | 434,840 |
| Events in quadrant D | 5,767,534 | 425,531 |
| Mode SS | |||
|---|---|---|---|
| Quadrant | BADHDUFLAG | Total packets | Discarded packets |
| A | 0 | 128 | 0 |
| B | 0 | 128 | 0 |
| C | 0 | 128 | 0 |
| D | 0 | 128 | 0 |
| Mode M9 | |||
|---|---|---|---|
| Quadrant | BADHDUFLAG | Total packets | Discarded packets |
| A | 0 | 11 | 0 |
| B | 0 | 11 | 0 |
| C | 0 | 11 | 0 |
| D | 0 | 11 | 0 |
| Mode M0 | |||
|---|---|---|---|
| Quadrant | BADHDUFLAG | Total packets | Discarded packets |
| A | 0 | 14484 | 1 |
| B | 0 | 13996 | 1 |
| C | 0 | 13370 | 1 |
| D | 0 | 21364 | 1 |
| Quadrant | Total seconds | Saturated seconds | Saturation percentage |
|---|---|---|---|
| A | 6292 | 191 | 3.035601% |
| B | 6293 | 151 | 2.399491% |
| C | 6293 | 136 | 2.161131% |
| D | 6293 | 788 | 12.521850% |
Noise dominated data is calculated using 1-second bins in cleaned event files. If a bin has >2000 counts, and if more than 50% of those come from <1% of pixels, then it is considered to be noise-dominated and hence unusable.
| Quadrant | # 1 sec bins | Bins with >0 counts | Bins with >2000 counts | High rate bins dominated by noise | Noise dominated (total time) | Noise dominated (detector-on time) | Marked lightcurve |
|---|---|---|---|---|---|---|---|
| A | 7382 | 6292 | 54 | 54 | 0.73% | 0.86% | 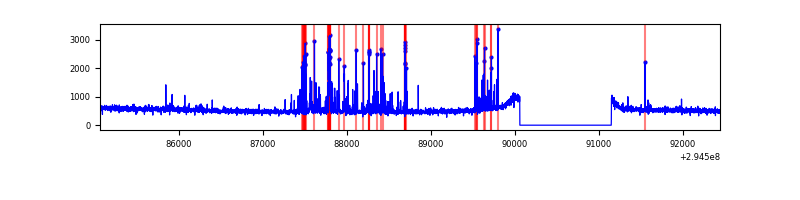 |
| B | 7383 | 6293 | 6 | 6 | 0.08% | 0.10% | 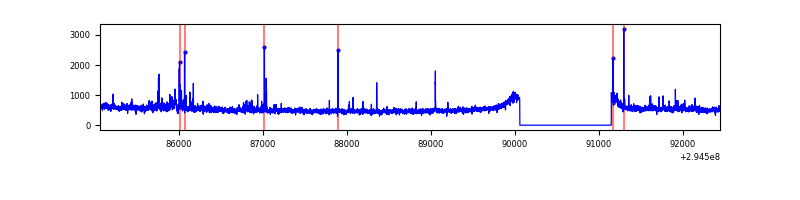 |
| C | 7383 | 6293 | 6 | 6 | 0.08% | 0.10% | 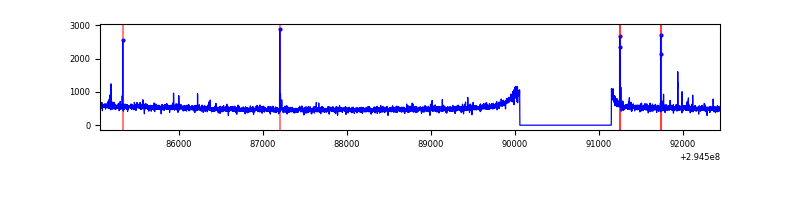 |
| D | 7383 | 6293 | 573 | 573 | 7.76% | 9.11% | 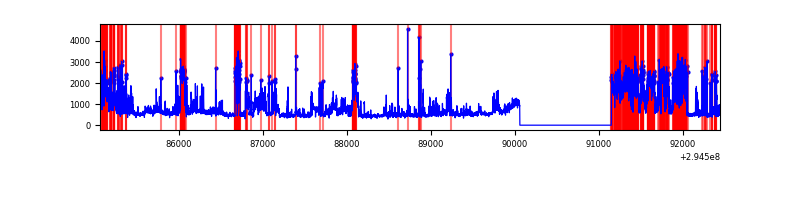 |
Top three noisy pixels from each quadrant. If the there are fewer than three noisy pixels in the level2.evt file, extra rows are filled as -1
| Pixel properties | Quadrant properties | ||||||
|---|---|---|---|---|---|---|---|
| Quadrant | DetID | PixID | Counts | Sigma | Mean | Median | Sigma |
| A | 5 | 16 | 339553 | 2027.97 | 834 | 818 | 167.0 |
| A | 11 | 29 | 18895 | 108.23 | 834 | 818 | 167.0 |
| A | 12 | 96 | 13243 | 74.39 | 834 | 818 | 167.0 |
| B | 0 | 190 | 50226 | 311.85 | 828 | 810 | 158.5 |
| B | 7 | 220 | 28759 | 176.38 | 828 | 810 | 158.5 |
| B | 4 | 216 | 26864 | 164.42 | 828 | 810 | 158.5 |
| C | 14 | 238 | 125423 | 667.13 | 796 | 803 | 186.8 |
| C | 0 | 207 | 31572 | 164.72 | 796 | 803 | 186.8 |
| C | 9 | 54 | 8705 | 42.3 | 796 | 803 | 186.8 |
| D | 7 | 238 | 2715759 | 14330.86 | 780 | 757 | 189.5 |
| D | 12 | 218 | 41193 | 213.44 | 780 | 757 | 189.5 |
| D | 2 | 234 | 30048 | 154.61 | 780 | 757 | 189.5 |
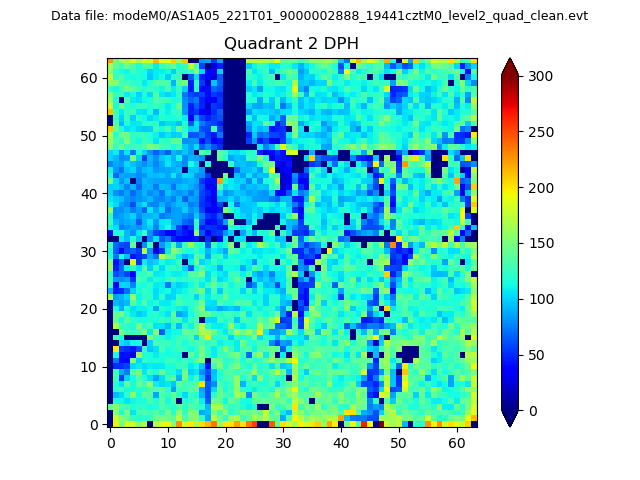
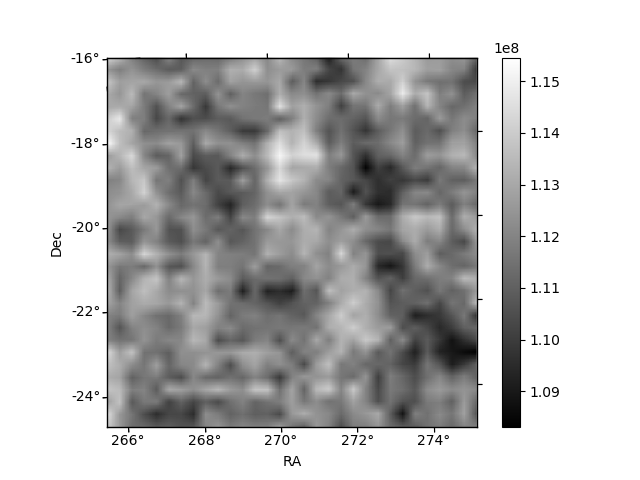
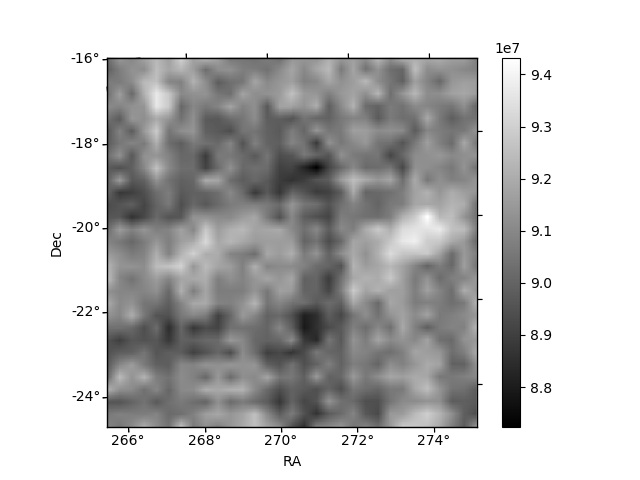
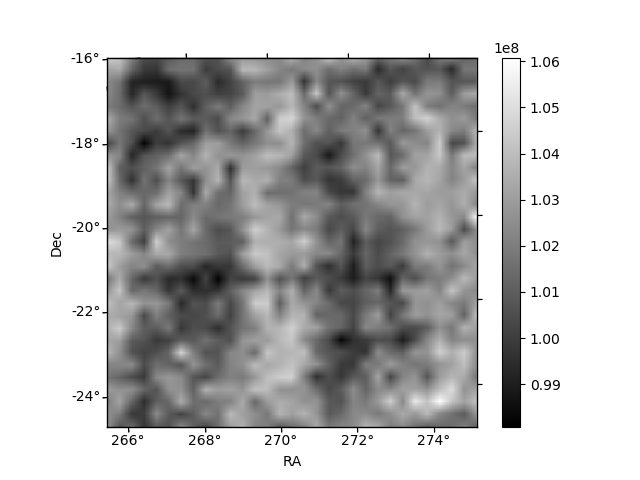
Histogram calculated using DETX and DETY for each event in the final _common_clean file
| Quadrant A | 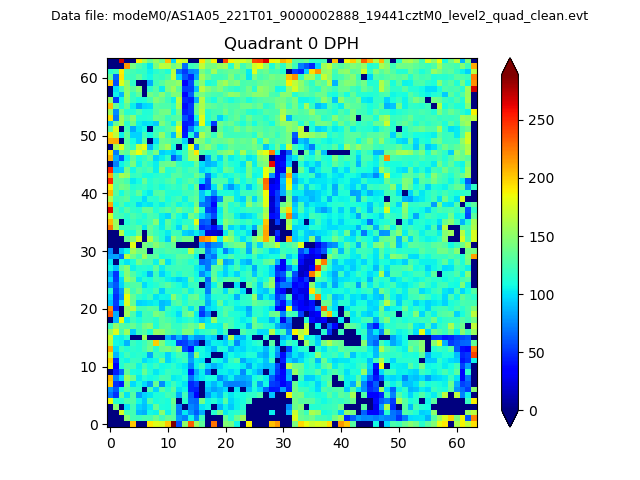 |
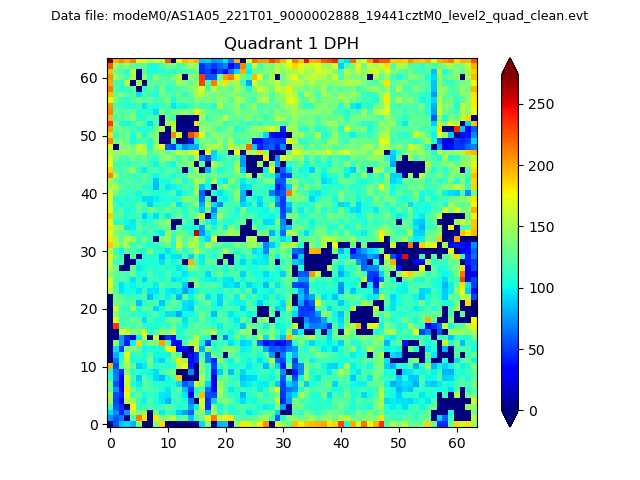 |
Quadrant B |
|---|---|---|---|
| Quadrant D | 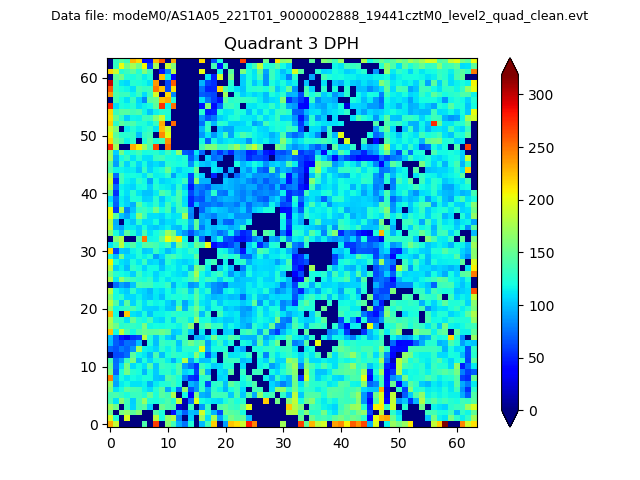 |
 |
Quadrant C |
| Plot type | Count rate plots | Images |
|---|---|---|
| Comparison with Poisson distribution Blue bars denote a histogram of data divided into 1 sec bins. Red curve is a Poisson curve with rate = median count rate of data. |
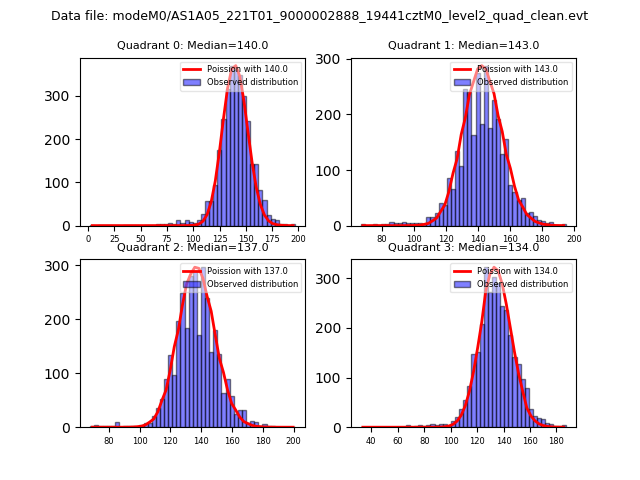 |
 |
| Quadrant-wise count rates Data is divided into 100 sec bins |
 |
|
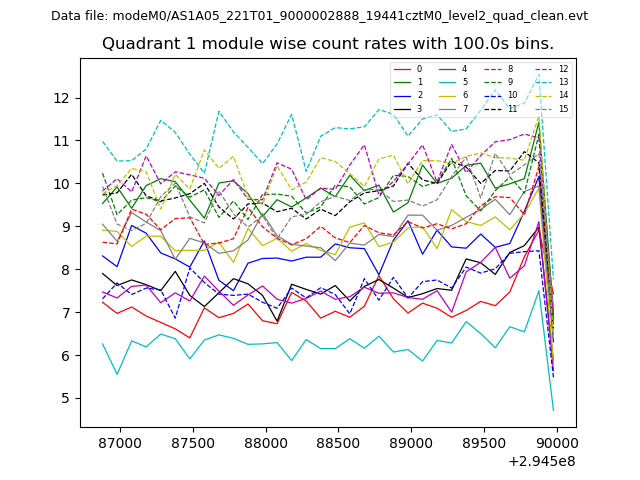
| Module-wise count rates for Quadrant A Data is divided into 100 sec bins |
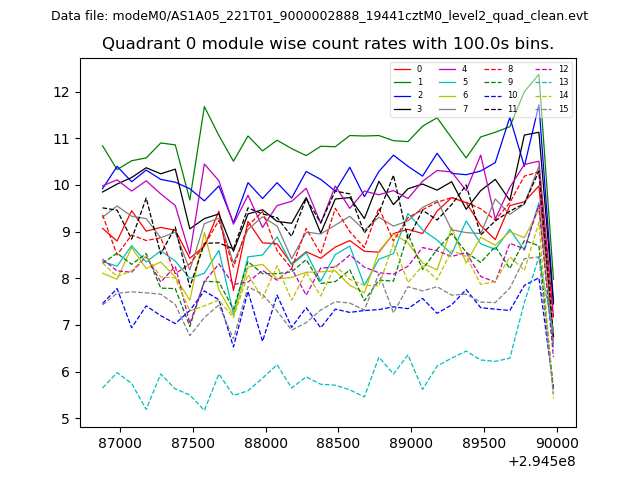 |
 |
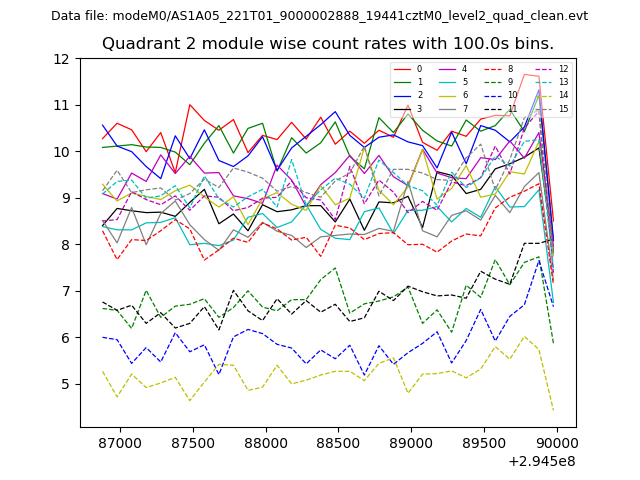
| Module-wise count rates for Quadrant B Data is divided into 100 sec bins |
 |
 |
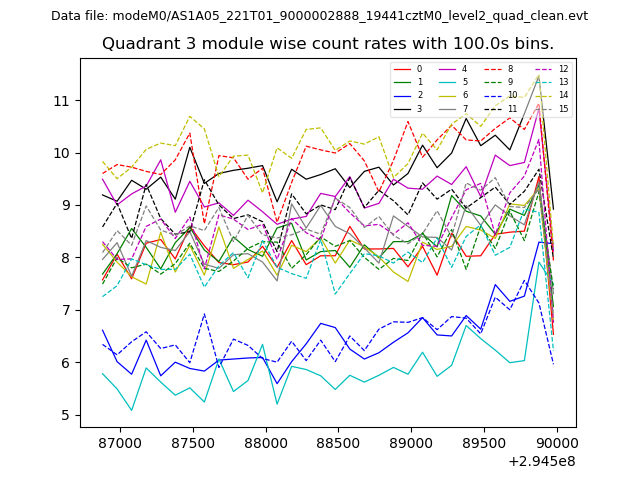
| Module-wise count rates for Quadrant C Data is divided into 100 sec bins |
 |
 |
| Module-wise count rates for Quadrant D Data is divided into 100 sec bins |
 |
 |
| Parameter | Plot |
|---|---|
| CZT HV Monitor | 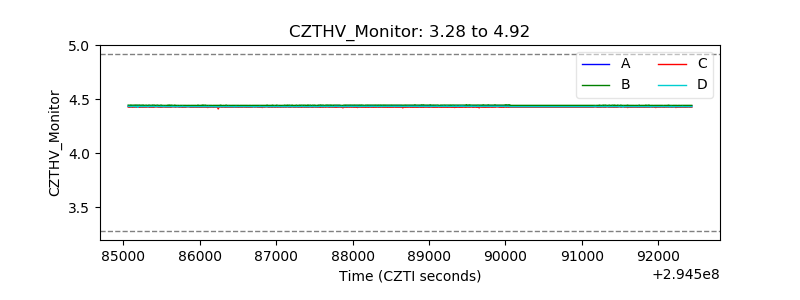 |
| D_VDD | 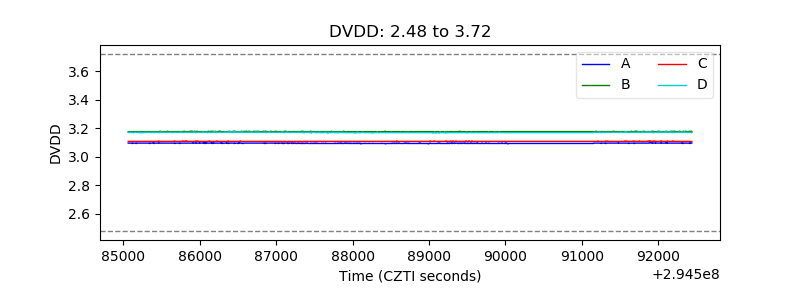 |
| Temperature 1 | 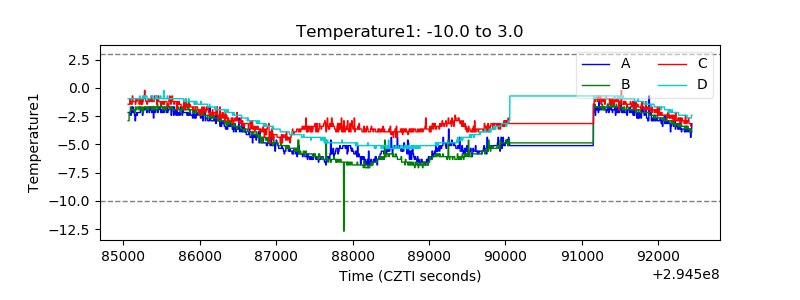 |
| Veto HV Monitor | 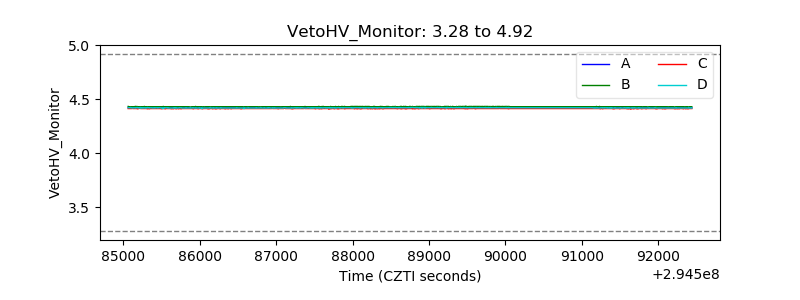 |
| Veto LLD | 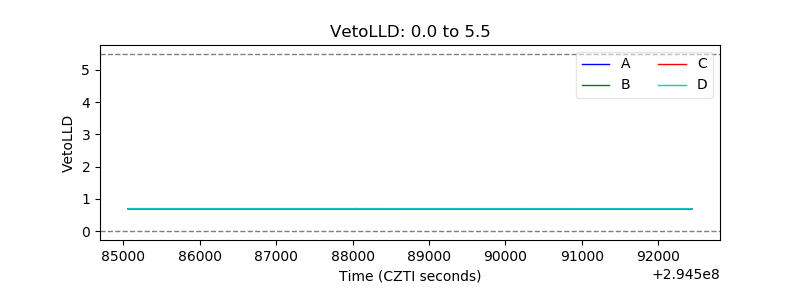 |
| Alpha Counter | 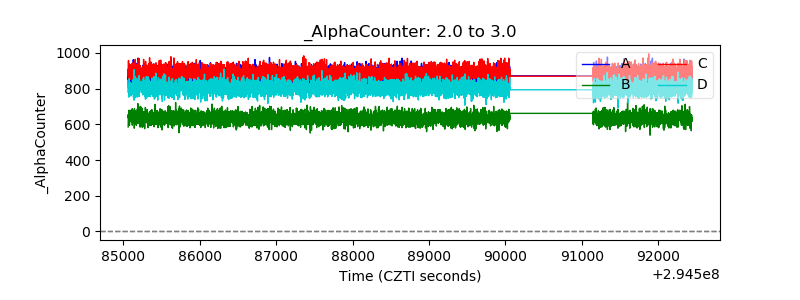 |
| _CPM_Rate | 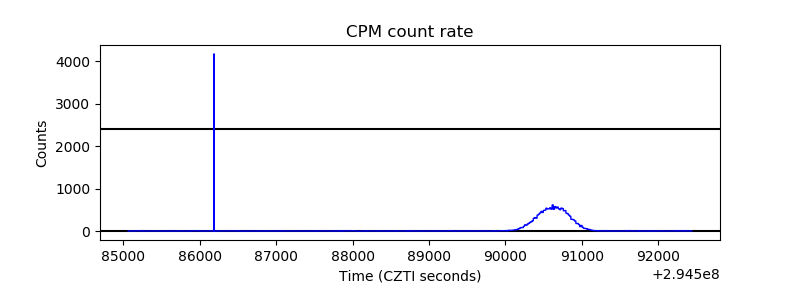 |
| CZT Counter | 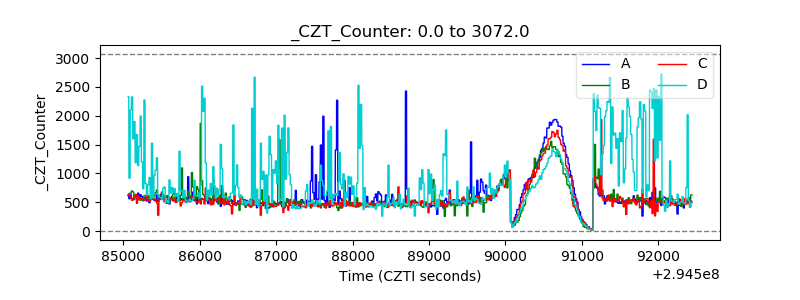 |
| +2.5 Volts monitor |  |
| +5 Volts monitor |  |
| _ROLL_ROT | 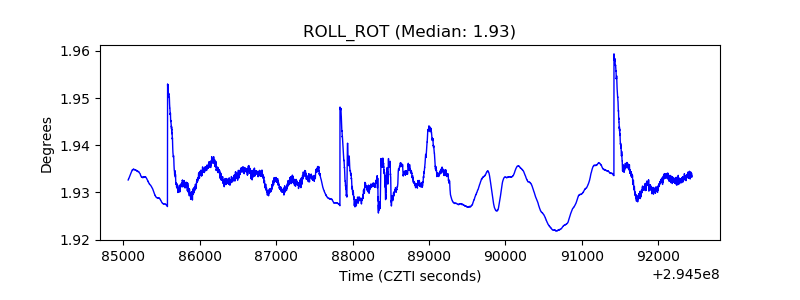 |
| _Roll_DEC | 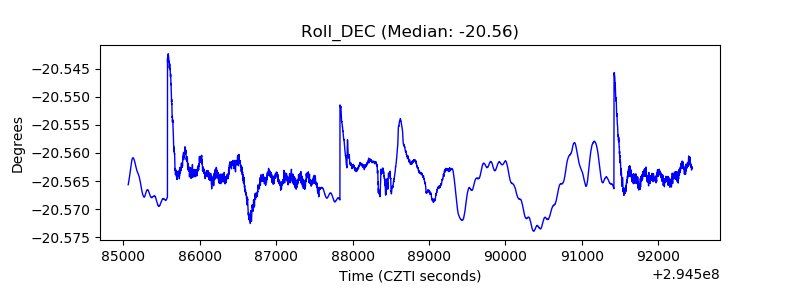 |
| _Roll_RA | 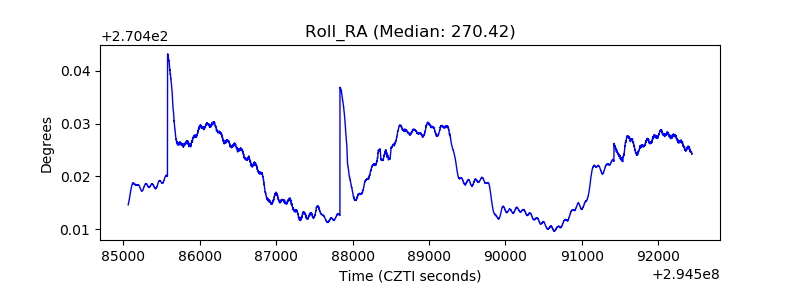 |
| Veto Counter | 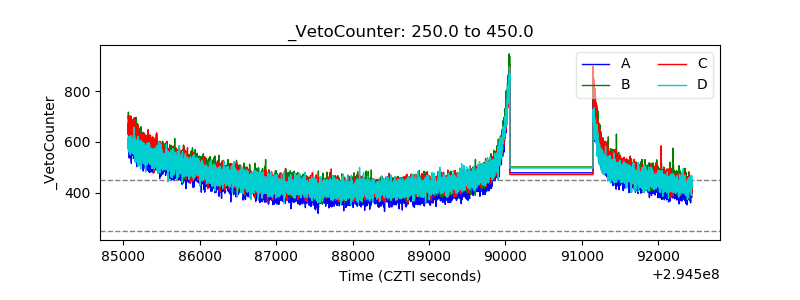 |