| Param | Original file | Final file |
|---|---|---|
| Filename | modeM0/AS1A05_221T01_9000002888_19443cztM0_level2.evt | modeM0/AS1A05_221T01_9000002888_19443cztM0_level2_quad_clean.evt |
| Size (bytes) | 588,182,400 | 87,033,600 |
| Size | 560.9 MB | 83.0 MB |
| Events in quadrant A | 3,558,273 | 541,770 |
| Events in quadrant B | 3,638,082 | 546,740 |
| Events in quadrant C | 3,529,819 | 527,787 |
| Events in quadrant D | 6,592,945 | 512,030 |
| Mode SS | |||
|---|---|---|---|
| Quadrant | BADHDUFLAG | Total packets | Discarded packets |
| A | 0 | 148 | 0 |
| B | 0 | 148 | 0 |
| C | 0 | 148 | 0 |
| D | 0 | 148 | 0 |
| Mode M9 | |||
|---|---|---|---|
| Quadrant | BADHDUFLAG | Total packets | Discarded packets |
| A | 0 | 8 | 0 |
| B | 0 | 9 | 0 |
| C | 0 | 9 | 0 |
| D | 0 | 9 | 0 |
| Mode M0 | |||
|---|---|---|---|
| Quadrant | BADHDUFLAG | Total packets | Discarded packets |
| A | 0 | 15251 | 2 |
| B | 0 | 15440 | 2 |
| C | 0 | 15046 | 2 |
| D | 0 | 24654 | 2 |
| Quadrant | Total seconds | Saturated seconds | Saturation percentage |
|---|---|---|---|
| A | 7285 | 63 | 0.864791% |
| B | 7285 | 119 | 1.633493% |
| C | 7284 | 113 | 1.551345% |
| D | 7284 | 786 | 10.790774% |
Noise dominated data is calculated using 1-second bins in cleaned event files. If a bin has >2000 counts, and if more than 50% of those come from <1% of pixels, then it is considered to be noise-dominated and hence unusable.
| Quadrant | # 1 sec bins | Bins with >0 counts | Bins with >2000 counts | High rate bins dominated by noise | Noise dominated (total time) | Noise dominated (detector-on time) | Marked lightcurve |
|---|---|---|---|---|---|---|---|
| A | 7695 | 7286 | 2 | 2 | 0.03% | 0.03% | 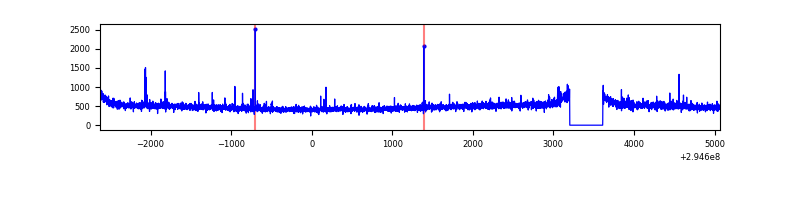 |
| B | 7695 | 7286 | 2 | 2 | 0.03% | 0.03% | 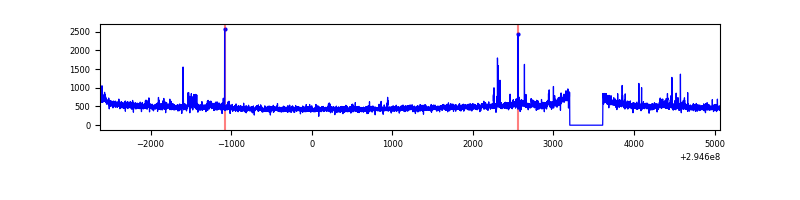 |
| C | 7694 | 7284 | 1 | 1 | 0.01% | 0.01% | 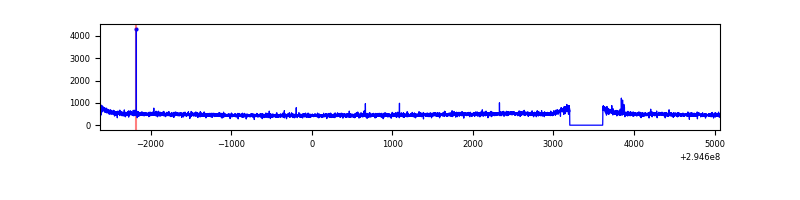 |
| D | 7694 | 7284 | 533 | 533 | 6.93% | 7.32% | 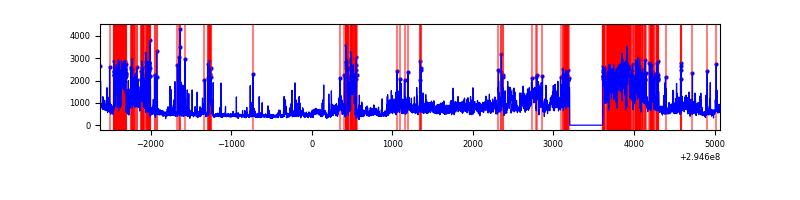 |
Top three noisy pixels from each quadrant. If the there are fewer than three noisy pixels in the level2.evt file, extra rows are filled as -1
| Pixel properties | Quadrant properties | ||||||
|---|---|---|---|---|---|---|---|
| Quadrant | DetID | PixID | Counts | Sigma | Mean | Median | Sigma |
| A | 5 | 16 | 33027 | 173.8 | 904 | 884 | 184.9 |
| A | 3 | 1 | 26582 | 138.95 | 904 | 884 | 184.9 |
| A | 13 | 254 | 10803 | 53.63 | 904 | 884 | 184.9 |
| B | 0 | 197 | 32545 | 181.38 | 900 | 879 | 174.6 |
| B | 12 | 111 | 20466 | 112.19 | 900 | 879 | 174.6 |
| B | 11 | 111 | 18013 | 98.14 | 900 | 879 | 174.6 |
| C | 14 | 238 | 134830 | 660.0 | 865 | 872 | 203.0 |
| C | 0 | 207 | 13443 | 61.94 | 865 | 872 | 203.0 |
| C | 13 | 61 | 6140 | 25.96 | 865 | 872 | 203.0 |
| D | 7 | 238 | 2087197 | 10212.91 | 837 | 811 | 204.3 |
| D | 1 | 52 | 1293944 | 6329.92 | 837 | 811 | 204.3 |
| D | 2 | 234 | 32741 | 156.3 | 837 | 811 | 204.3 |
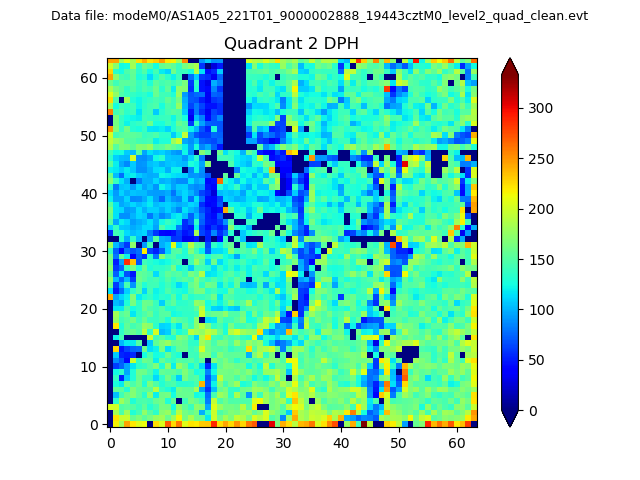
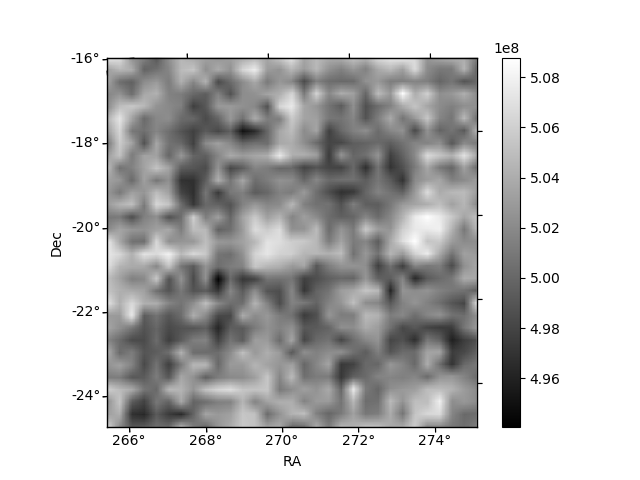
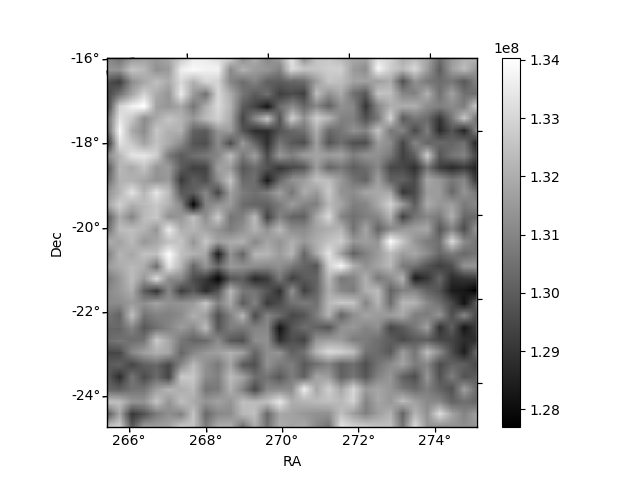
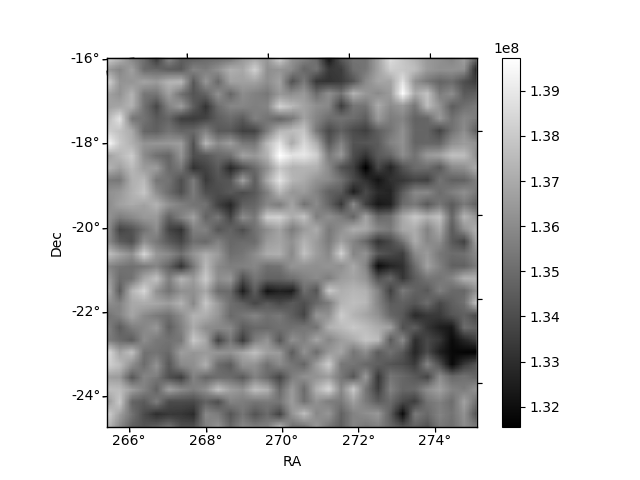
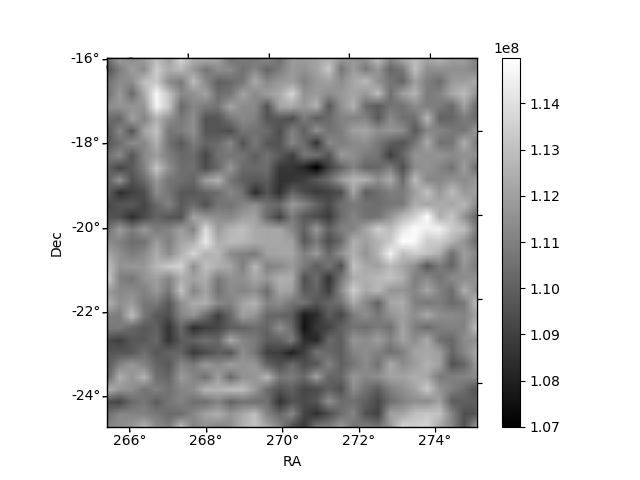
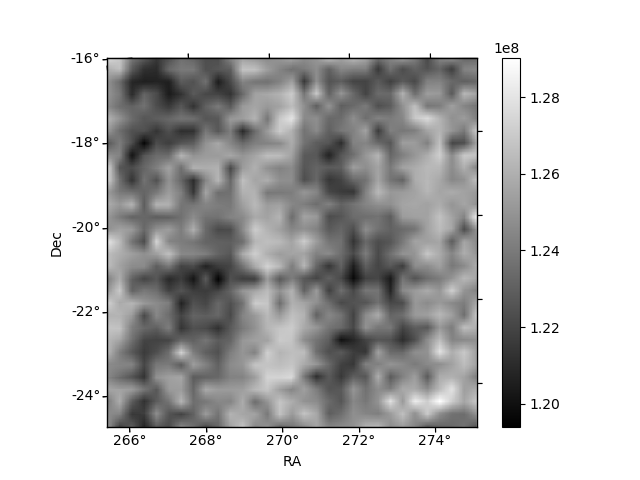
Histogram calculated using DETX and DETY for each event in the final _common_clean file
| Quadrant A | 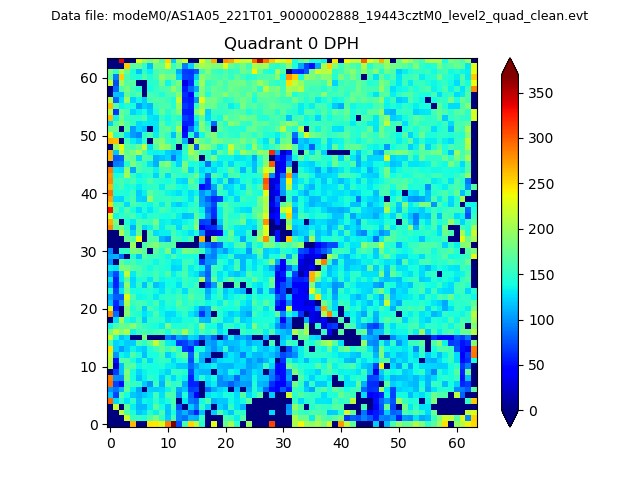 |
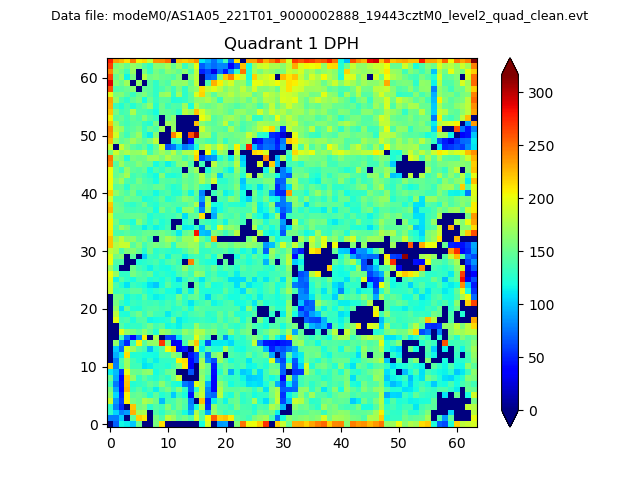 |
Quadrant B |
|---|---|---|---|
| Quadrant D | 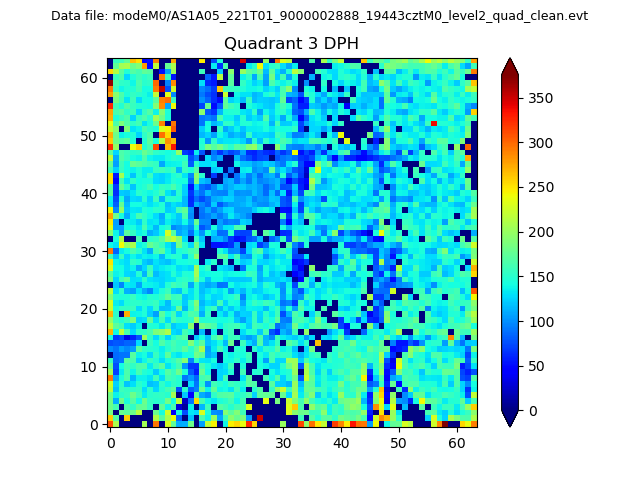 |
 |
Quadrant C |
| Plot type | Count rate plots | Images |
|---|---|---|
| Comparison with Poisson distribution Blue bars denote a histogram of data divided into 1 sec bins. Red curve is a Poisson curve with rate = median count rate of data. |
 |
 |
| Quadrant-wise count rates Data is divided into 100 sec bins |
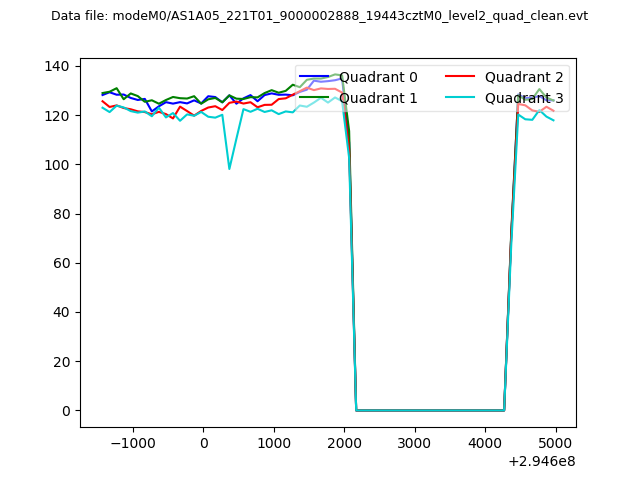 |
|
| Module-wise count rates for Quadrant A Data is divided into 100 sec bins |
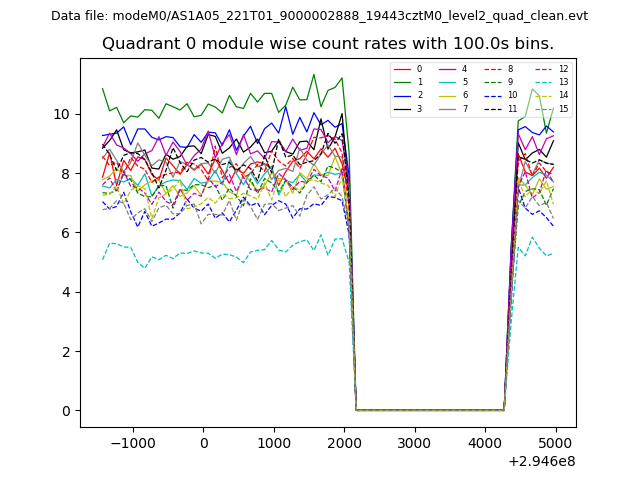 |
 |
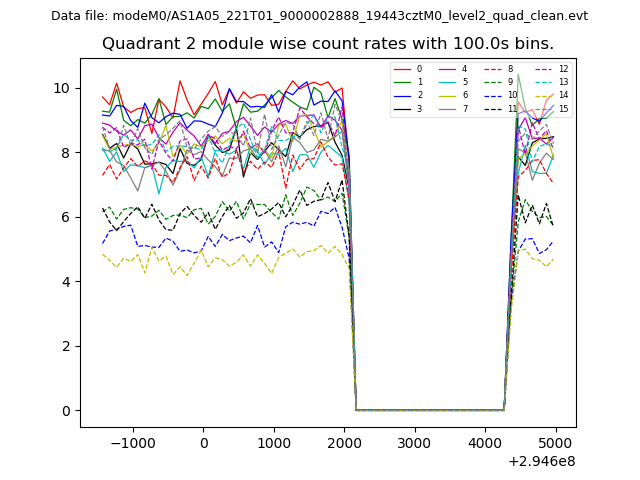
| Module-wise count rates for Quadrant B Data is divided into 100 sec bins |
 |
 |
| Module-wise count rates for Quadrant C Data is divided into 100 sec bins |
 |
 |
| Module-wise count rates for Quadrant D Data is divided into 100 sec bins |
 |
 |
| Parameter | Plot |
|---|---|
| CZT HV Monitor | 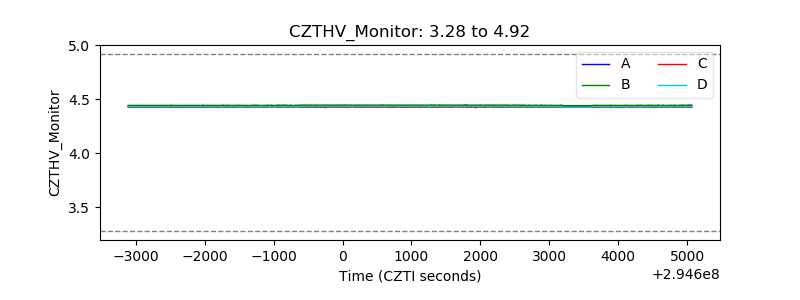 |
| D_VDD | 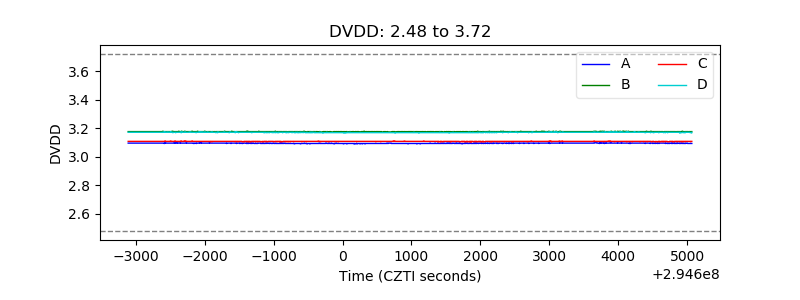 |
| Temperature 1 | 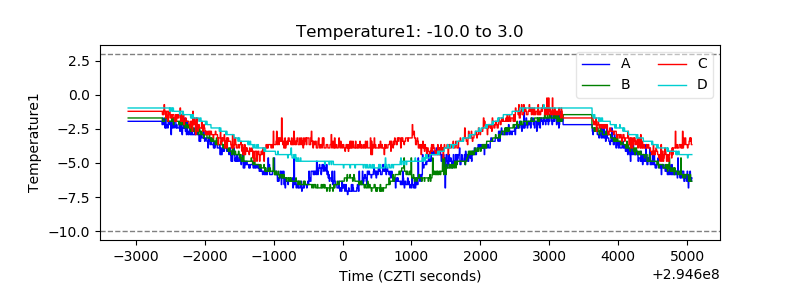 |
| Veto HV Monitor | 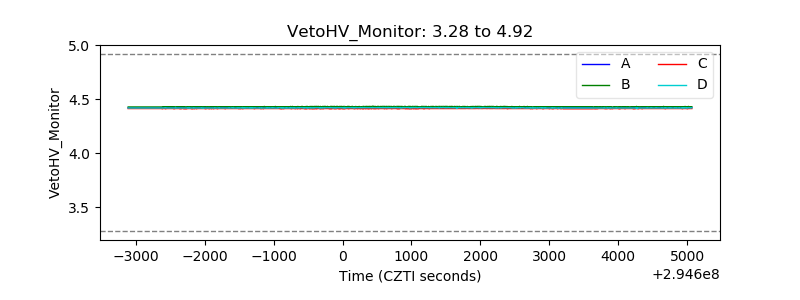 |
| Veto LLD | 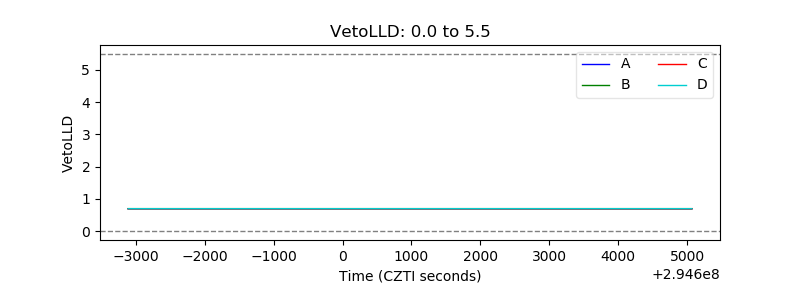 |
| Alpha Counter | 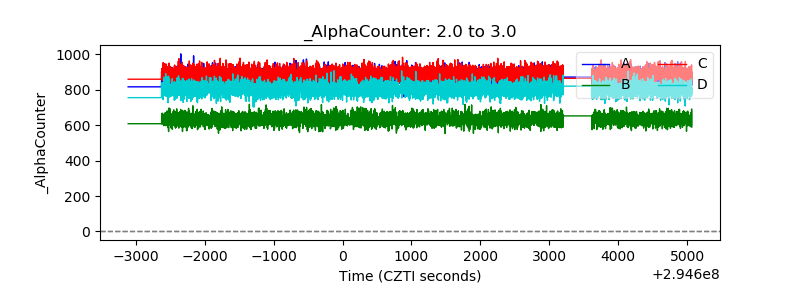 |
| _CPM_Rate | 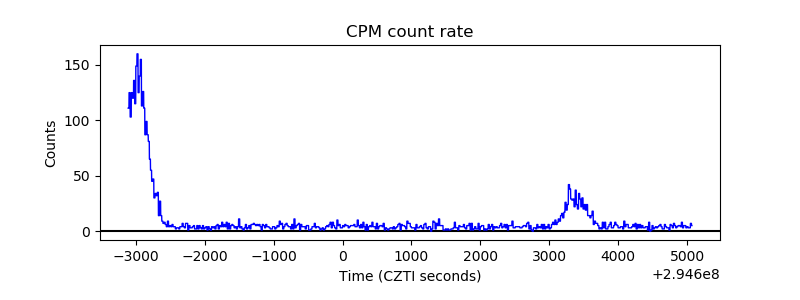 |
| CZT Counter | 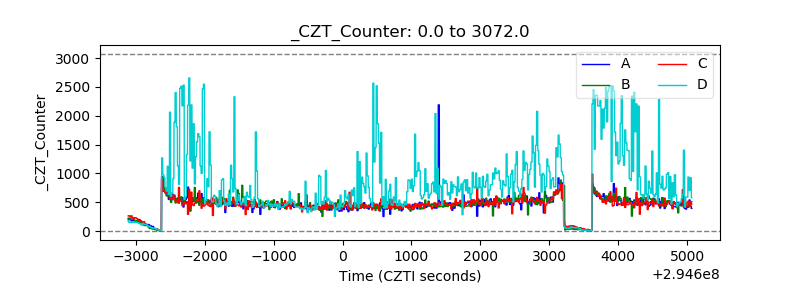 |
| +2.5 Volts monitor |  |
| +5 Volts monitor |  |
| _ROLL_ROT | 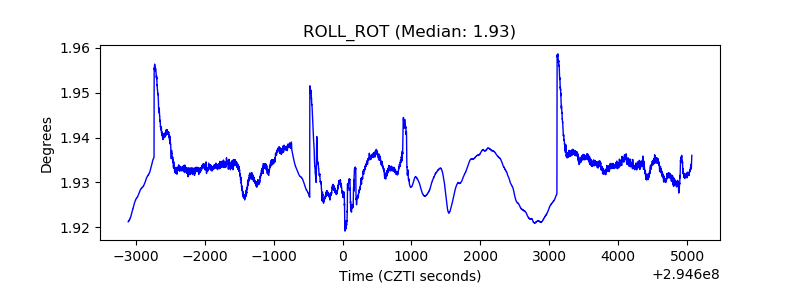 |
| _Roll_DEC | 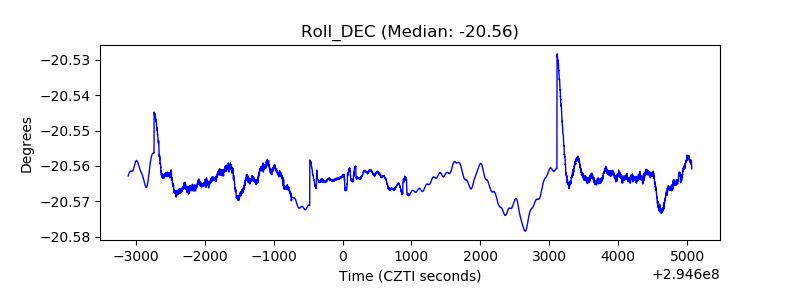 |
| _Roll_RA | 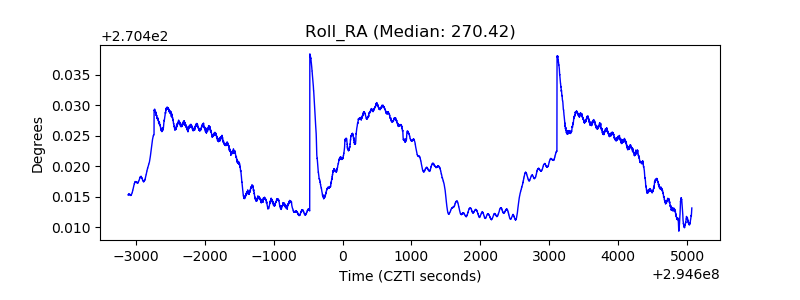 |
| Veto Counter |  |