| Param | Original file | Final file |
|---|---|---|
| Filename | modeM0/AS1A05_221T01_9000002888_19444cztM0_level2.evt | modeM0/AS1A05_221T01_9000002888_19444cztM0_level2_quad_clean.evt |
| Size (bytes) | 681,943,680 | 95,696,640 |
| Size | 650.4 MB | 91.3 MB |
| Events in quadrant A | 3,933,925 | 595,341 |
| Events in quadrant B | 4,067,005 | 601,870 |
| Events in quadrant C | 3,886,164 | 585,318 |
| Events in quadrant D | 8,222,607 | 558,094 |
| Mode SS | |||
|---|---|---|---|
| Quadrant | BADHDUFLAG | Total packets | Discarded packets |
| A | 0 | 164 | 0 |
| B | 0 | 164 | 0 |
| C | 0 | 164 | 0 |
| D | 0 | 164 | 0 |
| Mode M9 | |||
|---|---|---|---|
| Quadrant | BADHDUFLAG | Total packets | Discarded packets |
| A | 0 | 7 | 0 |
| B | 0 | 7 | 0 |
| C | 0 | 7 | 0 |
| D | 0 | 7 | 0 |
| Mode M0 | |||
|---|---|---|---|
| Quadrant | BADHDUFLAG | Total packets | Discarded packets |
| A | 0 | 16831 | 2 |
| B | 0 | 17197 | 2 |
| C | 0 | 16639 | 2 |
| D | 0 | 29969 | 2 |
| Quadrant | Total seconds | Saturated seconds | Saturation percentage |
|---|---|---|---|
| A | 8020 | 68 | 0.847880% |
| B | 8020 | 123 | 1.533666% |
| C | 8021 | 156 | 1.944895% |
| D | 8021 | 1206 | 15.035532% |
Noise dominated data is calculated using 1-second bins in cleaned event files. If a bin has >2000 counts, and if more than 50% of those come from <1% of pixels, then it is considered to be noise-dominated and hence unusable.
| Quadrant | # 1 sec bins | Bins with >0 counts | Bins with >2000 counts | High rate bins dominated by noise | Noise dominated (total time) | Noise dominated (detector-on time) | Marked lightcurve |
|---|---|---|---|---|---|---|---|
| A | 8735 | 8022 | 0 | 0 | 0.00% | 0.00% | 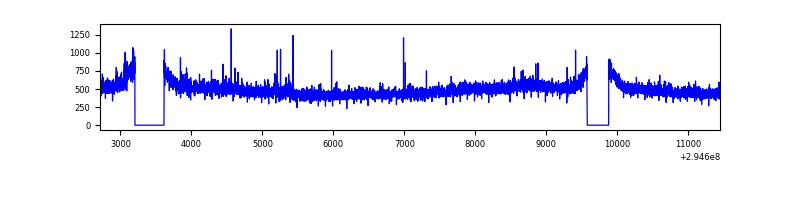 |
| B | 8735 | 8022 | 6 | 6 | 0.07% | 0.07% | 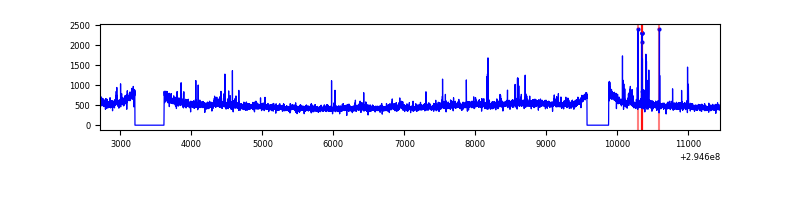 |
| C | 8736 | 8022 | 0 | 0 | 0.00% | 0.00% | 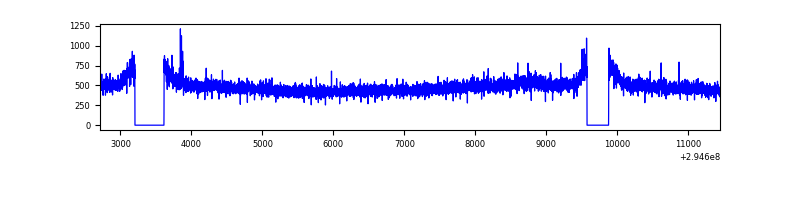 |
| D | 8736 | 8022 | 894 | 894 | 10.23% | 11.14% | 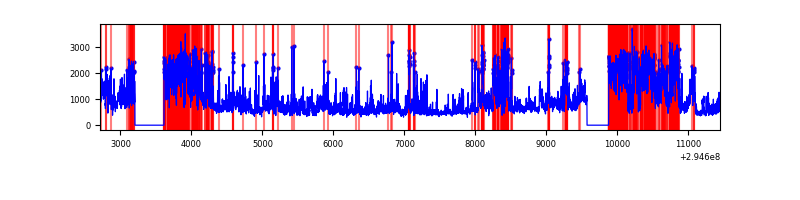 |
Top three noisy pixels from each quadrant. If the there are fewer than three noisy pixels in the level2.evt file, extra rows are filled as -1
| Pixel properties | Quadrant properties | ||||||
|---|---|---|---|---|---|---|---|
| Quadrant | DetID | PixID | Counts | Sigma | Mean | Median | Sigma |
| A | 3 | 1 | 36196 | 173.32 | 996 | 975 | 203.2 |
| A | 11 | 29 | 30833 | 146.93 | 996 | 975 | 203.2 |
| A | 5 | 16 | 14523 | 66.67 | 996 | 975 | 203.2 |
| B | 0 | 198 | 41860 | 212.85 | 993 | 970 | 192.1 |
| B | 7 | 220 | 37699 | 191.19 | 993 | 970 | 192.1 |
| B | 0 | 197 | 36998 | 187.54 | 993 | 970 | 192.1 |
| C | 14 | 238 | 148451 | 652.7 | 955 | 962 | 226.0 |
| C | 0 | 207 | 10304 | 41.34 | 955 | 962 | 226.0 |
| C | 13 | 61 | 6672 | 25.27 | 955 | 962 | 226.0 |
| D | 7 | 238 | 3564407 | 16021.78 | 912 | 883 | 222.4 |
| D | 1 | 52 | 1196533 | 5375.7 | 912 | 883 | 222.4 |
| D | 2 | 234 | 35203 | 154.3 | 912 | 883 | 222.4 |
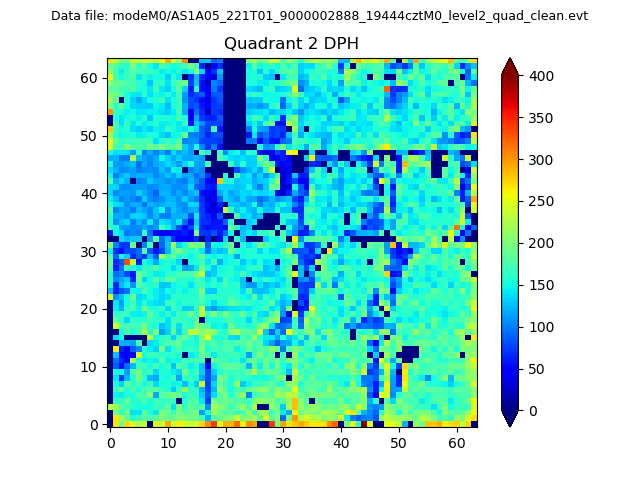
Histogram calculated using DETX and DETY for each event in the final _common_clean file
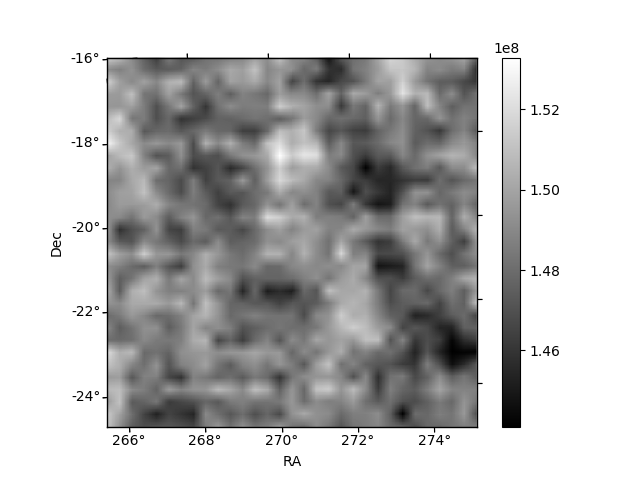
| Quadrant A | 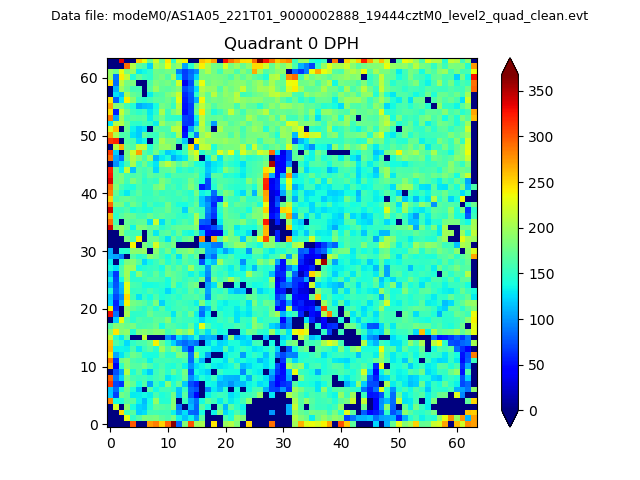 |
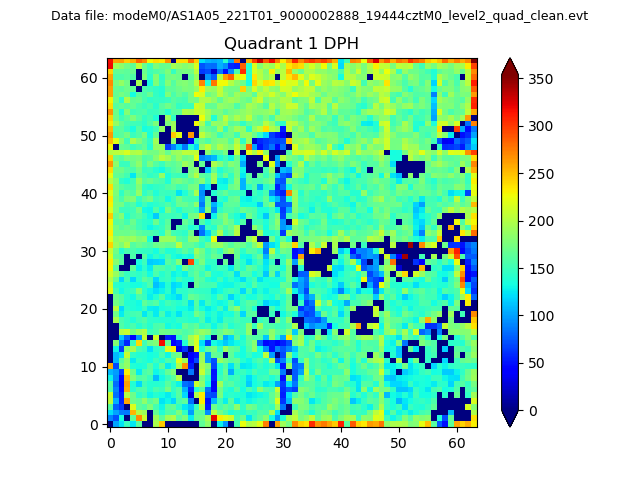 |
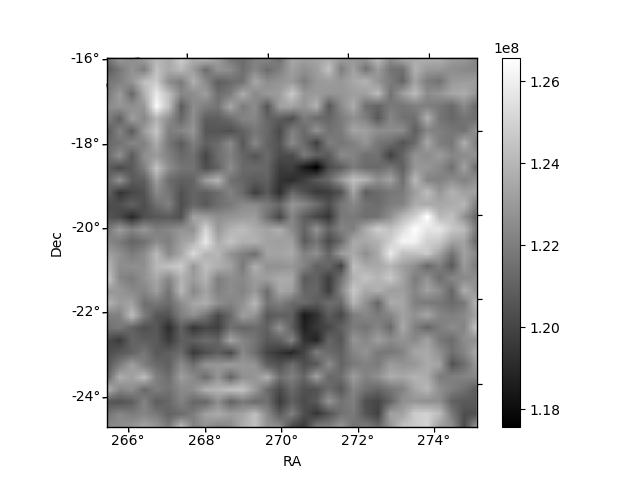
Quadrant B |
|---|---|---|---|
| Quadrant D | 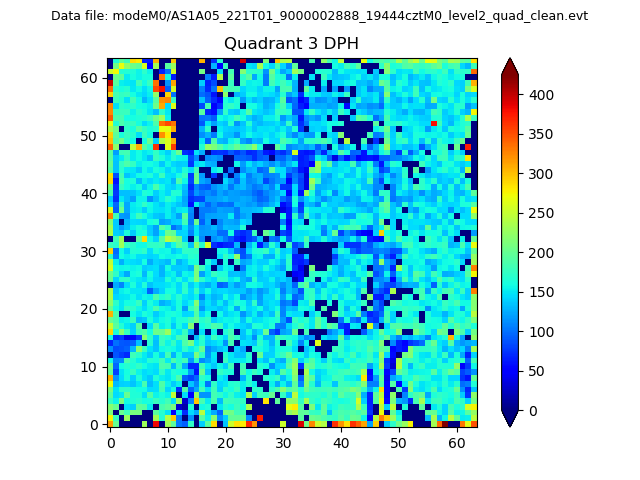 |
 |
Quadrant C |
| Plot type | Count rate plots | Images |
|---|---|---|
| Comparison with Poisson distribution Blue bars denote a histogram of data divided into 1 sec bins. Red curve is a Poisson curve with rate = median count rate of data. |
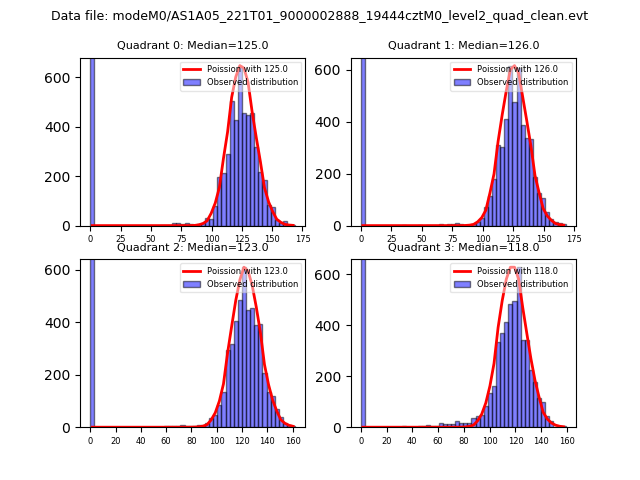 |
 |
| Quadrant-wise count rates Data is divided into 100 sec bins |
 |
|
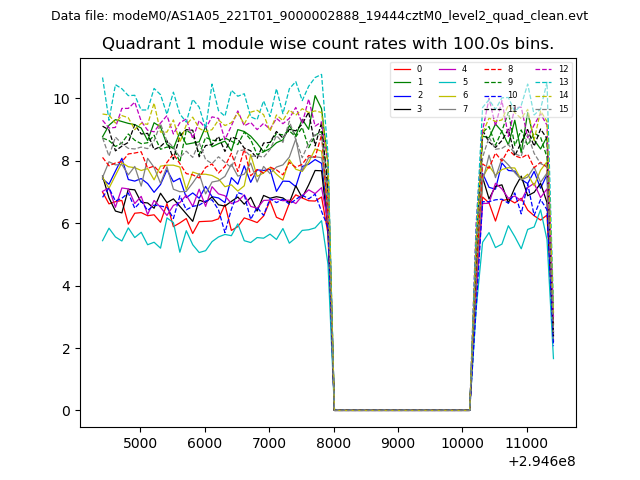
| Module-wise count rates for Quadrant A Data is divided into 100 sec bins |
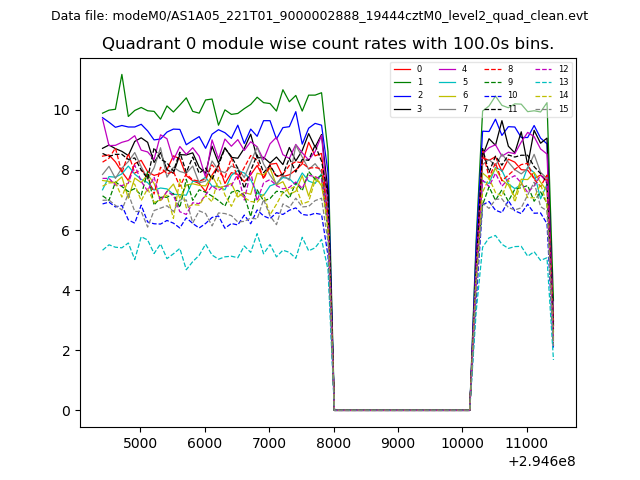 |
 |
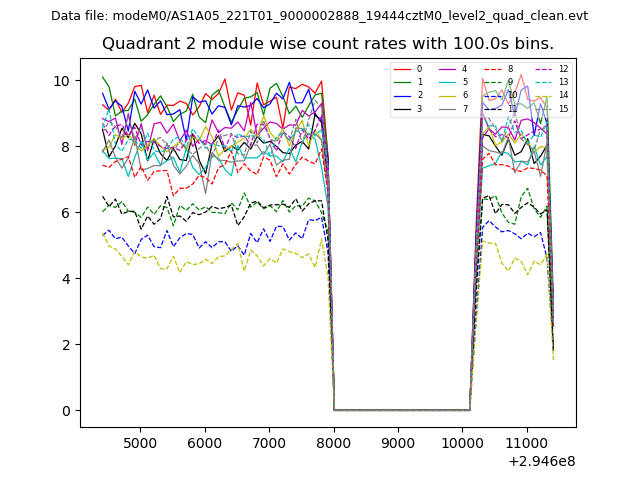
| Module-wise count rates for Quadrant B Data is divided into 100 sec bins |
 |
 |
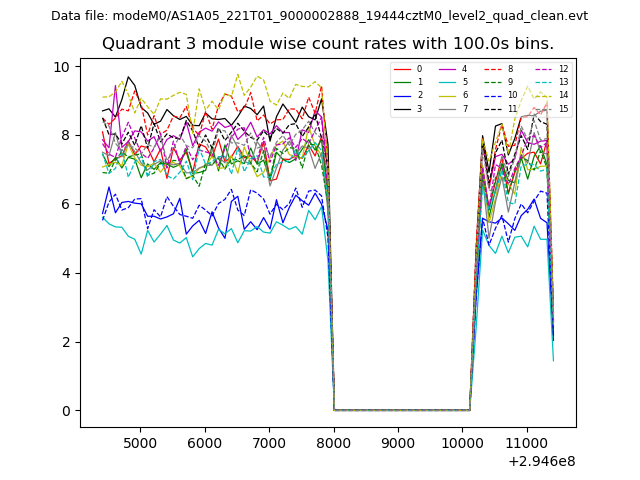
| Module-wise count rates for Quadrant C Data is divided into 100 sec bins |
 |
 |
| Module-wise count rates for Quadrant D Data is divided into 100 sec bins |
 |
 |
| Parameter | Plot |
|---|---|
| CZT HV Monitor | 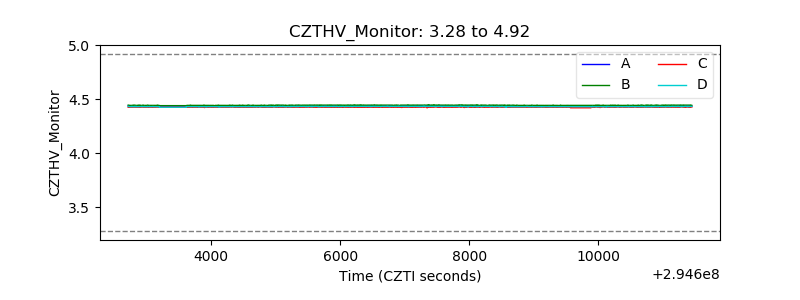 |
| D_VDD | 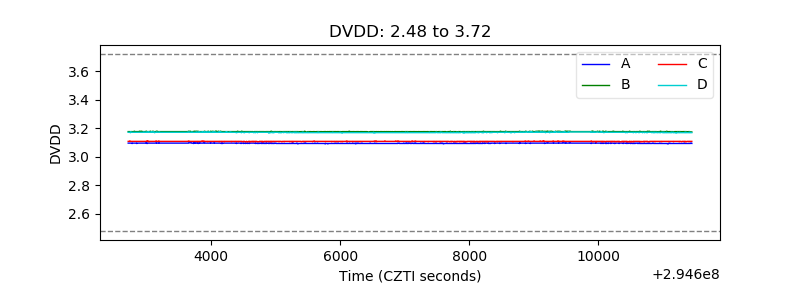 |
| Temperature 1 | 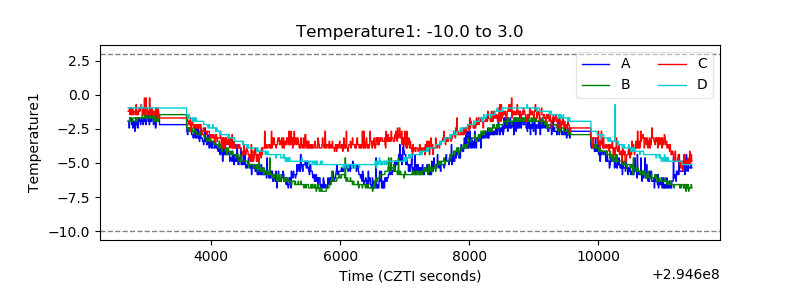 |
| Veto HV Monitor | 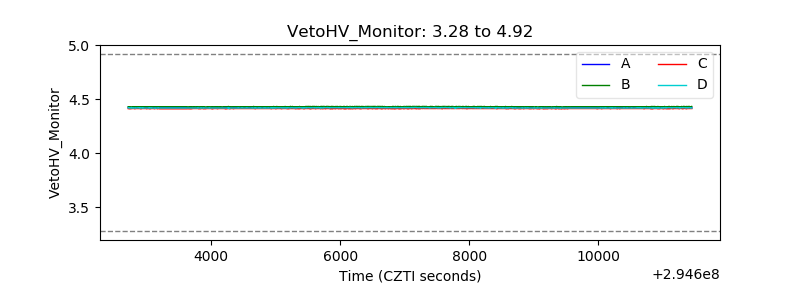 |
| Veto LLD | 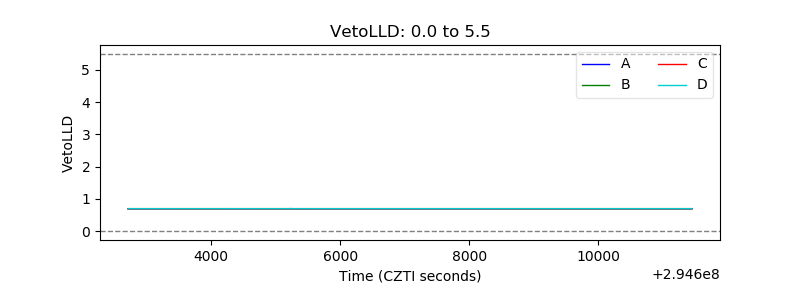 |
| Alpha Counter |  |
| _CPM_Rate | 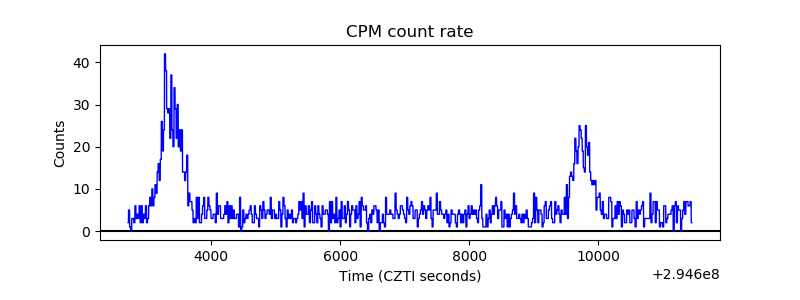 |
| CZT Counter | 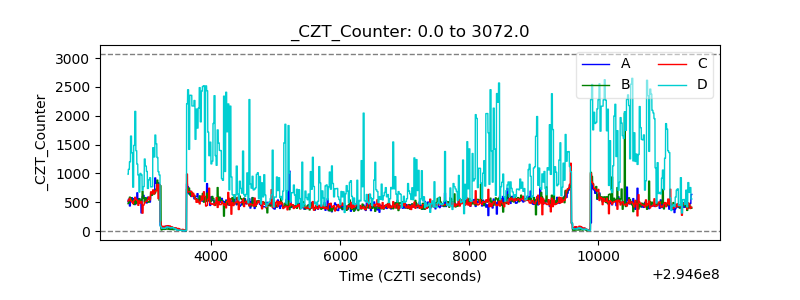 |
| +2.5 Volts monitor | 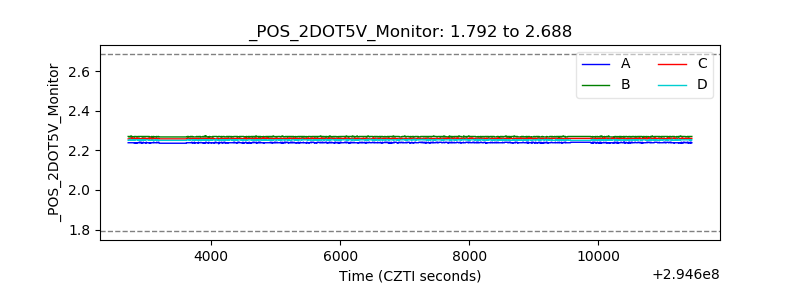 |
| +5 Volts monitor |  |
| _ROLL_ROT | 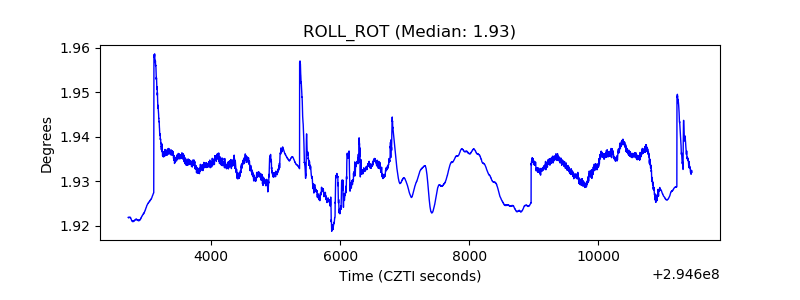 |
| _Roll_DEC | 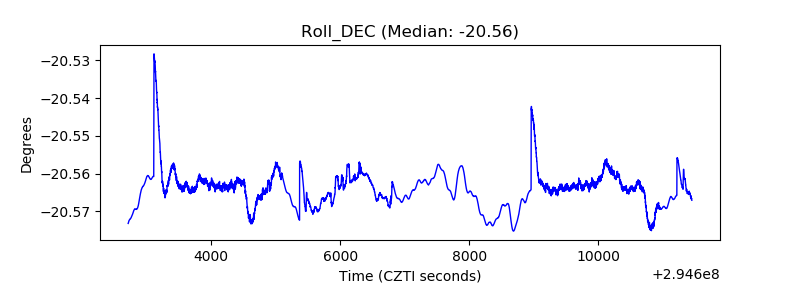 |
| _Roll_RA | 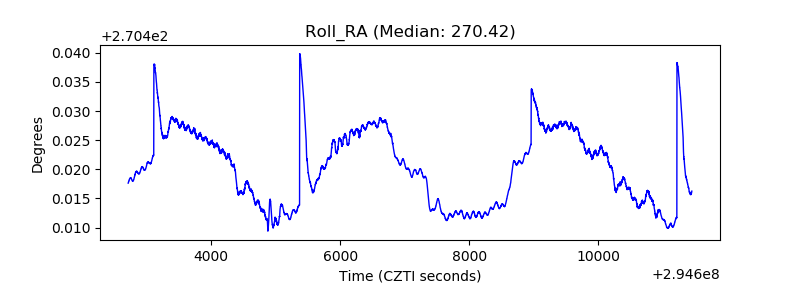 |
| Veto Counter | 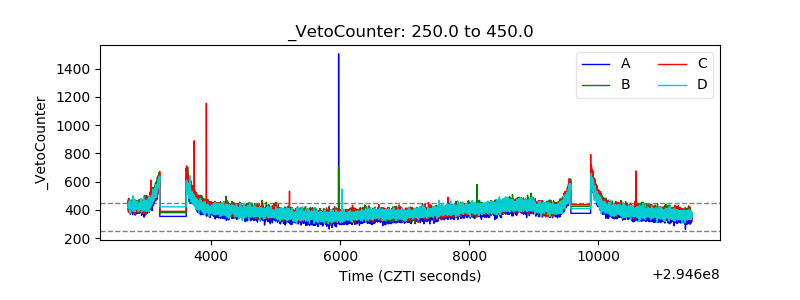 |