| Param | Original file | Final file |
|---|---|---|
| Filename | modeM0/AS1A05_221T01_9000002888_19448cztM0_level2.evt | modeM0/AS1A05_221T01_9000002888_19448cztM0_level2_quad_clean.evt |
| Size (bytes) | 1,068,073,920 | 178,364,160 |
| Size | 1018.6 MB | 170.1 MB |
| Events in quadrant A | 6,743,834 | 1,124,298 |
| Events in quadrant B | 6,902,178 | 1,140,332 |
| Events in quadrant C | 6,732,415 | 1,116,131 |
| Events in quadrant D | 11,006,224 | 1,038,937 |
| Mode SS | |||
|---|---|---|---|
| Quadrant | BADHDUFLAG | Total packets | Discarded packets |
| A | 0 | 306 | 20 |
| B | 0 | 306 | 14 |
| C | 0 | 306 | 18 |
| D | 0 | 306 | 14 |
| Mode M9 | |||
|---|---|---|---|
| Quadrant | BADHDUFLAG | Total packets | Discarded packets |
| A | 0 | 17 | 0 |
| B | 0 | 17 | 1 |
| C | 0 | 17 | 0 |
| D | 0 | 17 | 0 |
| Mode M0 | |||
|---|---|---|---|
| Quadrant | BADHDUFLAG | Total packets | Discarded packets |
| A | 0 | 31088 | 1565 |
| B | 0 | 31884 | 1964 |
| C | 0 | 30837 | 1544 |
| D | 0 | 48835 | 6780 |
| Quadrant | Total seconds | Saturated seconds | Saturation percentage |
|---|---|---|---|
| A | 14328 | 72 | 0.502513% |
| B | 14264 | 128 | 0.897364% |
| C | 14338 | 144 | 1.004324% |
| D | 13958 | 889 | 6.369107% |
Noise dominated data is calculated using 1-second bins in cleaned event files. If a bin has >2000 counts, and if more than 50% of those come from <1% of pixels, then it is considered to be noise-dominated and hence unusable.
| Quadrant | # 1 sec bins | Bins with >0 counts | Bins with >2000 counts | High rate bins dominated by noise | Noise dominated (total time) | Noise dominated (detector-on time) | Marked lightcurve |
|---|---|---|---|---|---|---|---|
| A | 16739 | 14697 | 14 | 14 | 0.08% | 0.10% | 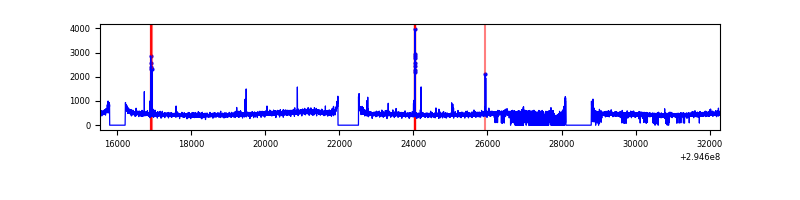 |
| B | 16740 | 14654 | 25 | 25 | 0.15% | 0.17% | 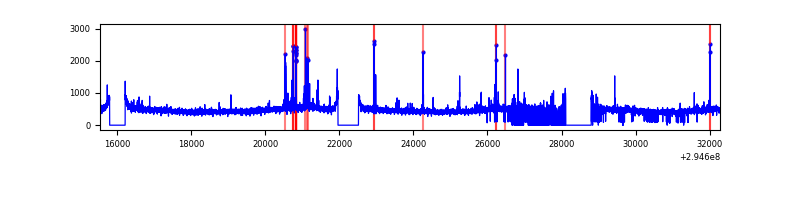 |
| C | 16740 | 14736 | 0 | 0 | 0.00% | 0.00% | 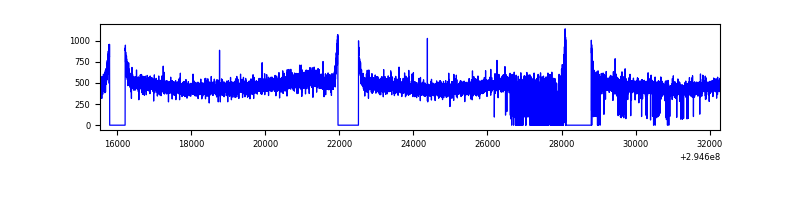 |
| D | 16740 | 14210 | 706 | 706 | 4.22% | 4.97% | 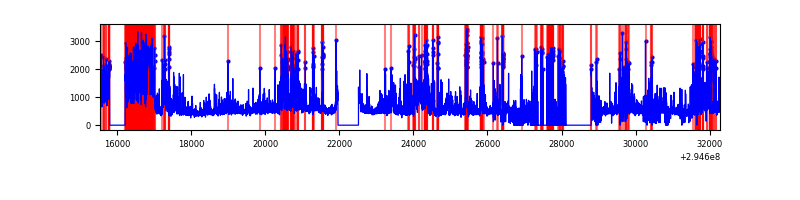 |
Top three noisy pixels from each quadrant. If the there are fewer than three noisy pixels in the level2.evt file, extra rows are filled as -1
| Pixel properties | Quadrant properties | ||||||
|---|---|---|---|---|---|---|---|
| Quadrant | DetID | PixID | Counts | Sigma | Mean | Median | Sigma |
| A | 12 | 96 | 72542 | 204.82 | 1704 | 1667 | 346.0 |
| A | 11 | 29 | 69890 | 197.16 | 1704 | 1667 | 346.0 |
| A | 9 | 143 | 23682 | 63.62 | 1704 | 1667 | 346.0 |
| B | 7 | 220 | 120583 | 368.59 | 1687 | 1644 | 322.7 |
| B | 0 | 198 | 44717 | 133.48 | 1687 | 1644 | 322.7 |
| B | 12 | 111 | 39634 | 117.73 | 1687 | 1644 | 322.7 |
| C | 14 | 238 | 255521 | 653.9 | 1649 | 1661 | 388.2 |
| C | 9 | 221 | 41872 | 103.58 | 1649 | 1661 | 388.2 |
| C | 13 | 61 | 11478 | 25.29 | 1649 | 1661 | 388.2 |
| D | 7 | 238 | 4323741 | 11098.24 | 1587 | 1541 | 389.4 |
| D | 1 | 52 | 548814 | 1405.25 | 1587 | 1541 | 389.4 |
| D | 5 | 222 | 100533 | 254.18 | 1587 | 1541 | 389.4 |
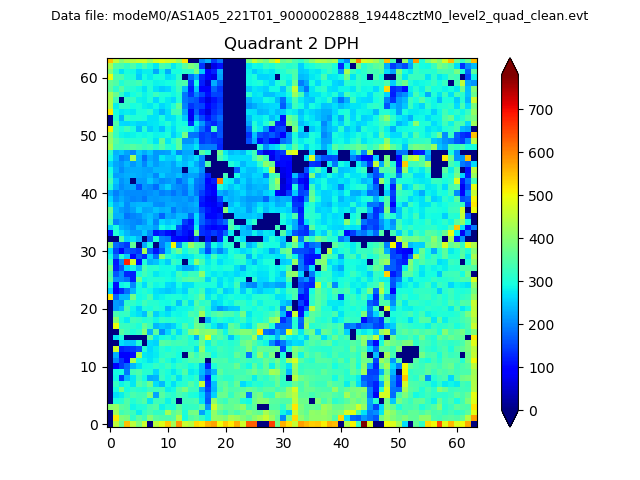
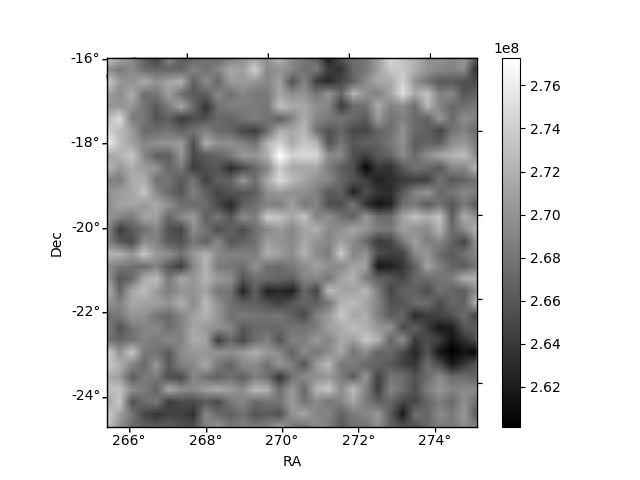
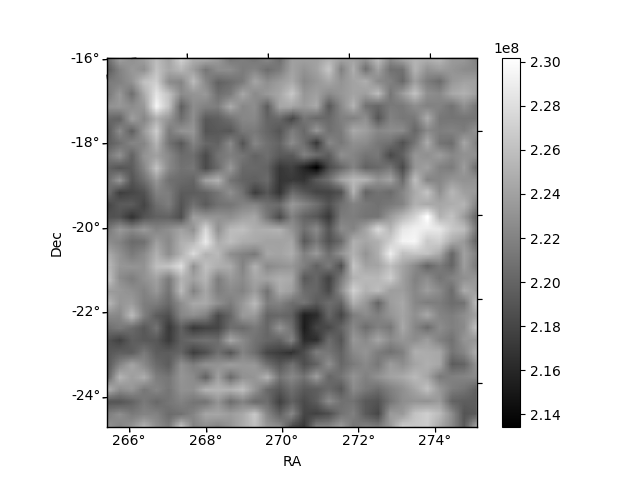
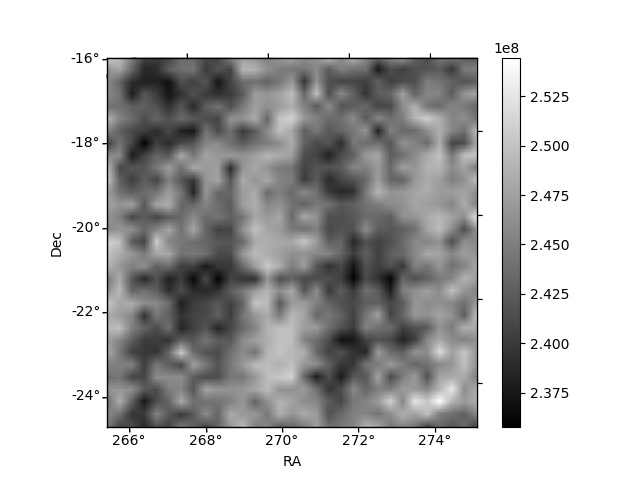
Histogram calculated using DETX and DETY for each event in the final _common_clean file
| Quadrant A | 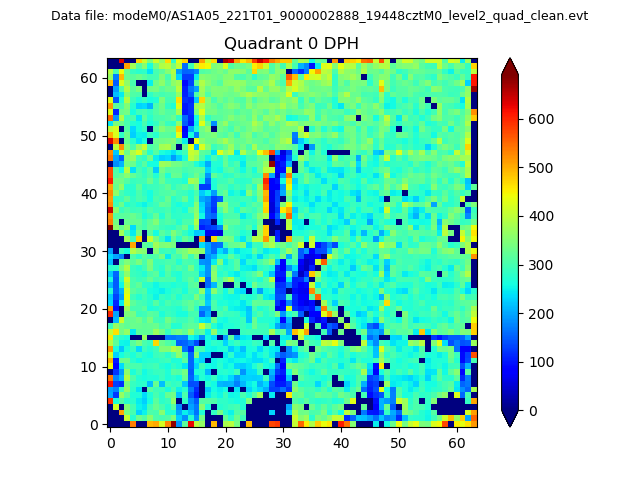 |
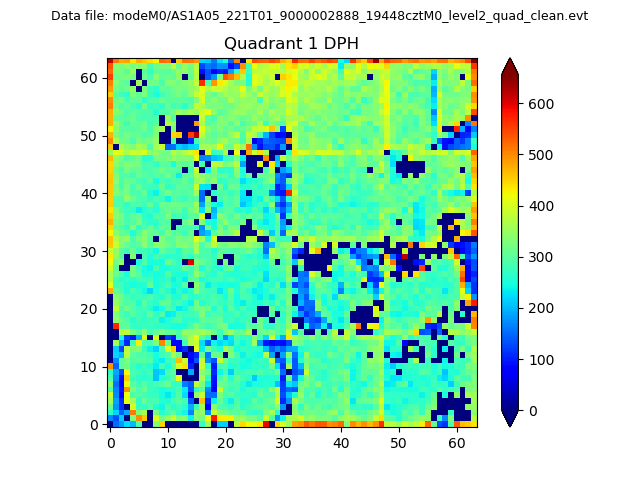 |
Quadrant B |
|---|---|---|---|
| Quadrant D | 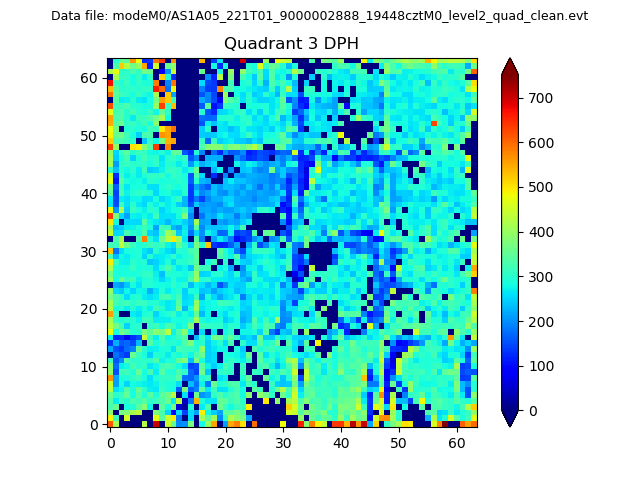 |
 |
Quadrant C |
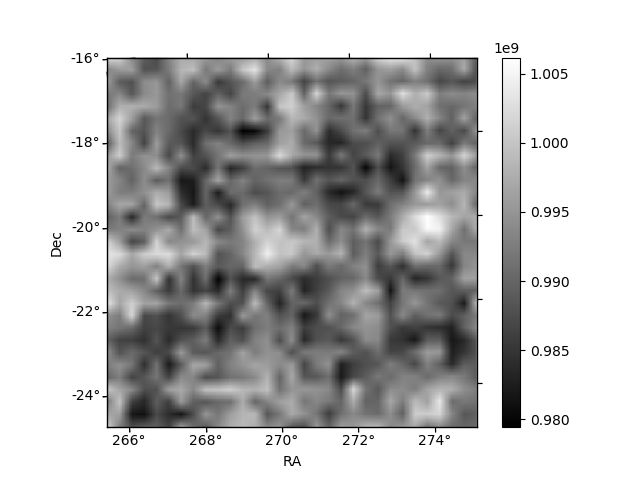
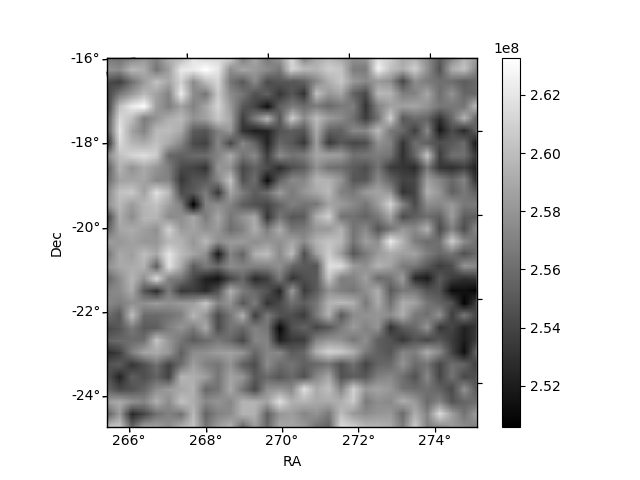
| Plot type | Count rate plots | Images |
|---|---|---|
| Comparison with Poisson distribution Blue bars denote a histogram of data divided into 1 sec bins. Red curve is a Poisson curve with rate = median count rate of data. |
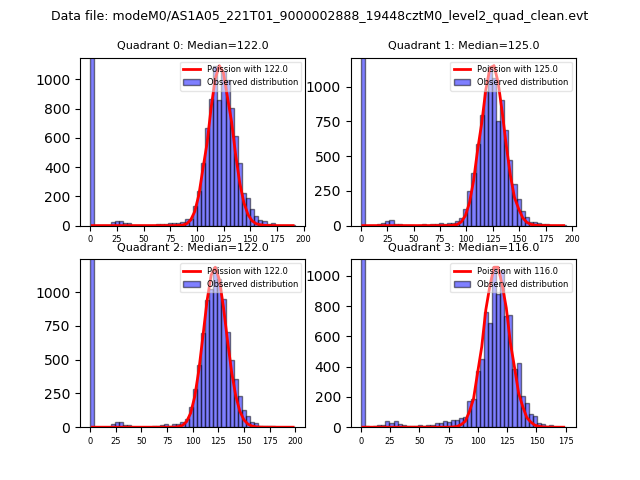 |
 |
| Quadrant-wise count rates Data is divided into 100 sec bins |
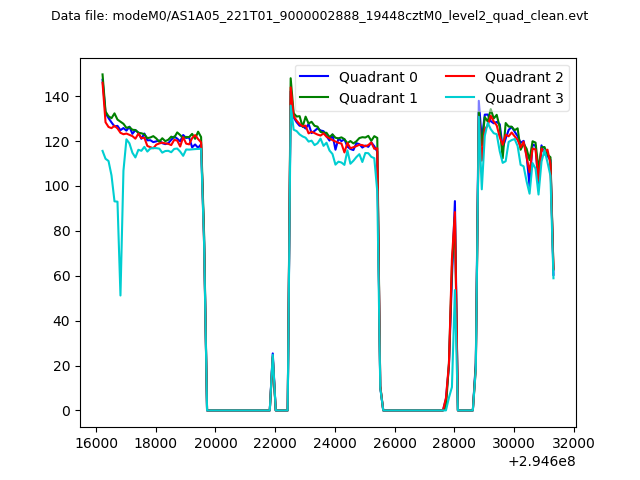 |
|
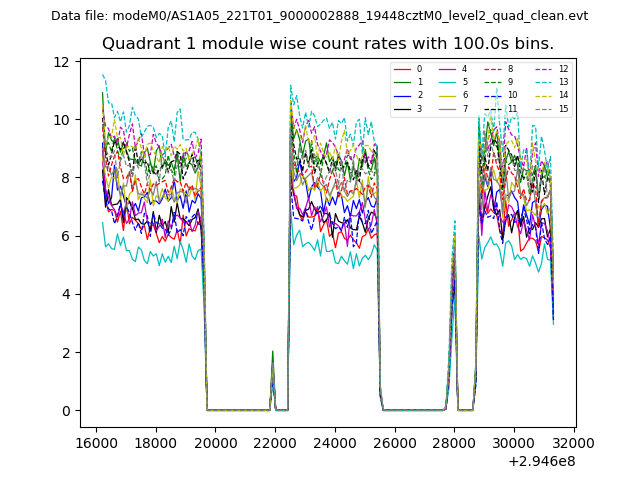
| Module-wise count rates for Quadrant A Data is divided into 100 sec bins |
 |
 |
| Module-wise count rates for Quadrant B Data is divided into 100 sec bins |
 |
 |
| Module-wise count rates for Quadrant C Data is divided into 100 sec bins |
 |
 |
| Module-wise count rates for Quadrant D Data is divided into 100 sec bins |
 |
 |
| Parameter | Plot |
|---|---|
| CZT HV Monitor | 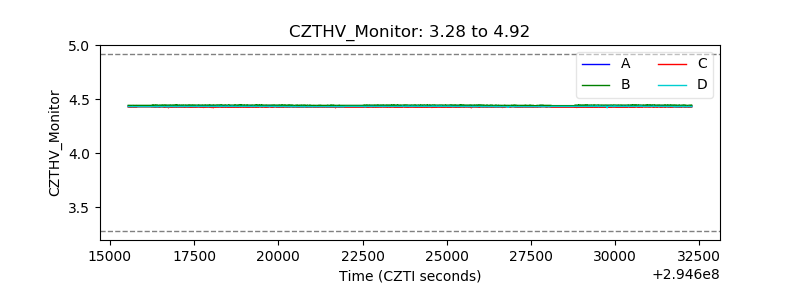 |
| D_VDD | 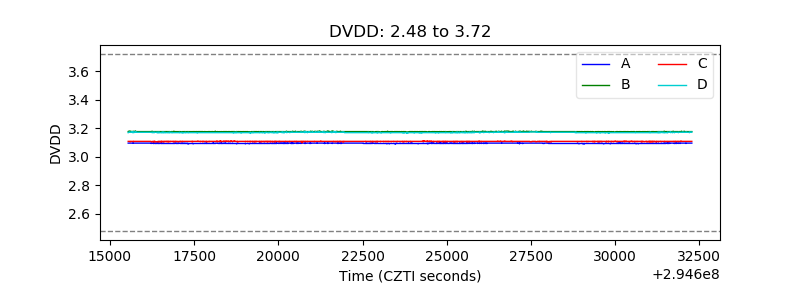 |
| Temperature 1 | 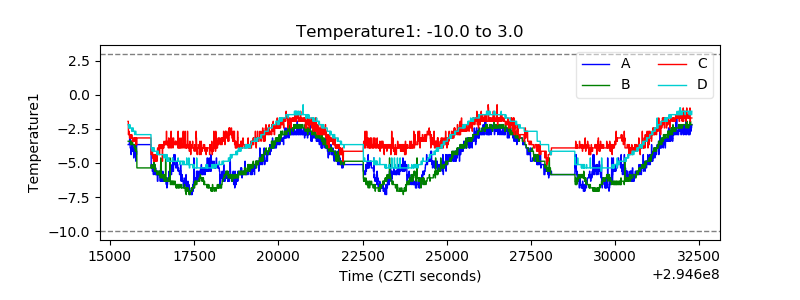 |
| Veto HV Monitor |  |
| Veto LLD | 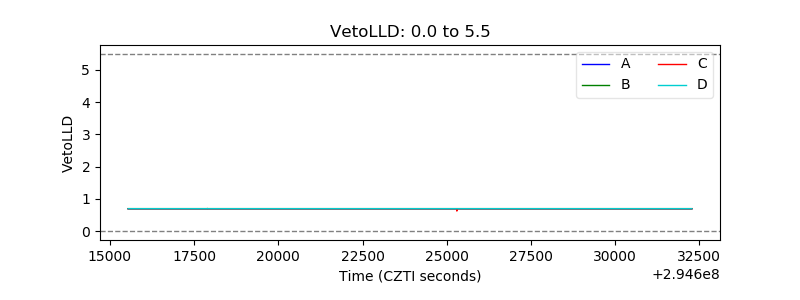 |
| Alpha Counter | 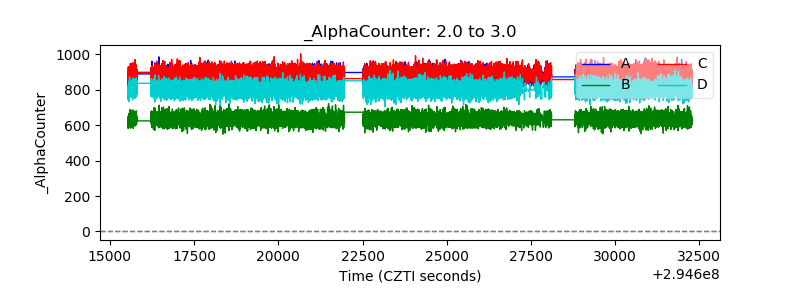 |
| _CPM_Rate | 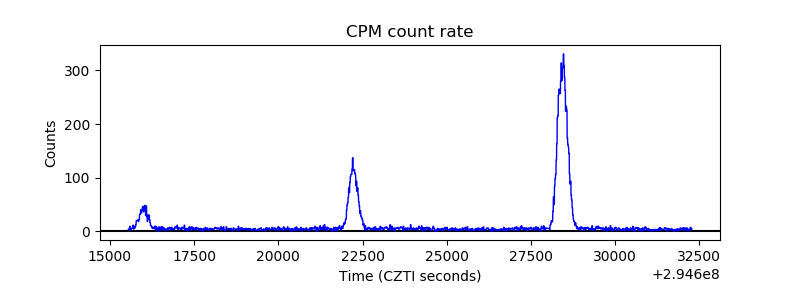 |
| CZT Counter | 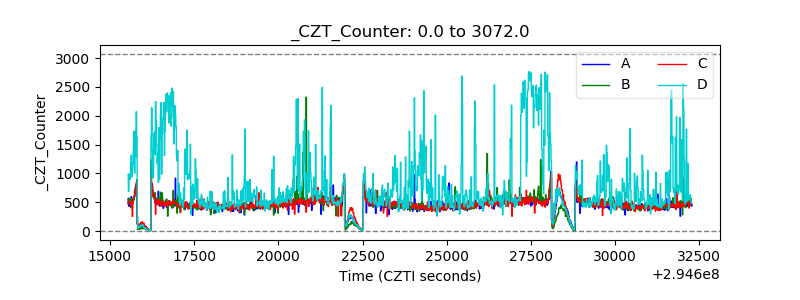 |
| +2.5 Volts monitor | 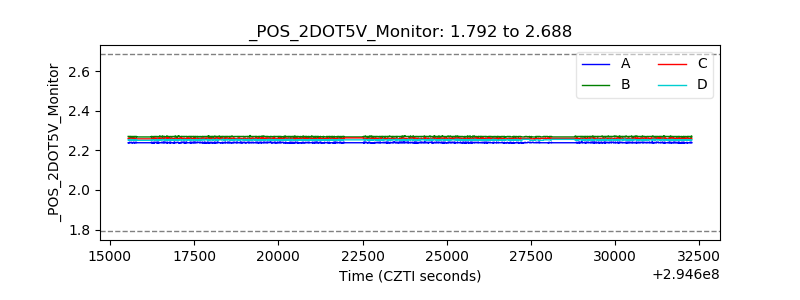 |
| +5 Volts monitor |  |
| _ROLL_ROT | 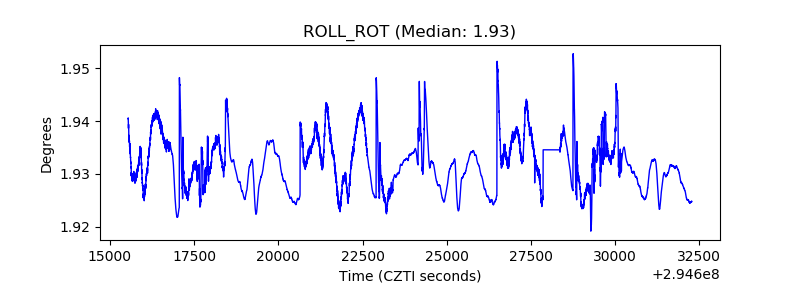 |
| _Roll_DEC |  |
| _Roll_RA | 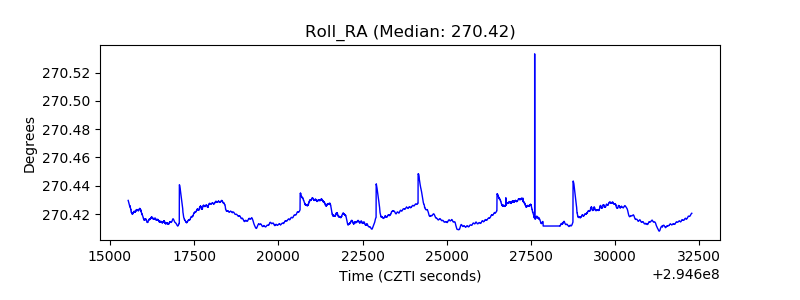 |
| Veto Counter | 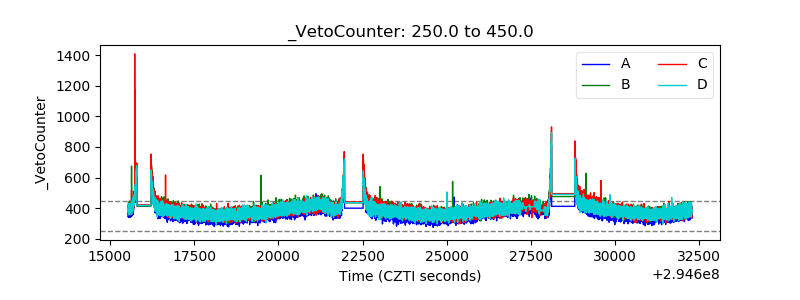 |