| Param | Original file | Final file |
|---|---|---|
| Filename | modeM0/AS1A05_221T01_9000002888_19449cztM0_level2.evt | modeM0/AS1A05_221T01_9000002888_19449cztM0_level2_quad_clean.evt |
| Size (bytes) | 565,496,640 | 76,354,560 |
| Size | 539.3 MB | 72.8 MB |
| Events in quadrant A | 3,553,450 | 461,205 |
| Events in quadrant B | 3,729,384 | 467,366 |
| Events in quadrant C | 3,769,232 | 451,417 |
| Events in quadrant D | 5,578,953 | 423,536 |
| Mode SS | |||
|---|---|---|---|
| Quadrant | BADHDUFLAG | Total packets | Discarded packets |
| A | 0 | 152 | 4 |
| B | 0 | 152 | 4 |
| C | 0 | 152 | 6 |
| D | 0 | 152 | 6 |
| Mode M9 | |||
|---|---|---|---|
| Quadrant | BADHDUFLAG | Total packets | Discarded packets |
| A | 0 | 14 | 3 |
| B | 0 | 14 | 2 |
| C | 0 | 14 | 2 |
| D | 0 | 13 | 2 |
| Mode M0 | |||
|---|---|---|---|
| Quadrant | BADHDUFLAG | Total packets | Discarded packets |
| A | 0 | 15233 | 311 |
| B | 0 | 15752 | 310 |
| C | 0 | 16014 | 382 |
| D | 0 | 21877 | 384 |
| Quadrant | Total seconds | Saturated seconds | Saturation percentage |
|---|---|---|---|
| A | 7314 | 20 | 0.273448% |
| B | 7311 | 59 | 0.807003% |
| C | 7301 | 77 | 1.054650% |
| D | 7298 | 452 | 6.193478% |
Noise dominated data is calculated using 1-second bins in cleaned event files. If a bin has >2000 counts, and if more than 50% of those come from <1% of pixels, then it is considered to be noise-dominated and hence unusable.
| Quadrant | # 1 sec bins | Bins with >0 counts | Bins with >2000 counts | High rate bins dominated by noise | Noise dominated (total time) | Noise dominated (detector-on time) | Marked lightcurve |
|---|---|---|---|---|---|---|---|
| A | 8315 | 7369 | 1 | 1 | 0.01% | 0.01% | 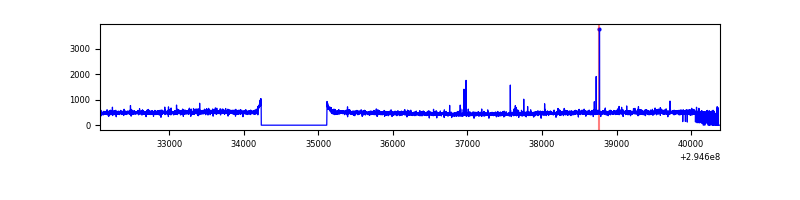 |
| B | 8317 | 7358 | 11 | 11 | 0.13% | 0.15% | 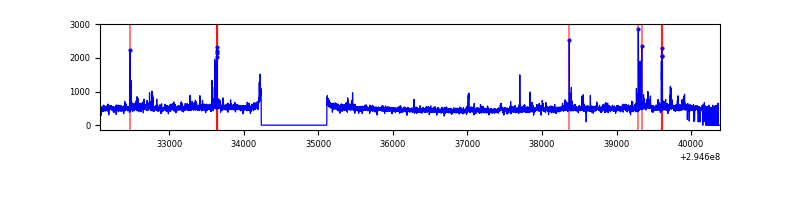 |
| C | 8309 | 7358 | 10 | 10 | 0.12% | 0.14% | 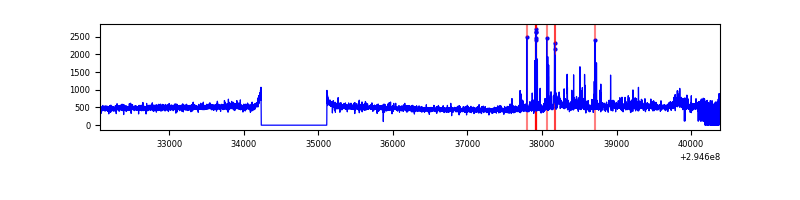 |
| D | 8315 | 7357 | 391 | 391 | 4.70% | 5.31% | 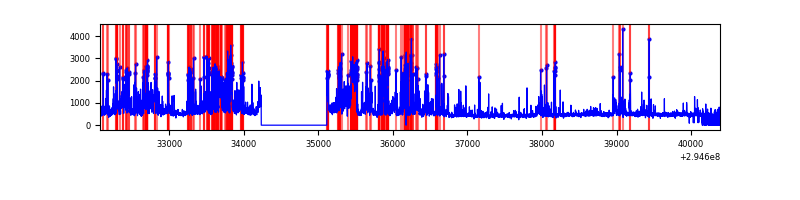 |
Top three noisy pixels from each quadrant. If the there are fewer than three noisy pixels in the level2.evt file, extra rows are filled as -1
| Pixel properties | Quadrant properties | ||||||
|---|---|---|---|---|---|---|---|
| Quadrant | DetID | PixID | Counts | Sigma | Mean | Median | Sigma |
| A | 11 | 29 | 44533 | 238.12 | 902 | 881 | 183.3 |
| A | 3 | 1 | 14216 | 72.74 | 902 | 881 | 183.3 |
| A | 12 | 96 | 13676 | 69.8 | 902 | 881 | 183.3 |
| B | 7 | 220 | 64905 | 369.44 | 896 | 871 | 173.3 |
| B | 0 | 197 | 55122 | 313.0 | 896 | 871 | 173.3 |
| B | 0 | 198 | 25712 | 143.32 | 896 | 871 | 173.3 |
| C | 9 | 221 | 164786 | 806.73 | 861 | 867 | 203.2 |
| C | 14 | 238 | 132940 | 650.0 | 861 | 867 | 203.2 |
| C | 0 | 207 | 105933 | 517.09 | 861 | 867 | 203.2 |
| D | 7 | 238 | 1577166 | 7451.38 | 861 | 835 | 211.5 |
| D | 1 | 52 | 433522 | 2045.33 | 861 | 835 | 211.5 |
| D | 5 | 222 | 130424 | 612.57 | 861 | 835 | 211.5 |
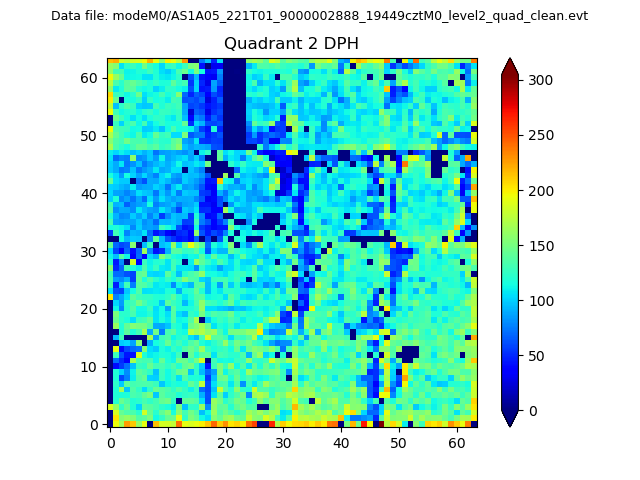
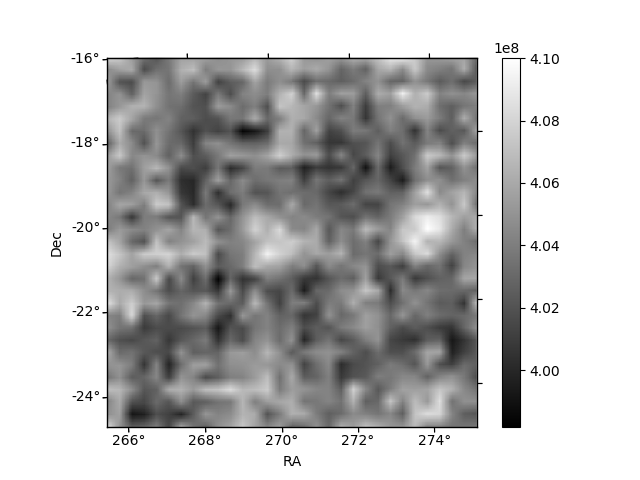
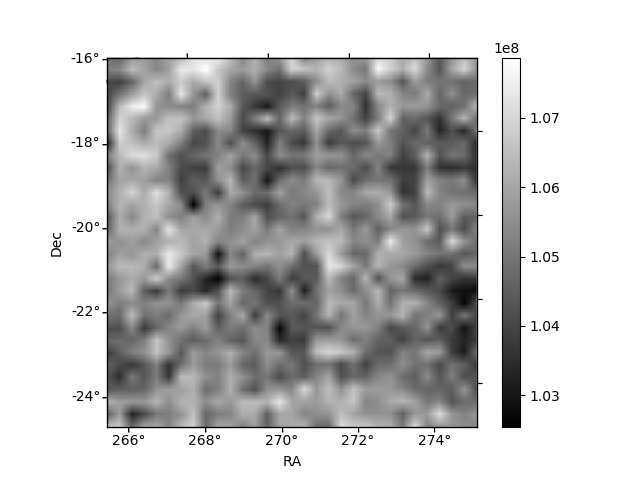
Histogram calculated using DETX and DETY for each event in the final _common_clean file
| Quadrant A | 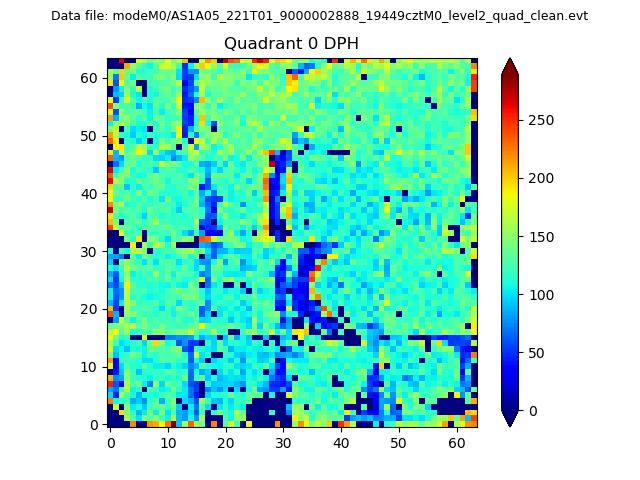 |
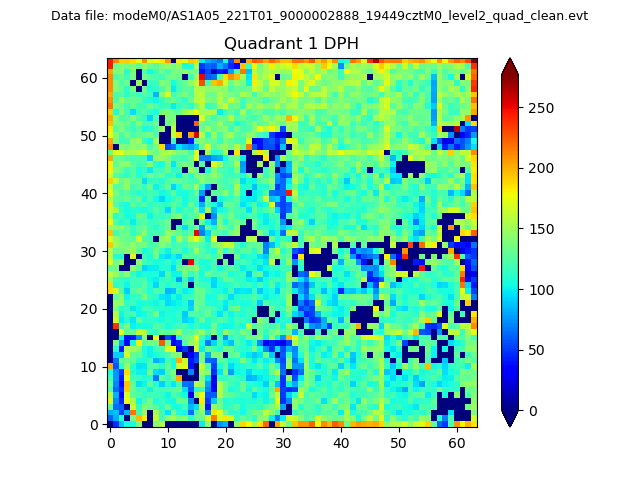 |
Quadrant B |
|---|---|---|---|
| Quadrant D | 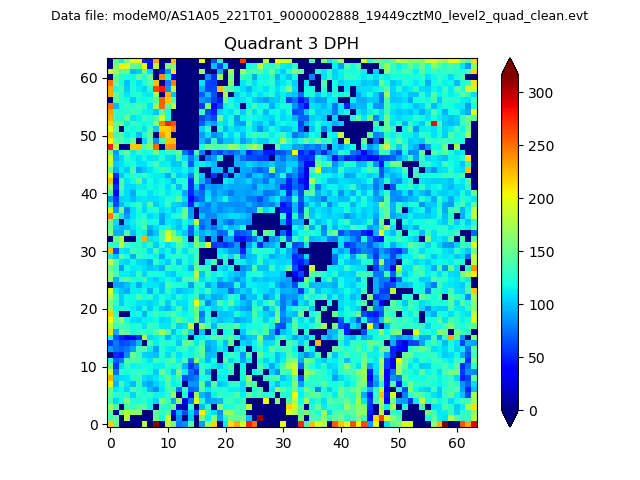 |
 |
Quadrant C |
| Plot type | Count rate plots | Images |
|---|---|---|
| Comparison with Poisson distribution Blue bars denote a histogram of data divided into 1 sec bins. Red curve is a Poisson curve with rate = median count rate of data. |
 |
 |
| Quadrant-wise count rates Data is divided into 100 sec bins |
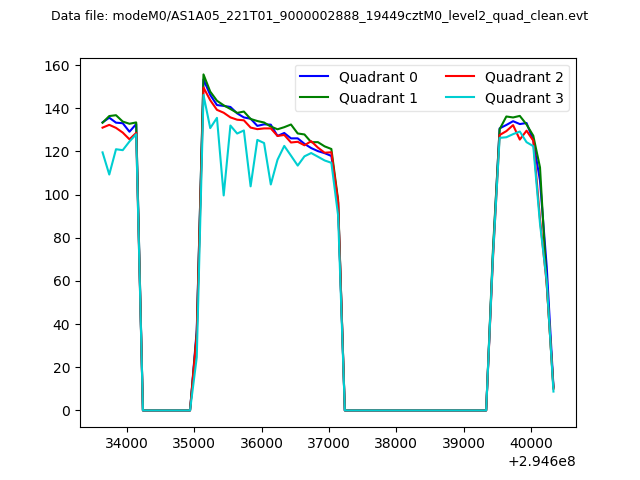 |
|
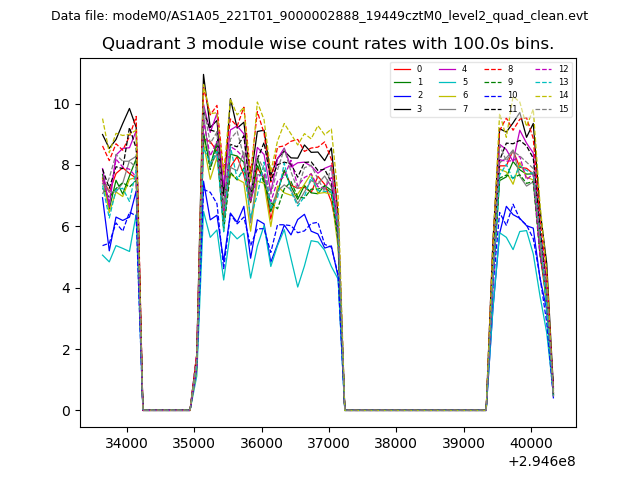
| Module-wise count rates for Quadrant A Data is divided into 100 sec bins |
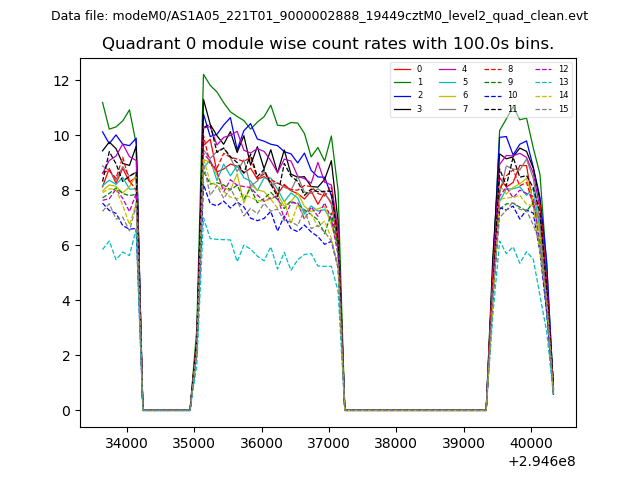 |
 |
| Module-wise count rates for Quadrant B Data is divided into 100 sec bins |
 |
 |
| Module-wise count rates for Quadrant C Data is divided into 100 sec bins |
 |
 |
| Module-wise count rates for Quadrant D Data is divided into 100 sec bins |
 |
 |
| Parameter | Plot |
|---|---|
| CZT HV Monitor |  |
| D_VDD | 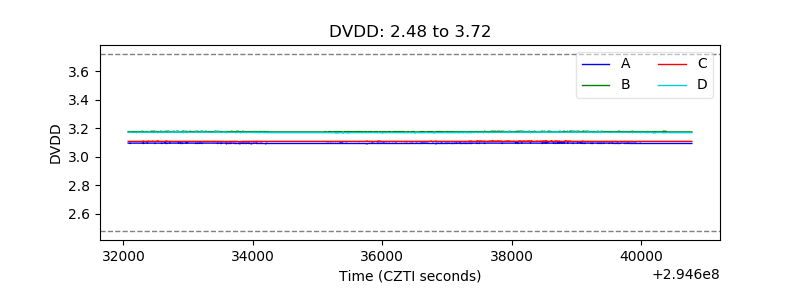 |
| Temperature 1 | 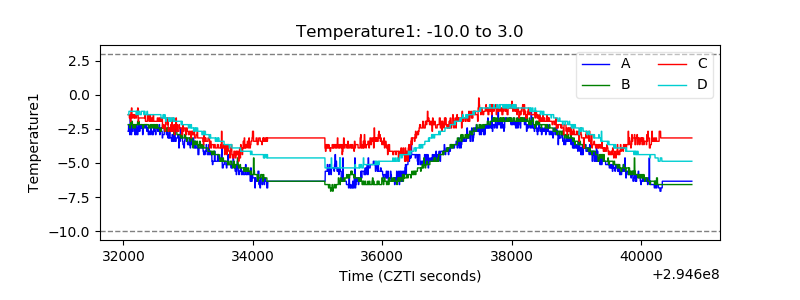 |
| Veto HV Monitor | 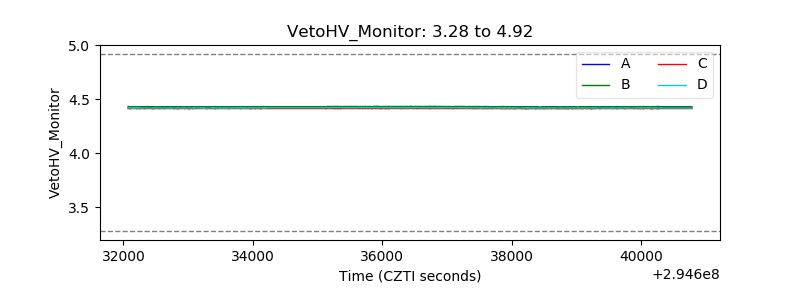 |
| Veto LLD | 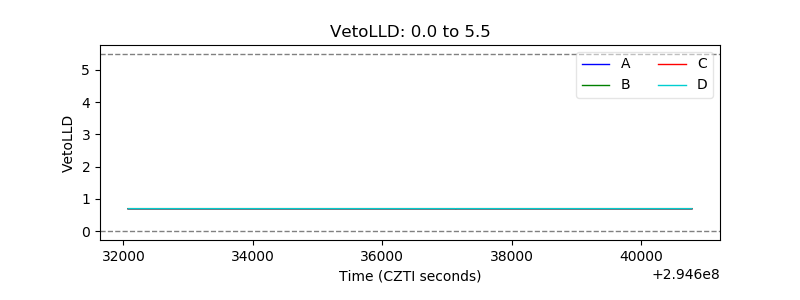 |
| Alpha Counter | 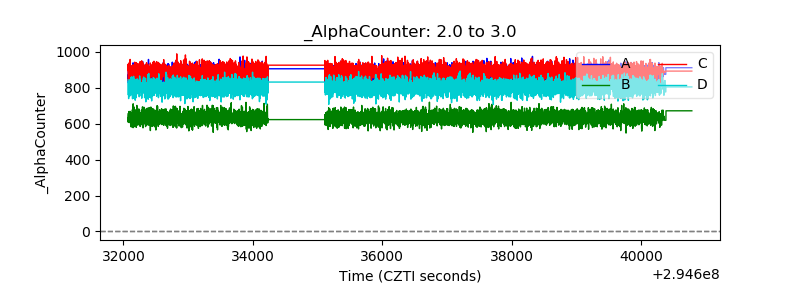 |
| _CPM_Rate | 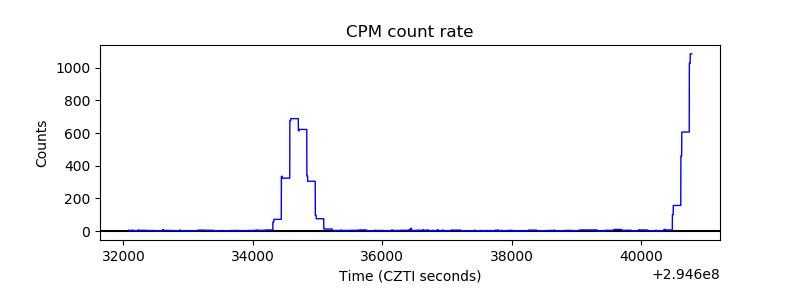 |
| CZT Counter | 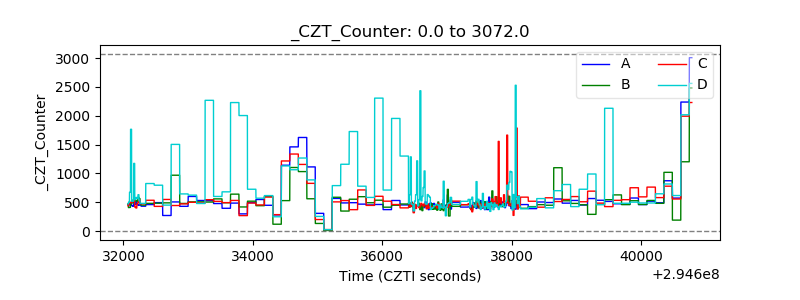 |
| +2.5 Volts monitor |  |
| +5 Volts monitor |  |
| _ROLL_ROT | 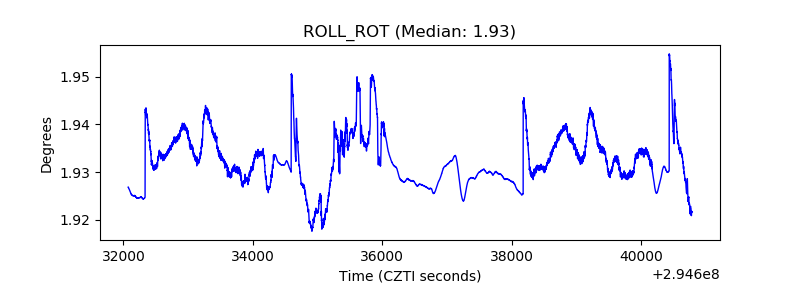 |
| _Roll_DEC | 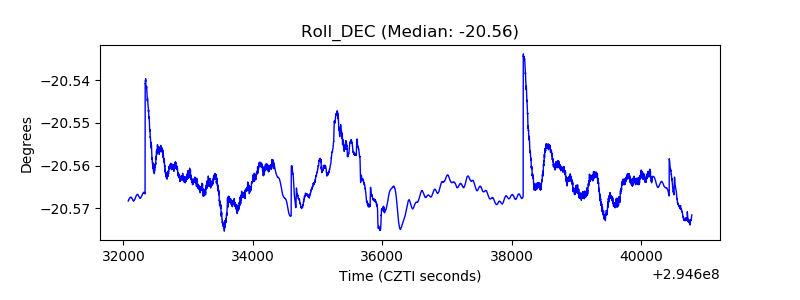 |
| _Roll_RA | 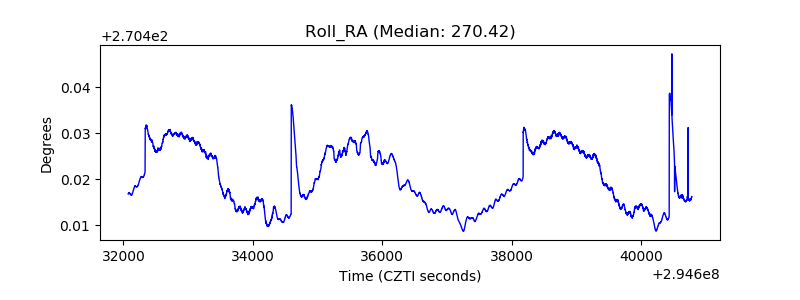 |
| Veto Counter | 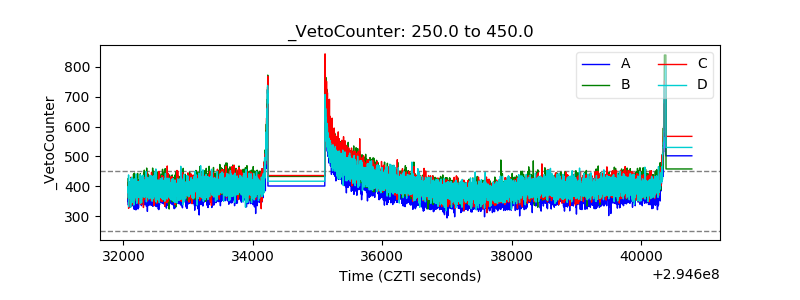 |