| Param | Original file | Final file |
|---|---|---|
| Filename | modeM0/AS1A05_221T01_9000002888_19451cztM0_level2.evt | modeM0/AS1A05_221T01_9000002888_19451cztM0_level2_quad_clean.evt |
| Size (bytes) | 2,132,729,280 | 346,965,120 |
| Size | 2.0 GB | 330.9 MB |
| Events in quadrant A | 13,638,102 | 2,179,163 |
| Events in quadrant B | 14,198,087 | 2,205,909 |
| Events in quadrant C | 13,974,843 | 2,141,535 |
| Events in quadrant D | 20,874,900 | 2,041,714 |
| Mode SS | |||
|---|---|---|---|
| Quadrant | BADHDUFLAG | Total packets | Discarded packets |
| A | 0 | 572 | 0 |
| B | 0 | 572 | 0 |
| C | 0 | 572 | 0 |
| D | 0 | 572 | 0 |
| Mode M9 | |||
|---|---|---|---|
| Quadrant | BADHDUFLAG | Total packets | Discarded packets |
| A | 0 | 44 | 0 |
| B | 0 | 44 | 0 |
| C | 0 | 44 | 0 |
| D | 0 | 44 | 0 |
| Mode M0 | |||
|---|---|---|---|
| Quadrant | BADHDUFLAG | Total packets | Discarded packets |
| A | 0 | 58195 | 5 |
| B | 0 | 59898 | 5 |
| C | 0 | 59075 | 5 |
| D | 0 | 80670 | 5 |
| Quadrant | Total seconds | Saturated seconds | Saturation percentage |
|---|---|---|---|
| A | 28231 | 148 | 0.524246% |
| B | 28231 | 253 | 0.896178% |
| C | 28231 | 284 | 1.005986% |
| D | 28232 | 1781 | 6.308444% |
Noise dominated data is calculated using 1-second bins in cleaned event files. If a bin has >2000 counts, and if more than 50% of those come from <1% of pixels, then it is considered to be noise-dominated and hence unusable.
| Quadrant | # 1 sec bins | Bins with >0 counts | Bins with >2000 counts | High rate bins dominated by noise | Noise dominated (total time) | Noise dominated (detector-on time) | Marked lightcurve |
|---|---|---|---|---|---|---|---|
| A | 32506 | 28233 | 15 | 15 | 0.05% | 0.05% | 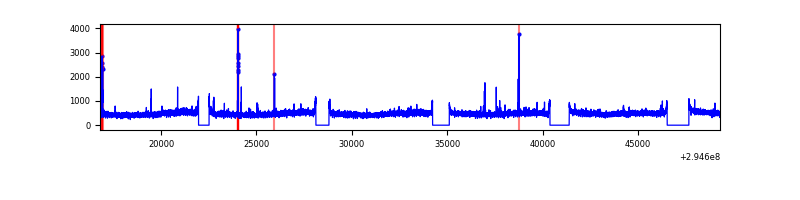 |
| B | 32506 | 28234 | 50 | 50 | 0.15% | 0.18% | 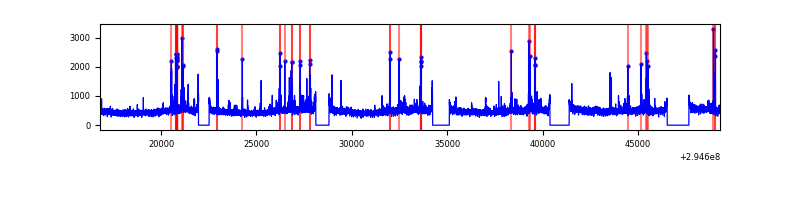 |
| C | 32506 | 28234 | 10 | 10 | 0.03% | 0.04% | 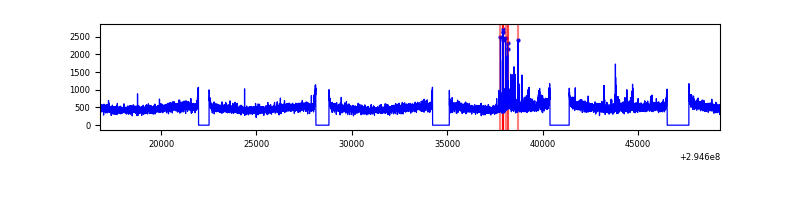 |
| D | 32507 | 28234 | 1496 | 1496 | 4.60% | 5.30% | 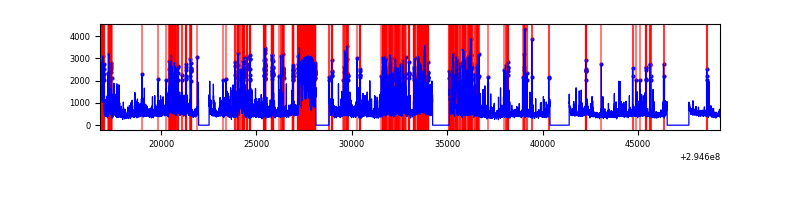 |
Top three noisy pixels from each quadrant. If the there are fewer than three noisy pixels in the level2.evt file, extra rows are filled as -1
| Pixel properties | Quadrant properties | ||||||
|---|---|---|---|---|---|---|---|
| Quadrant | DetID | PixID | Counts | Sigma | Mean | Median | Sigma |
| A | 11 | 29 | 138240 | 193.66 | 3465 | 3390 | 696.3 |
| A | 12 | 96 | 89755 | 124.03 | 3465 | 3390 | 696.3 |
| A | 3 | 1 | 39796 | 52.28 | 3465 | 3390 | 696.3 |
| B | 7 | 220 | 260883 | 397.04 | 3435 | 3353 | 648.6 |
| B | 0 | 198 | 117808 | 176.46 | 3435 | 3353 | 648.6 |
| B | 0 | 197 | 99734 | 148.59 | 3435 | 3353 | 648.6 |
| C | 14 | 238 | 516129 | 662.29 | 3326 | 3356 | 774.2 |
| C | 9 | 221 | 353902 | 452.76 | 3326 | 3356 | 774.2 |
| C | 0 | 207 | 116122 | 145.65 | 3326 | 3356 | 774.2 |
| D | 7 | 238 | 6618773 | 8164.27 | 3313 | 3216 | 810.3 |
| D | 1 | 52 | 1199863 | 1476.78 | 3313 | 3216 | 810.3 |
| D | 5 | 222 | 249742 | 304.24 | 3313 | 3216 | 810.3 |
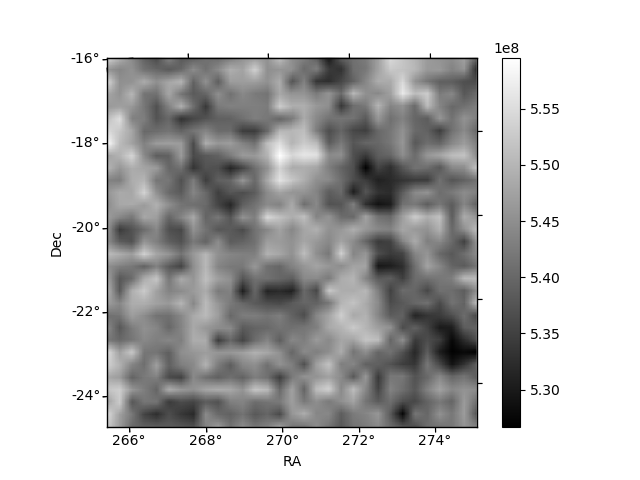
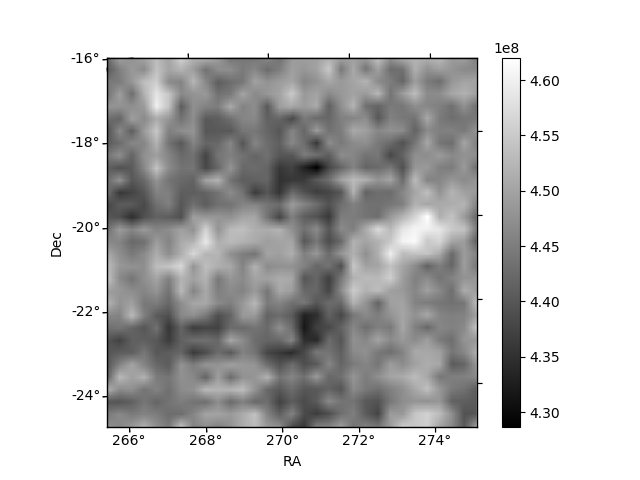
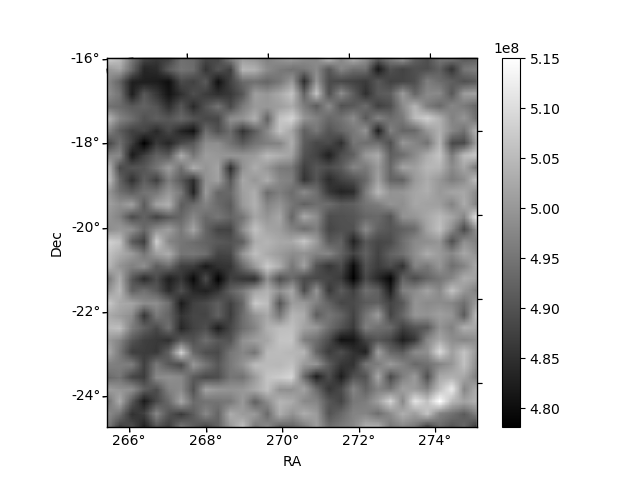
Histogram calculated using DETX and DETY for each event in the final _common_clean file
| Quadrant A | 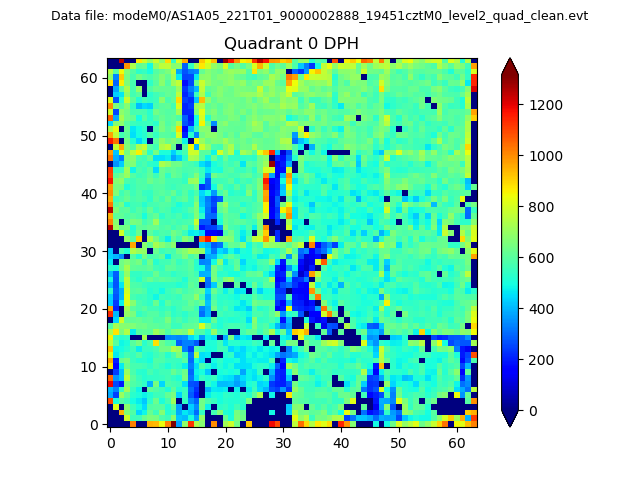 |
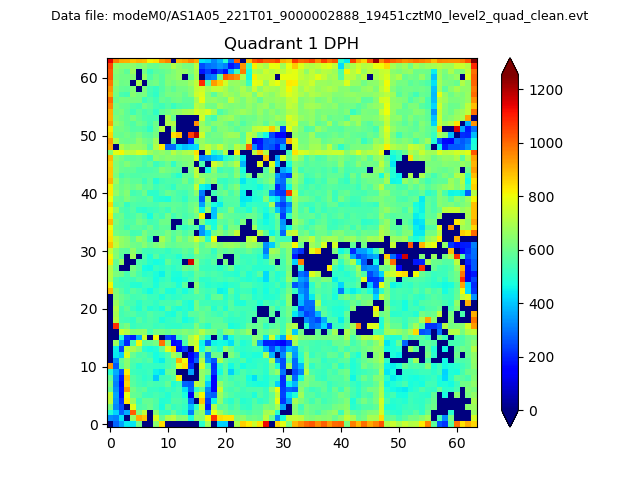 |
Quadrant B |
|---|---|---|---|
| Quadrant D | 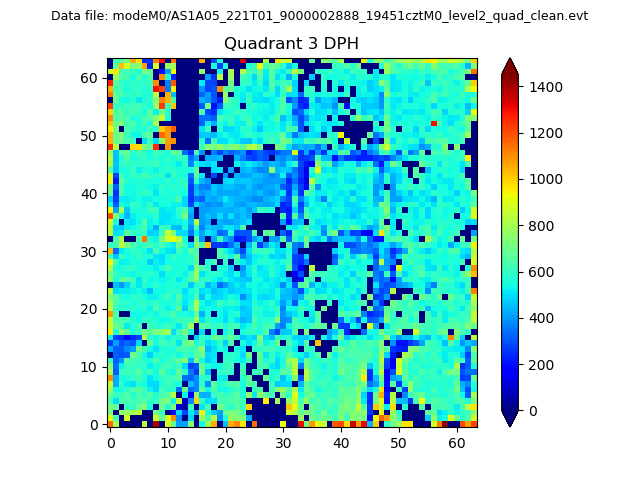 |
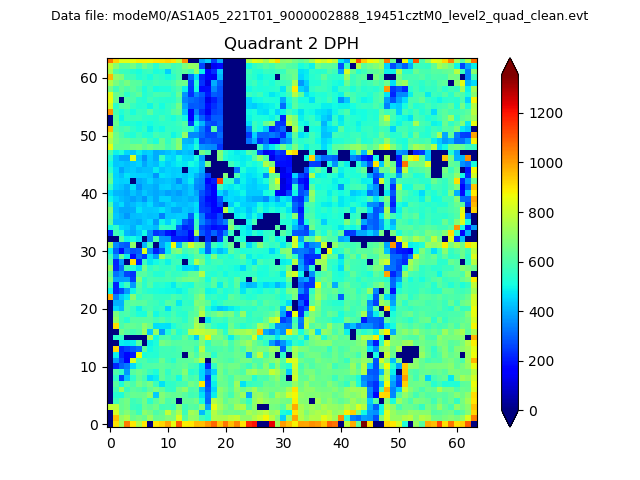 |
Quadrant C |
| Plot type | Count rate plots | Images |
|---|---|---|
| Comparison with Poisson distribution Blue bars denote a histogram of data divided into 1 sec bins. Red curve is a Poisson curve with rate = median count rate of data. |
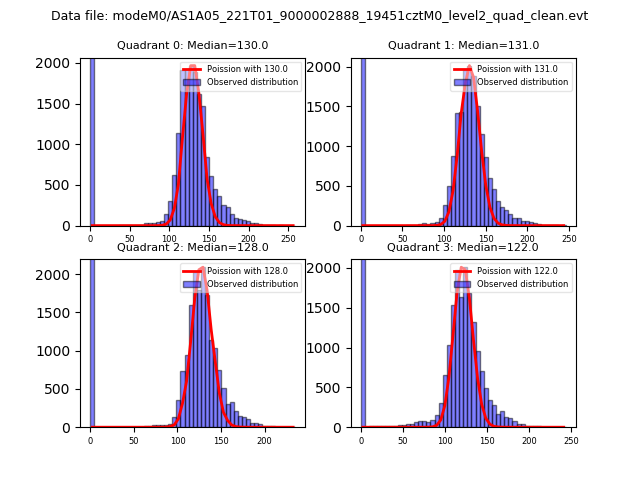 |
 |
| Quadrant-wise count rates Data is divided into 100 sec bins |
 |
|
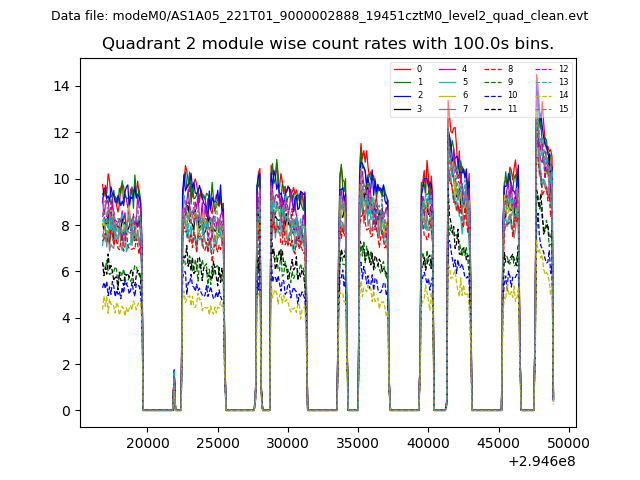
| Module-wise count rates for Quadrant A Data is divided into 100 sec bins |
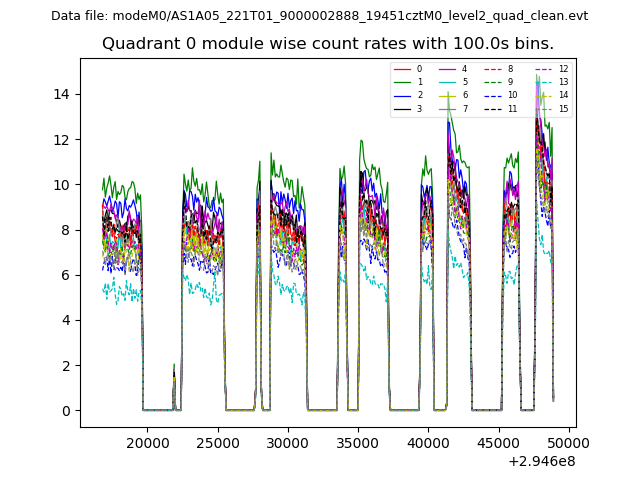 |
 |
| Module-wise count rates for Quadrant B Data is divided into 100 sec bins |
 |
 |
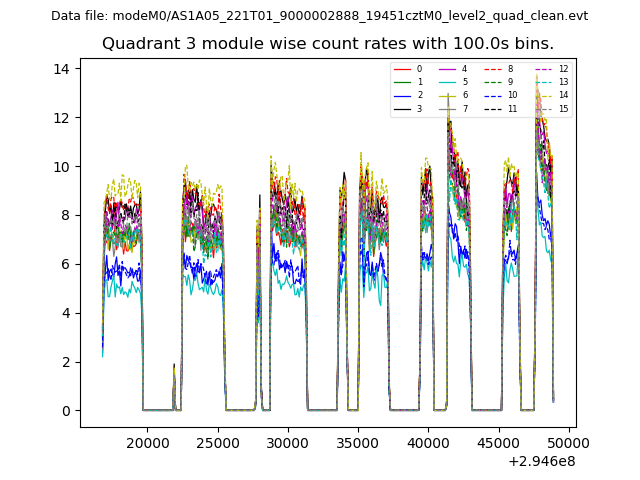
| Module-wise count rates for Quadrant C Data is divided into 100 sec bins |
 |
 |
| Module-wise count rates for Quadrant D Data is divided into 100 sec bins |
 |
 |
| Parameter | Plot |
|---|---|
| CZT HV Monitor | 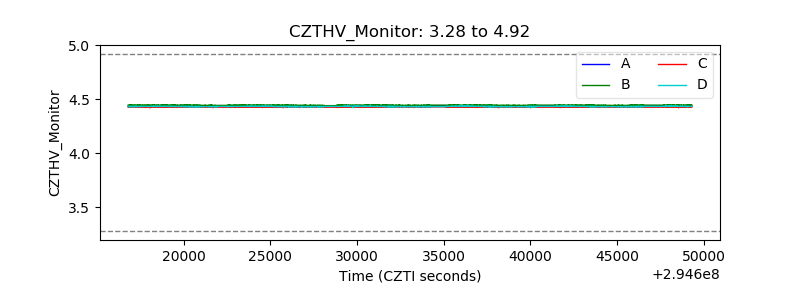 |
| D_VDD | 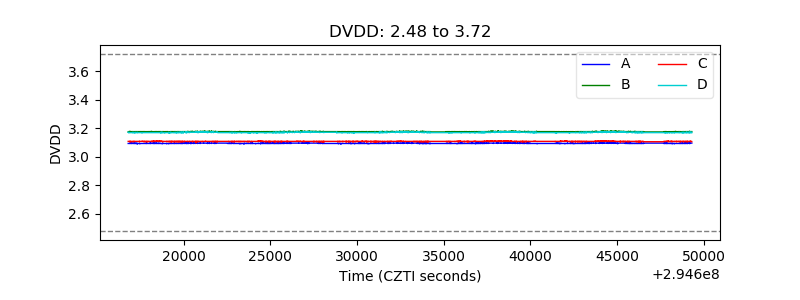 |
| Temperature 1 | 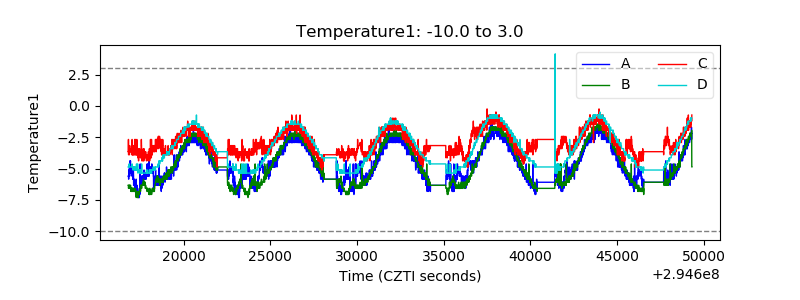 |
| Veto HV Monitor | 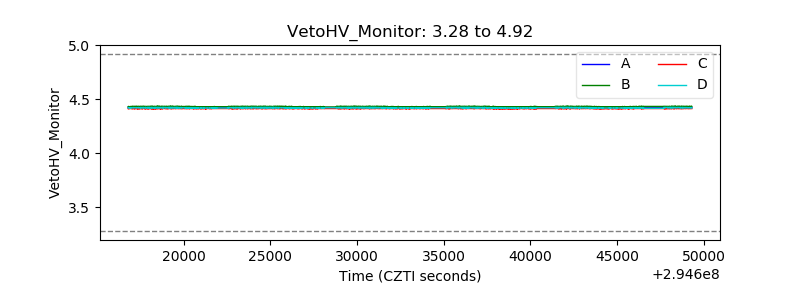 |
| Veto LLD | 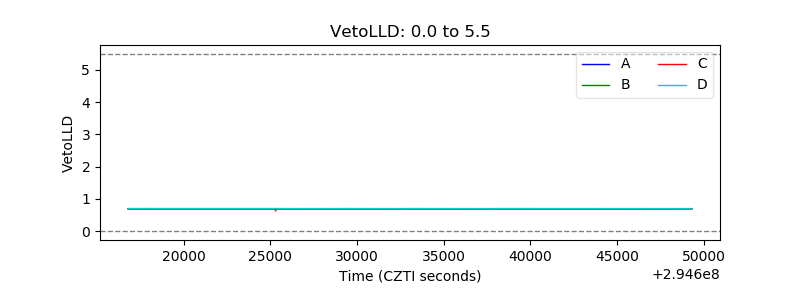 |
| Alpha Counter |  |
| _CPM_Rate |  |
| CZT Counter | 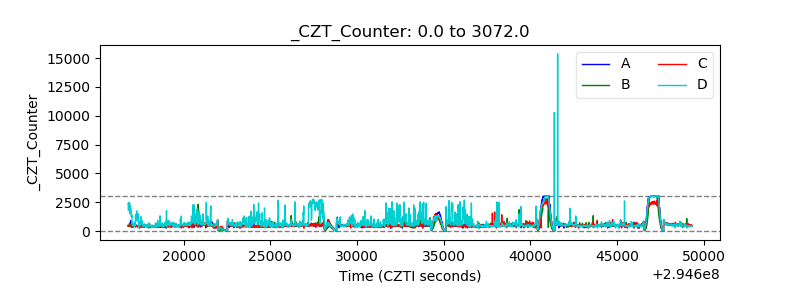 |
| +2.5 Volts monitor |  |
| +5 Volts monitor |  |
| _ROLL_ROT | 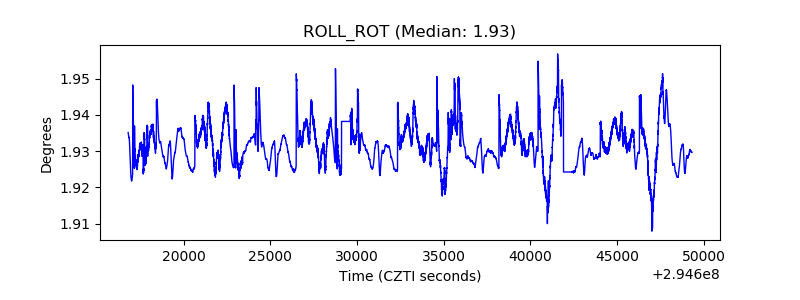 |
| _Roll_DEC | 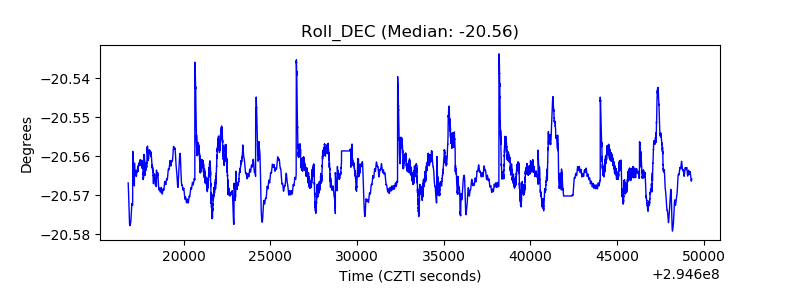 |
| _Roll_RA | 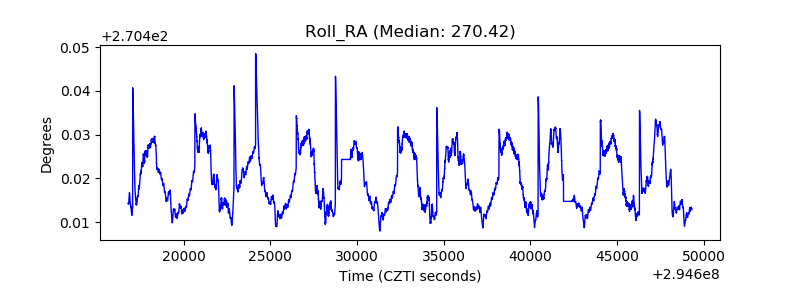 |
| Veto Counter | 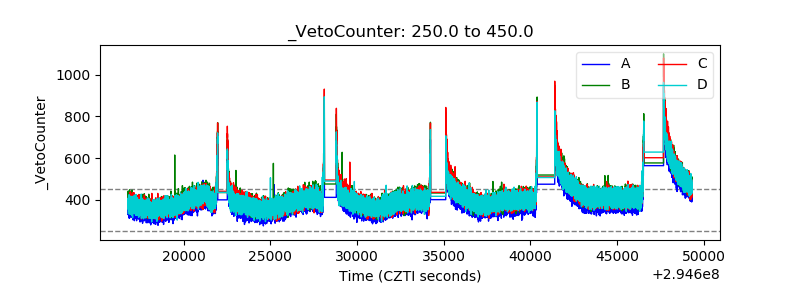 |