| Param | Original file | Final file |
|---|---|---|
| Filename | modeM0/AS1A05_221T01_9000002888_19453cztM0_level2.evt | modeM0/AS1A05_221T01_9000002888_19453cztM0_level2_quad_clean.evt |
| Size (bytes) | 494,052,480 | 81,031,680 |
| Size | 471.2 MB | 77.3 MB |
| Events in quadrant A | 3,597,908 | 512,505 |
| Events in quadrant B | 3,775,552 | 513,218 |
| Events in quadrant C | 3,609,084 | 486,935 |
| Events in quadrant D | 3,536,180 | 485,209 |
| Mode SS | |||
|---|---|---|---|
| Quadrant | BADHDUFLAG | Total packets | Discarded packets |
| A | 0 | 134 | 0 |
| B | 0 | 134 | 0 |
| C | 0 | 134 | 0 |
| D | 0 | 134 | 0 |
| Mode M9 | |||
|---|---|---|---|
| Quadrant | BADHDUFLAG | Total packets | Discarded packets |
| A | 0 | 13 | 0 |
| B | 0 | 14 | 0 |
| C | 0 | 14 | 0 |
| D | 0 | 14 | 0 |
| Mode M0 | |||
|---|---|---|---|
| Quadrant | BADHDUFLAG | Total packets | Discarded packets |
| A | 0 | 14551 | 2 |
| B | 0 | 15209 | 2 |
| C | 0 | 14571 | 3 |
| D | 0 | 14426 | 2 |
| Quadrant | Total seconds | Saturated seconds | Saturation percentage |
|---|---|---|---|
| A | 6533 | 98 | 1.500077% |
| B | 6533 | 144 | 2.204194% |
| C | 6532 | 142 | 2.173913% |
| D | 6532 | 89 | 1.362523% |
Noise dominated data is calculated using 1-second bins in cleaned event files. If a bin has >2000 counts, and if more than 50% of those come from <1% of pixels, then it is considered to be noise-dominated and hence unusable.
| Quadrant | # 1 sec bins | Bins with >0 counts | Bins with >2000 counts | High rate bins dominated by noise | Noise dominated (total time) | Noise dominated (detector-on time) | Marked lightcurve |
|---|---|---|---|---|---|---|---|
| A | 7793 | 6533 | 0 | 0 | 0.00% | 0.00% | 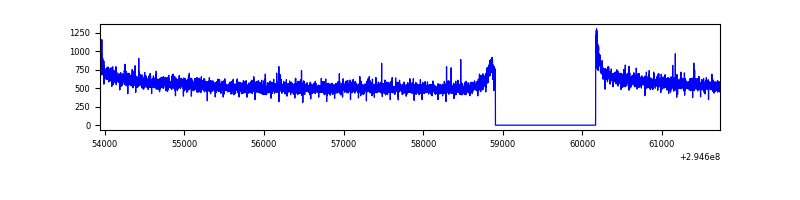 |
| B | 7793 | 6533 | 24 | 24 | 0.31% | 0.37% | 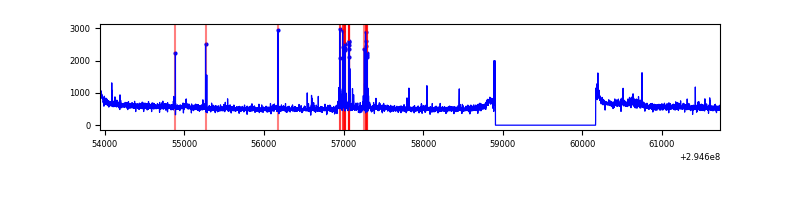 |
| C | 7792 | 6532 | 5 | 5 | 0.06% | 0.08% | 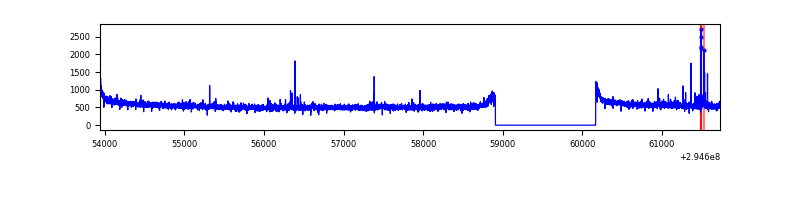 |
| D | 7792 | 6532 | 19 | 19 | 0.24% | 0.29% | 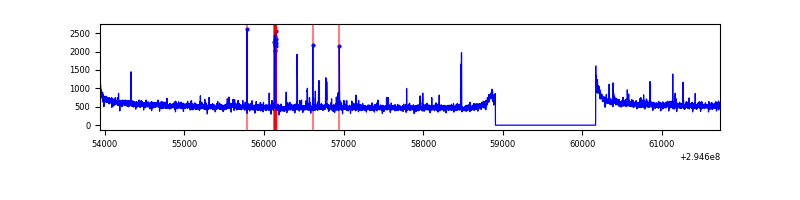 |
Top three noisy pixels from each quadrant. If the there are fewer than three noisy pixels in the level2.evt file, extra rows are filled as -1
| Pixel properties | Quadrant properties | ||||||
|---|---|---|---|---|---|---|---|
| Quadrant | DetID | PixID | Counts | Sigma | Mean | Median | Sigma |
| A | 11 | 29 | 27349 | 143.24 | 925 | 908 | 184.6 |
| A | 13 | 254 | 9088 | 44.31 | 925 | 908 | 184.6 |
| A | 3 | 1 | 8531 | 41.3 | 925 | 908 | 184.6 |
| B | 7 | 220 | 95852 | 566.5 | 901 | 882 | 167.6 |
| B | 0 | 198 | 59427 | 349.22 | 901 | 882 | 167.6 |
| B | 0 | 230 | 29766 | 172.3 | 901 | 882 | 167.6 |
| C | 14 | 238 | 138411 | 688.11 | 866 | 875 | 199.9 |
| C | 9 | 221 | 42475 | 208.13 | 866 | 875 | 199.9 |
| C | 0 | 207 | 41475 | 203.13 | 866 | 875 | 199.9 |
| D | 1 | 52 | 127994 | 582.4 | 898 | 874 | 218.3 |
| D | 2 | 234 | 27716 | 122.98 | 898 | 874 | 218.3 |
| D | 14 | 226 | 8646 | 35.61 | 898 | 874 | 218.3 |
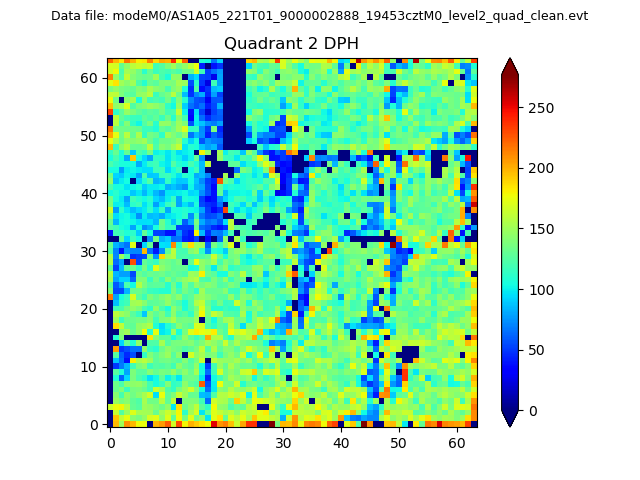
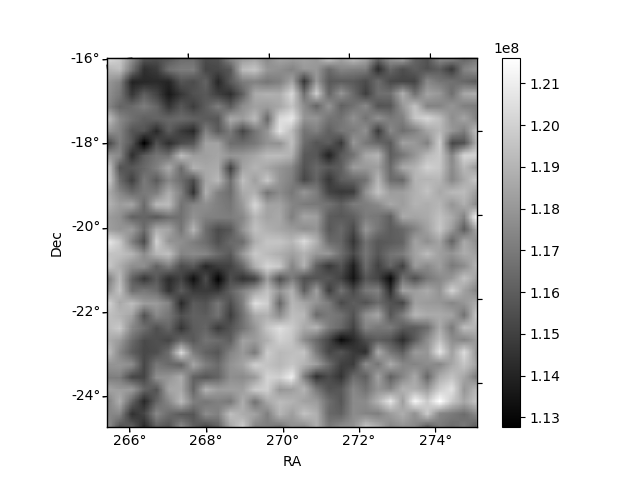
Histogram calculated using DETX and DETY for each event in the final _common_clean file
| Quadrant A |  |
 |
Quadrant B |
|---|---|---|---|
| Quadrant D | 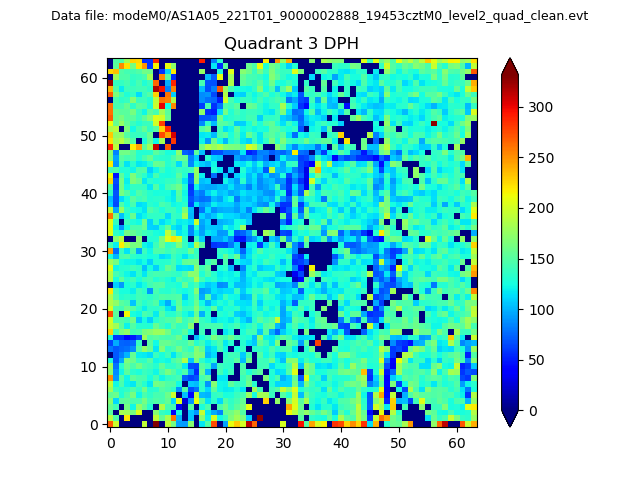 |
 |
Quadrant C |
| Plot type | Count rate plots | Images |
|---|---|---|
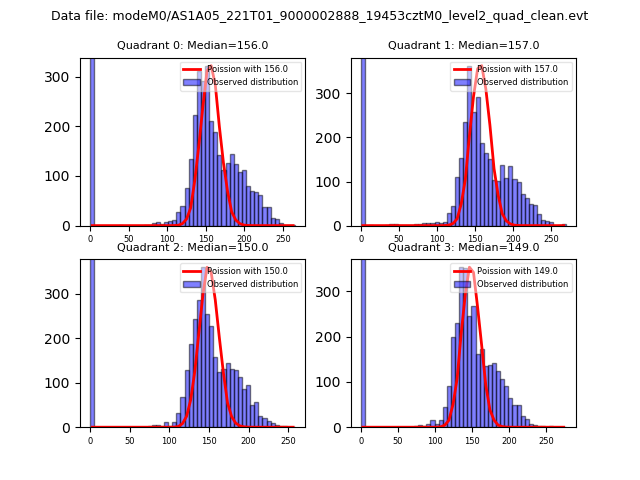
| Comparison with Poisson distribution Blue bars denote a histogram of data divided into 1 sec bins. Red curve is a Poisson curve with rate = median count rate of data. |
 |
 |
| Quadrant-wise count rates Data is divided into 100 sec bins |
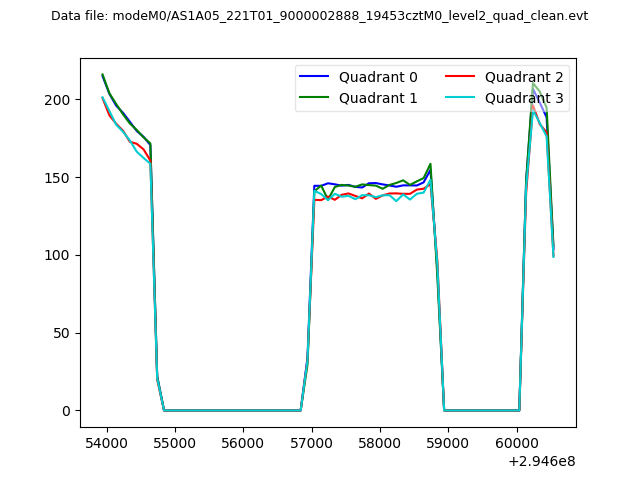 |
|
| Module-wise count rates for Quadrant A Data is divided into 100 sec bins |
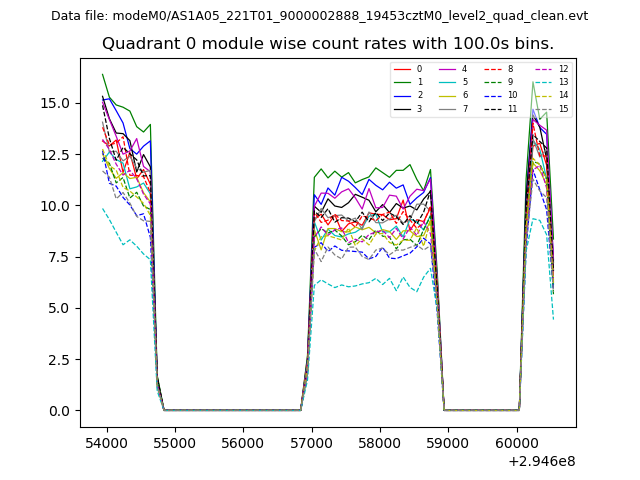 |
 |
| Module-wise count rates for Quadrant B Data is divided into 100 sec bins |
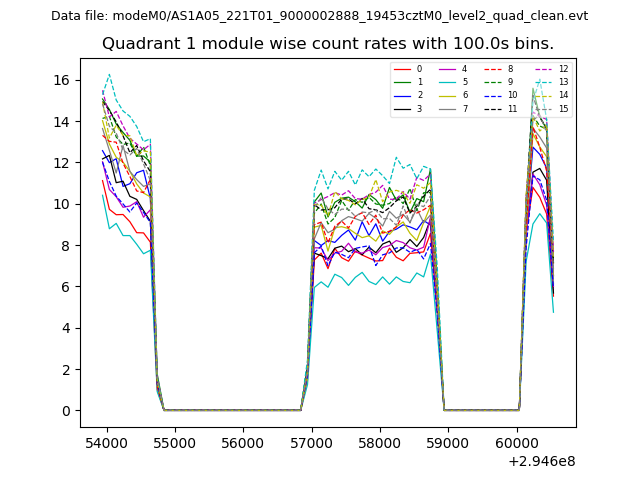 |
 |
| Module-wise count rates for Quadrant C Data is divided into 100 sec bins |
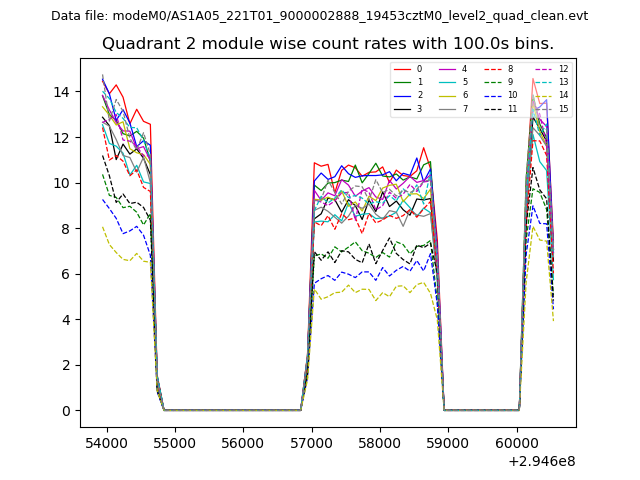 |
 |
| Module-wise count rates for Quadrant D Data is divided into 100 sec bins |
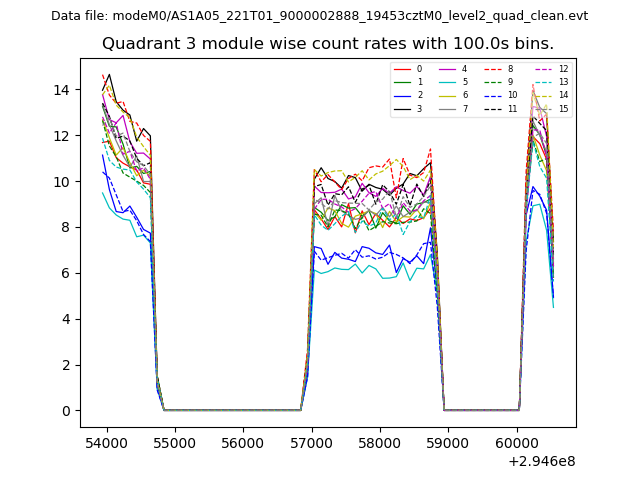 |
 |
| Parameter | Plot |
|---|---|
| CZT HV Monitor | 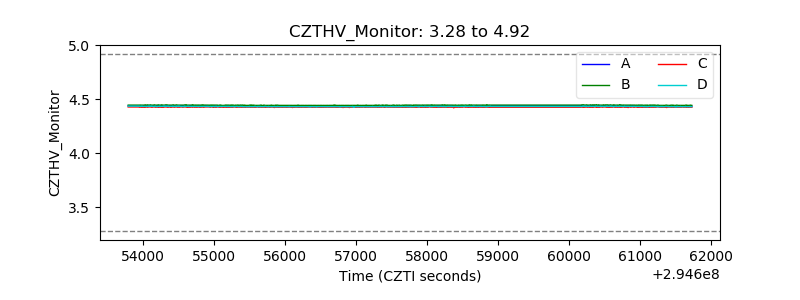 |
| D_VDD | 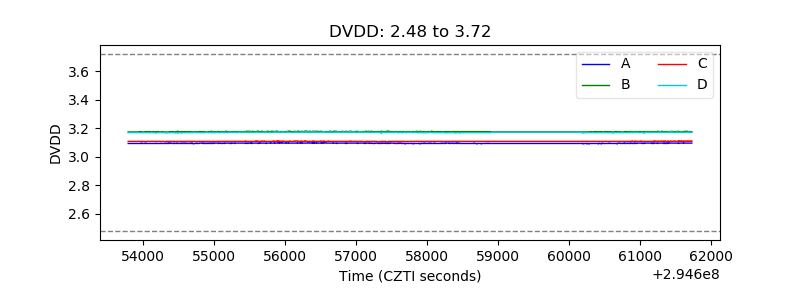 |
| Temperature 1 | 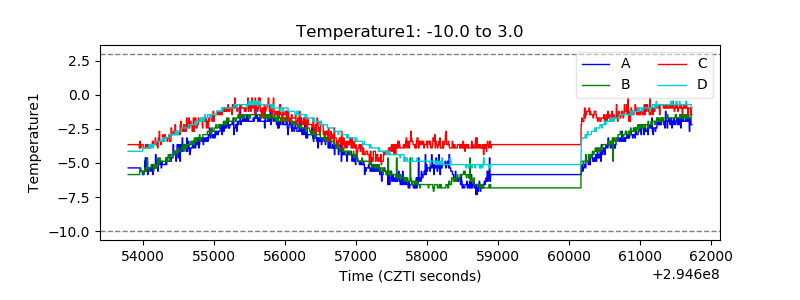 |
| Veto HV Monitor |  |
| Veto LLD | 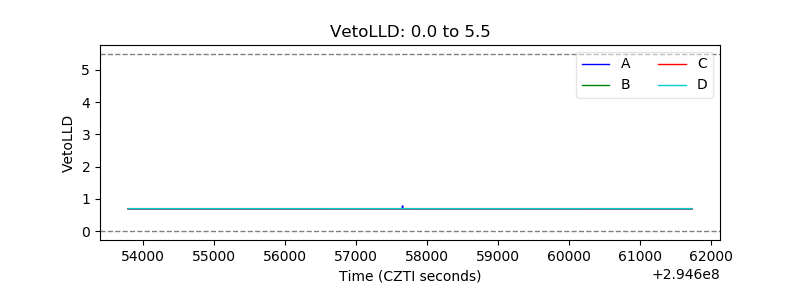 |
| Alpha Counter | 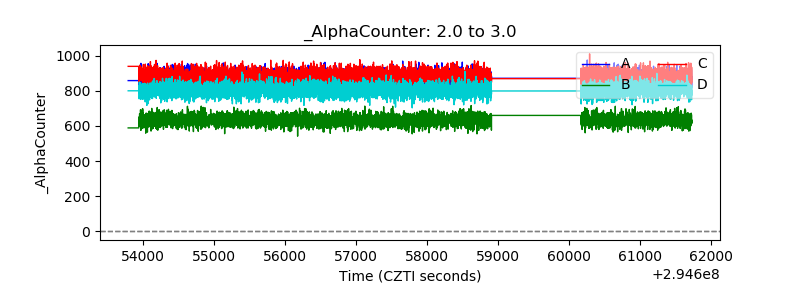 |
| _CPM_Rate |  |
| CZT Counter | 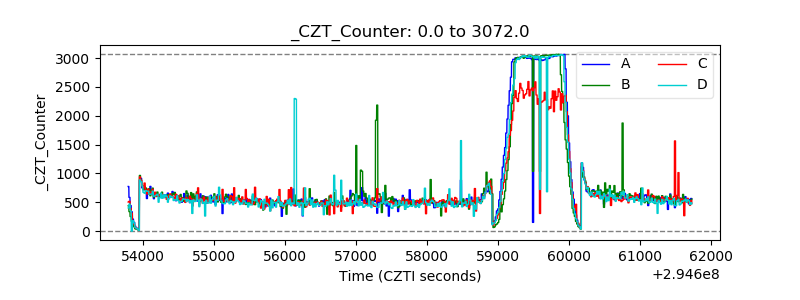 |
| +2.5 Volts monitor |  |
| +5 Volts monitor |  |
| _ROLL_ROT |  |
| _Roll_DEC | 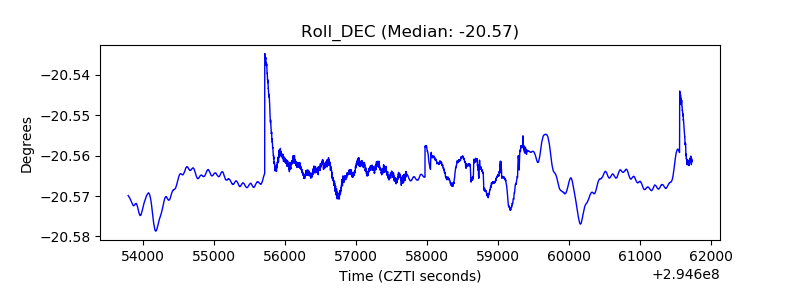 |
| _Roll_RA | 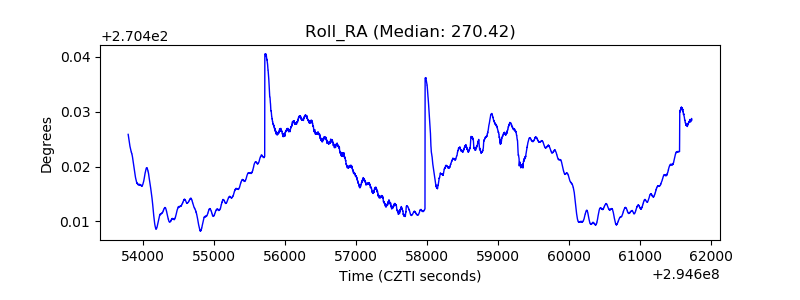 |
| Veto Counter | 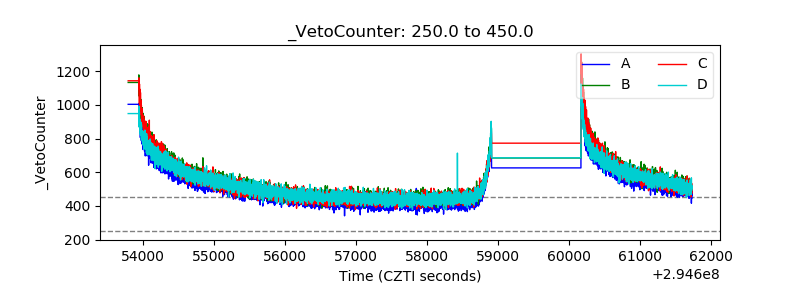 |