| Param | Original file | Final file |
|---|---|---|
| Filename | modeM0/AS1A05_221T01_9000002888_19454cztM0_level2.evt | modeM0/AS1A05_221T01_9000002888_19454cztM0_level2_quad_clean.evt |
| Size (bytes) | 284,437,440 | 40,435,200 |
| Size | 271.3 MB | 38.6 MB |
| Events in quadrant A | 2,099,274 | 245,583 |
| Events in quadrant B | 2,173,110 | 245,732 |
| Events in quadrant C | 2,084,129 | 232,646 |
| Events in quadrant D | 1,998,251 | 231,462 |
| Mode SS | |||
|---|---|---|---|
| Quadrant | BADHDUFLAG | Total packets | Discarded packets |
| A | 0 | 76 | 0 |
| B | 0 | 76 | 0 |
| C | 0 | 76 | 0 |
| D | 0 | 76 | 0 |
| Mode M9 | |||
|---|---|---|---|
| Quadrant | BADHDUFLAG | Total packets | Discarded packets |
| A | 0 | 3 | 0 |
| B | 0 | 4 | 0 |
| C | 0 | 4 | 0 |
| D | 0 | 4 | 0 |
| Mode M0 | |||
|---|---|---|---|
| Quadrant | BADHDUFLAG | Total packets | Discarded packets |
| A | 0 | 8484 | 1 |
| B | 0 | 8759 | 1 |
| C | 0 | 8473 | 1 |
| D | 0 | 8238 | 1 |
| Quadrant | Total seconds | Saturated seconds | Saturation percentage |
|---|---|---|---|
| A | 3800 | 27 | 0.710526% |
| B | 3800 | 59 | 1.552632% |
| C | 3800 | 69 | 1.815789% |
| D | 3800 | 14 | 0.368421% |
Noise dominated data is calculated using 1-second bins in cleaned event files. If a bin has >2000 counts, and if more than 50% of those come from <1% of pixels, then it is considered to be noise-dominated and hence unusable.
| Quadrant | # 1 sec bins | Bins with >0 counts | Bins with >2000 counts | High rate bins dominated by noise | Noise dominated (total time) | Noise dominated (detector-on time) | Marked lightcurve |
|---|---|---|---|---|---|---|---|
| A | 3800 | 3800 | 4 | 4 | 0.11% | 0.11% | 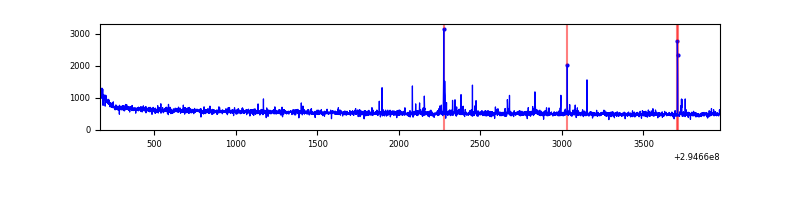 |
| B | 3800 | 3800 | 18 | 18 | 0.47% | 0.47% | 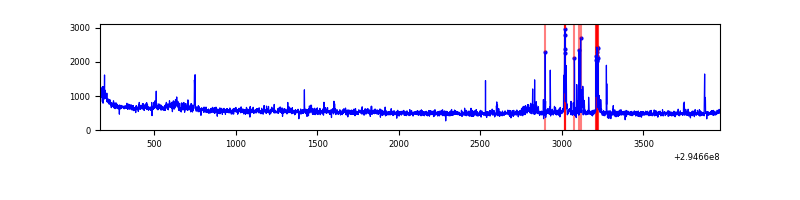 |
| C | 3800 | 3800 | 13 | 13 | 0.34% | 0.34% | 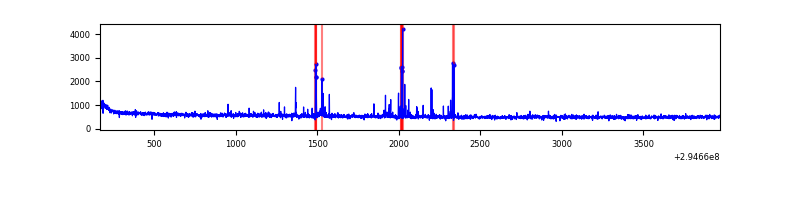 |
| D | 3800 | 3800 | 0 | 0 | 0.00% | 0.00% | 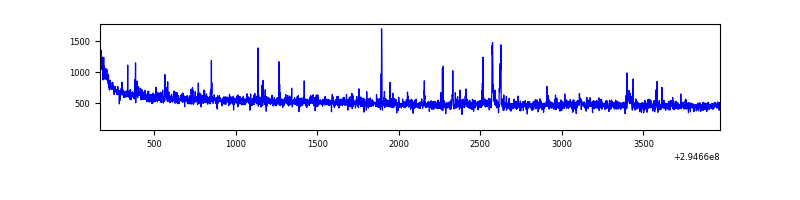 |
Top three noisy pixels from each quadrant. If the there are fewer than three noisy pixels in the level2.evt file, extra rows are filled as -1
| Pixel properties | Quadrant properties | ||||||
|---|---|---|---|---|---|---|---|
| Quadrant | DetID | PixID | Counts | Sigma | Mean | Median | Sigma |
| A | 4 | 2 | 54378 | 509.8 | 527 | 519 | 105.6 |
| A | 3 | 1 | 9277 | 82.9 | 527 | 519 | 105.6 |
| A | 13 | 254 | 5306 | 45.31 | 527 | 519 | 105.6 |
| B | 7 | 220 | 54710 | 550.97 | 517 | 505 | 98.4 |
| B | 3 | 64 | 33385 | 334.21 | 517 | 505 | 98.4 |
| B | 0 | 198 | 28166 | 281.16 | 517 | 505 | 98.4 |
| C | 0 | 207 | 85787 | 746.68 | 490 | 497 | 114.2 |
| C | 14 | 238 | 79602 | 692.53 | 490 | 497 | 114.2 |
| C | 9 | 221 | 6222 | 50.12 | 490 | 497 | 114.2 |
| D | 1 | 52 | 31448 | 249.9 | 509 | 496 | 123.9 |
| D | 9 | 1 | 20233 | 159.35 | 509 | 496 | 123.9 |
| D | 2 | 234 | 17644 | 138.45 | 509 | 496 | 123.9 |
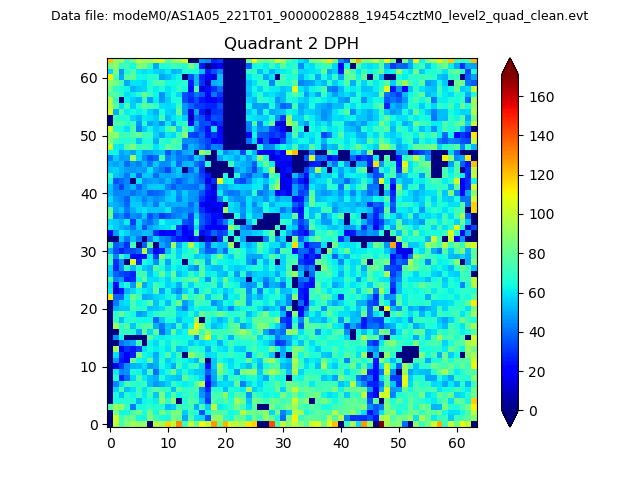
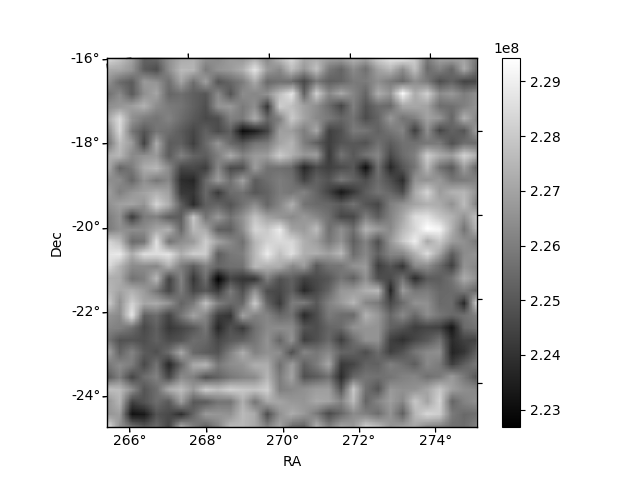
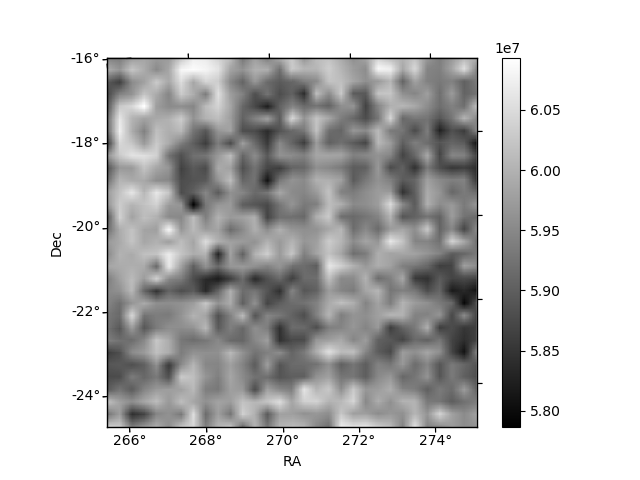
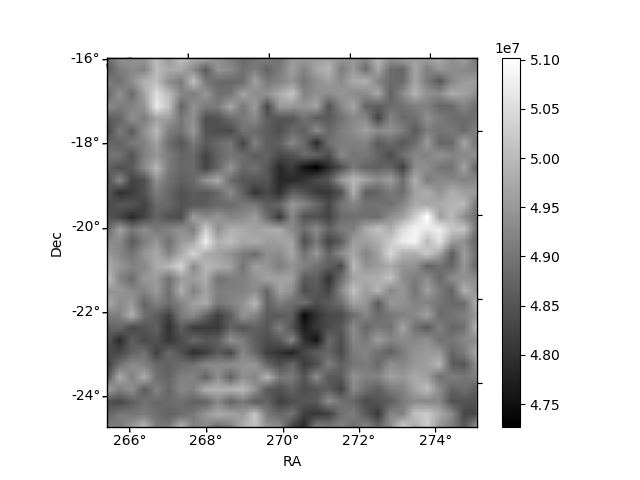
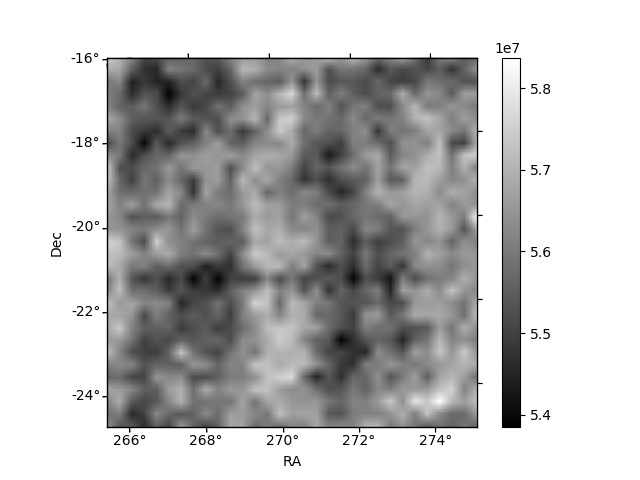
Histogram calculated using DETX and DETY for each event in the final _common_clean file
| Quadrant A | 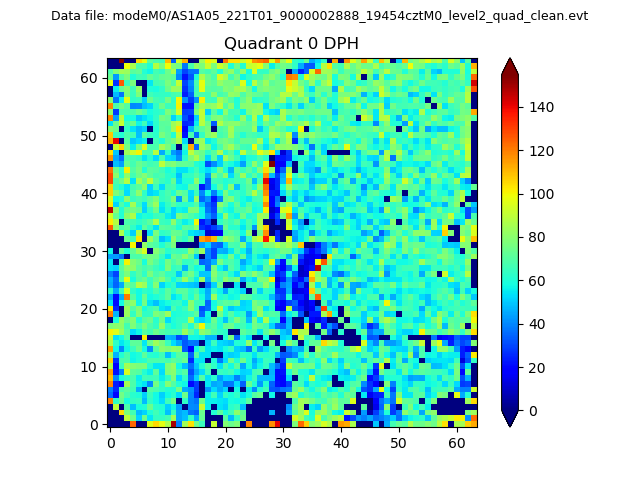 |
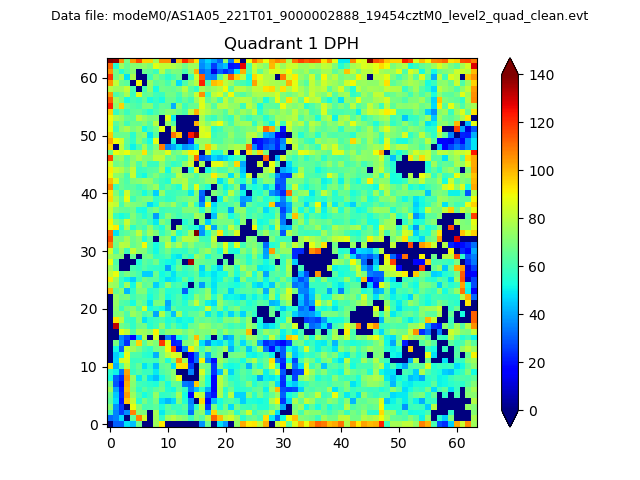 |
Quadrant B |
|---|---|---|---|
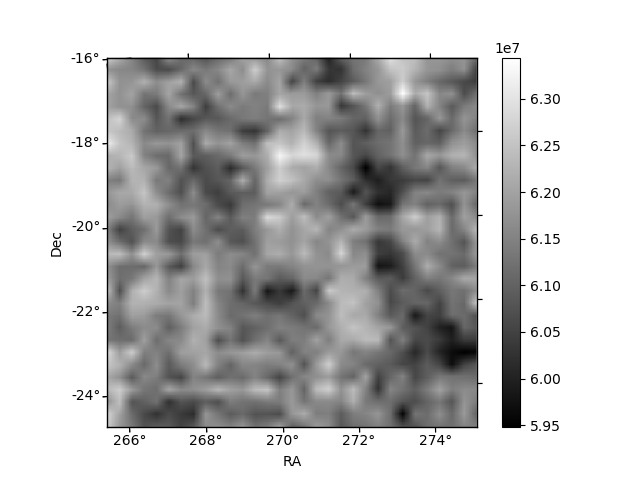
| Quadrant D | 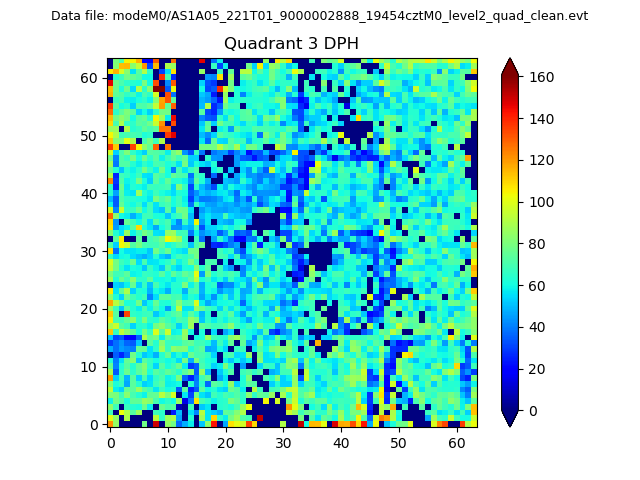 |
 |
Quadrant C |
| Plot type | Count rate plots | Images |
|---|---|---|
| Comparison with Poisson distribution Blue bars denote a histogram of data divided into 1 sec bins. Red curve is a Poisson curve with rate = median count rate of data. |
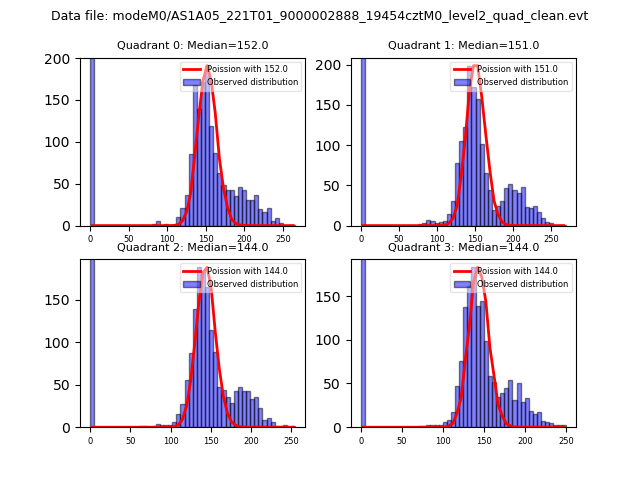 |
 |
| Quadrant-wise count rates Data is divided into 100 sec bins |
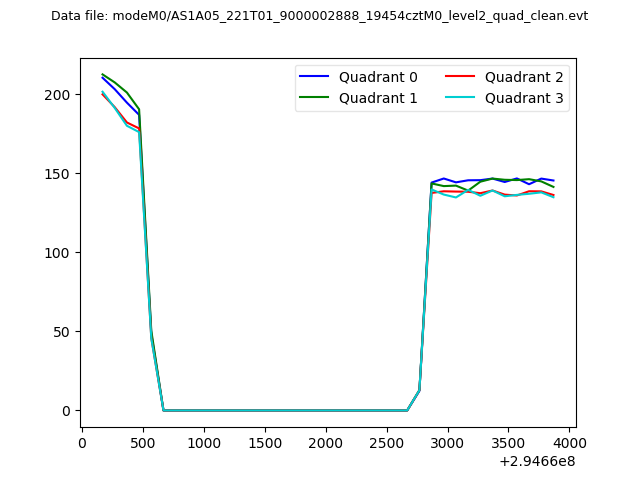 |
|
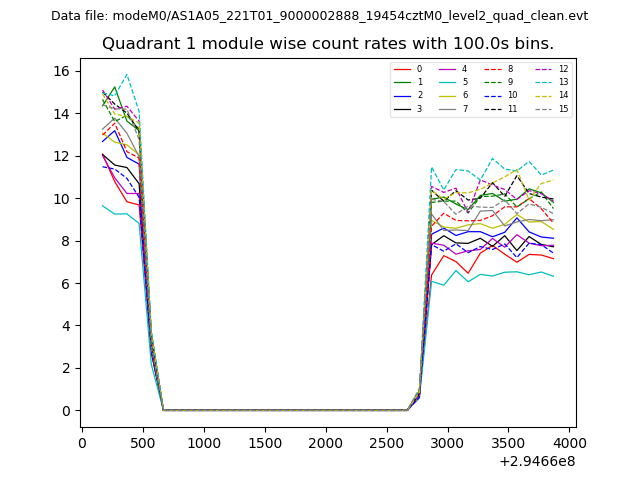
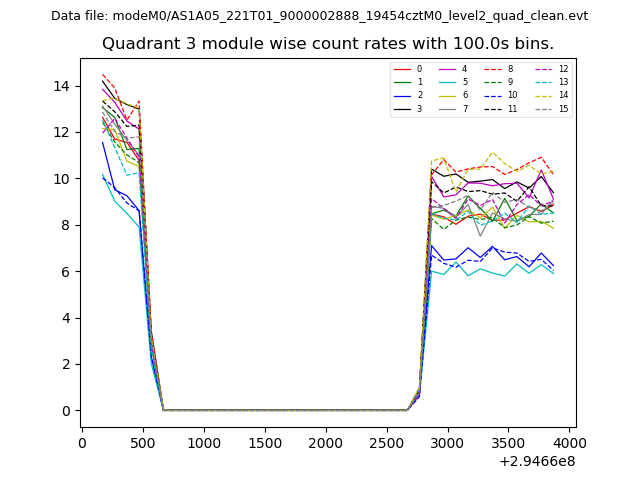
| Module-wise count rates for Quadrant A Data is divided into 100 sec bins |
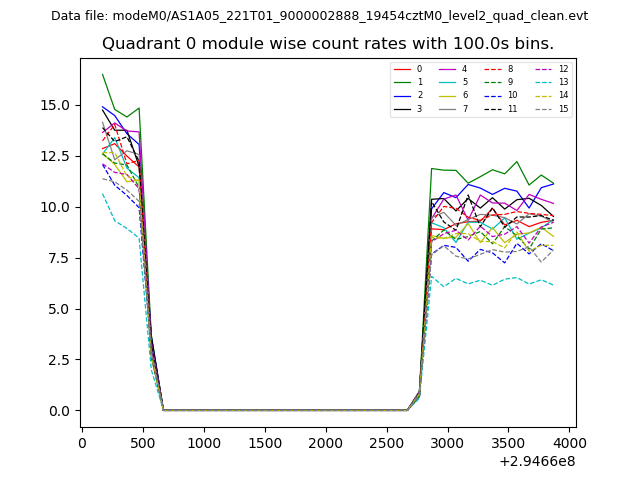 |
 |
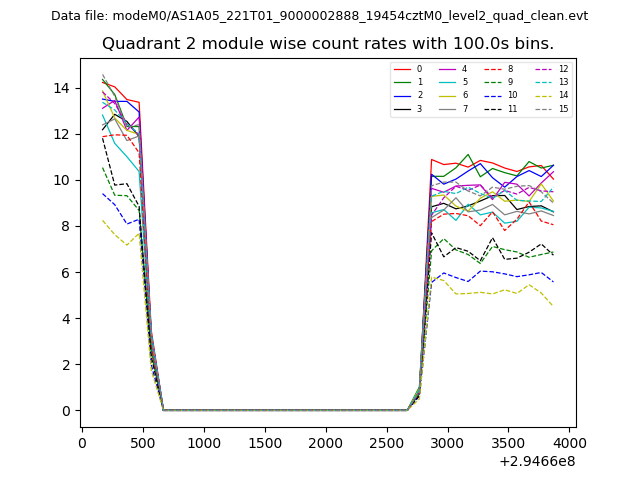
| Module-wise count rates for Quadrant B Data is divided into 100 sec bins |
 |
 |
| Module-wise count rates for Quadrant C Data is divided into 100 sec bins |
 |
 |
| Module-wise count rates for Quadrant D Data is divided into 100 sec bins |
 |
 |
| Parameter | Plot |
|---|---|
| CZT HV Monitor | 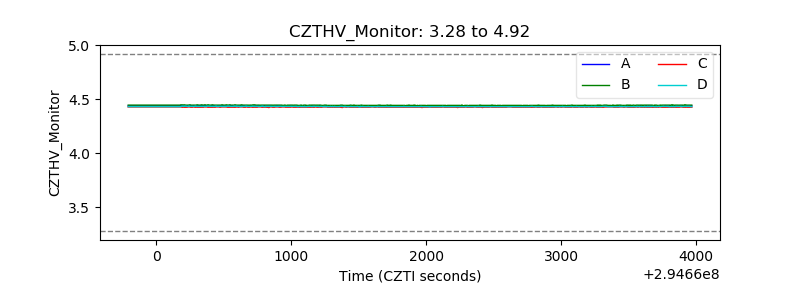 |
| D_VDD | 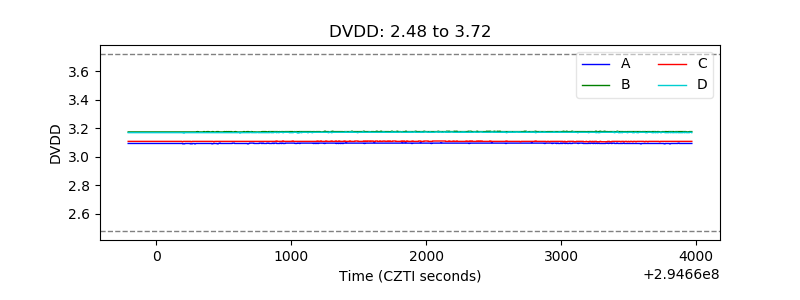 |
| Temperature 1 | 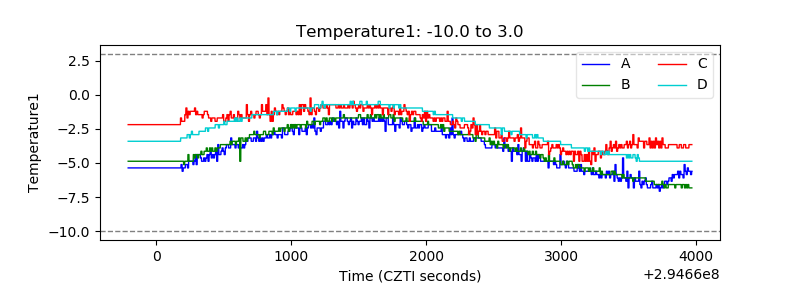 |
| Veto HV Monitor | 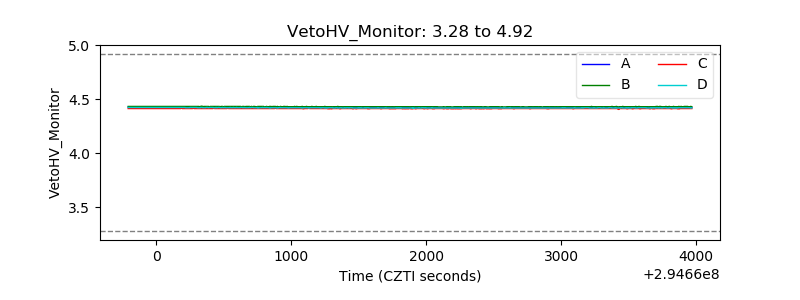 |
| Veto LLD | 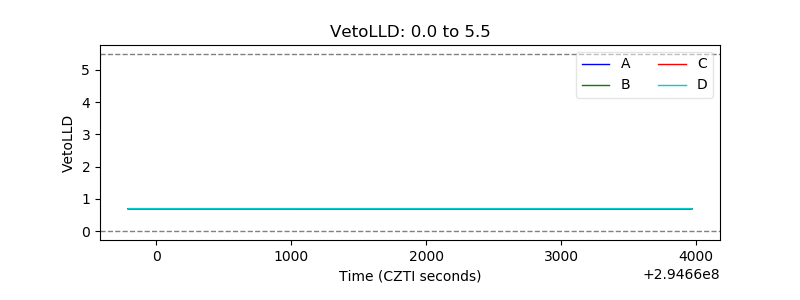 |
| Alpha Counter | 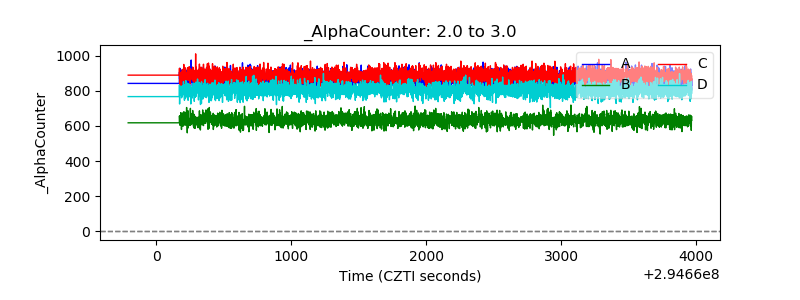 |
| _CPM_Rate | 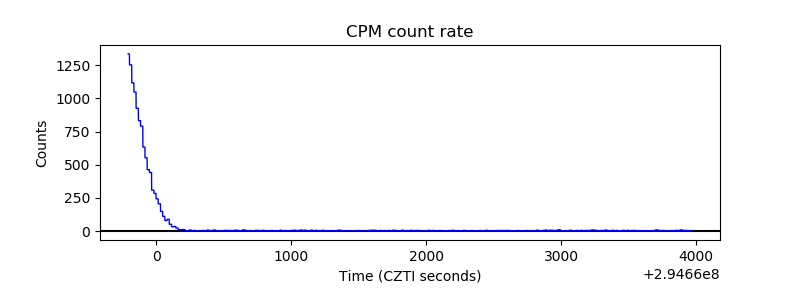 |
| CZT Counter | 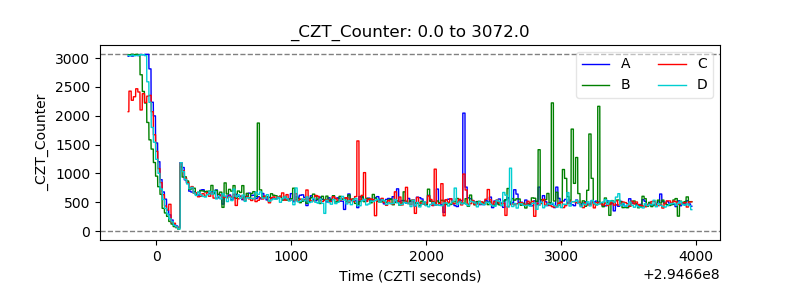 |
| +2.5 Volts monitor |  |
| +5 Volts monitor |  |
| _ROLL_ROT | 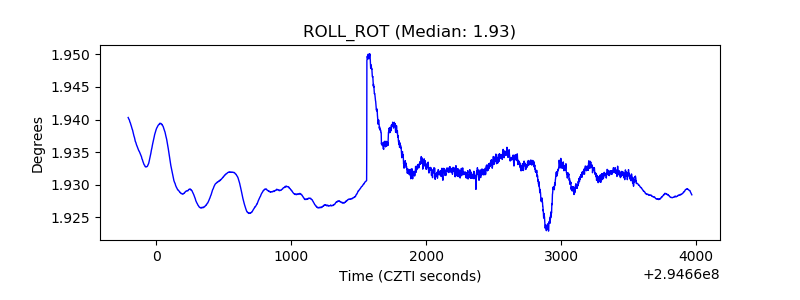 |
| _Roll_DEC | 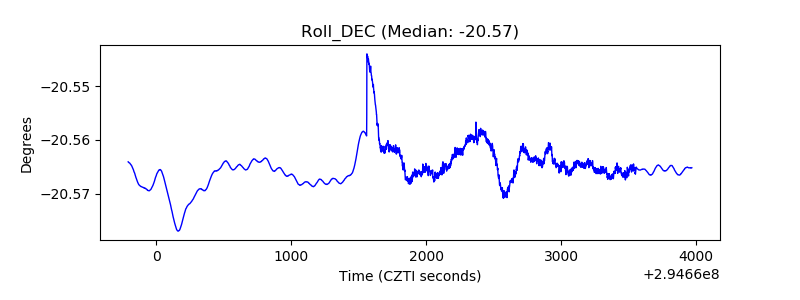 |
| _Roll_RA | 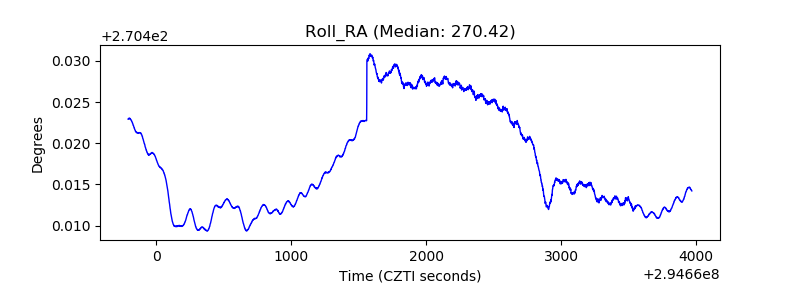 |
| Veto Counter | 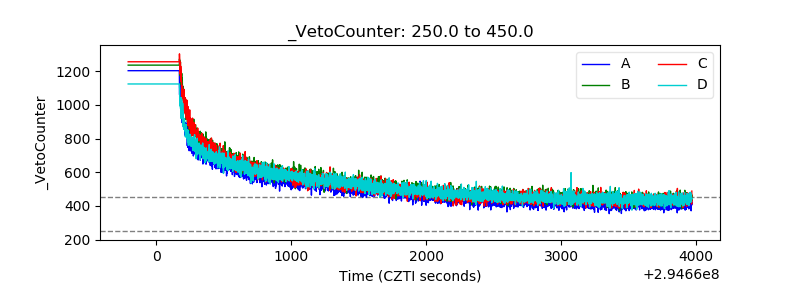 |