| Param | Original file | Final file |
|---|---|---|
| Filename | modeM0/AS1A05_229T02_9000002890cztM0_level2.fits | modeM0/AS1A05_229T02_9000002890cztM0_level2_quad_clean.evt |
| Size (bytes) | 1,747,998,720 | 1,632,150,720 |
| Size | 1.6 GB | 1.5 GB |
| Events in quadrant A | 10,931,356 | 9,835,682 |
| Events in quadrant B | 10,404,020 | 9,806,721 |
| Events in quadrant C | 10,551,854 | 9,358,963 |
| Events in quadrant D | 8,866,328 | 8,250,586 |
| Mode M0 | |||
|---|---|---|---|
| Quadrant | BADHDUFLAG | Total packets | Discarded packets |
| A | 0 | 375153 | 0 |
| B | 0 | 388718 | 0 |
| C | 0 | 406923 | 0 |
| D | 0 | 536463 | 0 |
| Mode SS | |||
|---|---|---|---|
| Quadrant | BADHDUFLAG | Total packets | Discarded packets |
| A | 0 | 3622 | 0 |
| B | 0 | 3622 | 0 |
| C | 0 | 3622 | 0 |
| D | 0 | 3622 | 0 |
| Mode M9 | |||
|---|---|---|---|
| Quadrant | BADHDUFLAG | Total packets | Discarded packets |
| A | 0 | 283 | 0 |
| B | 0 | 283 | 0 |
| C | 0 | 283 | 0 |
| D | 0 | 283 | 0 |
| Quadrant | Total seconds | Saturated seconds | Saturation percentage |
|---|---|---|---|
| A | 177793 | 2071 | 1.164838% |
| B | 177793 | 3338 | 1.877464% |
| C | 177793 | 3263 | 1.835280% |
| D | 177793 | 14564 | 8.191549% |
Noise dominated data is calculated using 1-second bins in cleaned event files. If a bin has >2000 counts, and if more than 50% of those come from <1% of pixels, then it is considered to be noise-dominated and hence unusable.
| Quadrant | # 1 sec bins | Bins with >0 counts | Bins with >2000 counts | High rate bins dominated by noise | Noise dominated (total time) | Noise dominated (detector-on time) | Marked lightcurve |
|---|---|---|---|---|---|---|---|
| A | 206004 | 177772 | 0 | 0 | 0.00% | 0.00% |  |
| B | 206004 | 177766 | 0 | 0 | 0.00% | 0.00% |  |
| C | 206004 | 177772 | 0 | 0 | 0.00% | 0.00% |  |
| D | 206004 | 176681 | 0 | 0 | 0.00% | 0.00% |  |
Top three noisy pixels from each quadrant. If the there are fewer than three noisy pixels in the level2.evt file, extra rows are filled as -1
| Pixel properties | Quadrant properties | ||||||
|---|---|---|---|---|---|---|---|
| Quadrant | DetID | PixID | Counts | Sigma | Mean | Median | Sigma |
| A | 0 | 29 | 10299 | 11.14 | 2851 | 2683 | 683.8 |
| A | 7 | 110 | 8780 | 8.92 | 2851 | 2683 | 683.8 |
| A | 9 | 19 | 8327 | 8.25 | 2851 | 2683 | 683.8 |
| B | 2 | 9 | 8228 | 10.55 | 2750 | 2626 | 531.1 |
| B | 2 | 8 | 6969 | 8.18 | 2750 | 2626 | 531.1 |
| B | 5 | 225 | 6796 | 7.85 | 2750 | 2626 | 531.1 |
| C | 12 | 241 | 7250 | 6.54 | 2789 | 2603 | 711.0 |
| C | 12 | 250 | 7202 | 6.47 | 2789 | 2603 | 711.0 |
| C | 3 | 126 | 7150 | 6.4 | 2789 | 2603 | 711.0 |
| D | 10 | 189 | 6395 | 6.11 | 2537 | 2313 | 667.5 |
| D | 15 | 46 | 6255 | 5.9 | 2537 | 2313 | 667.5 |
| D | 3 | 14 | 6246 | 5.89 | 2537 | 2313 | 667.5 |
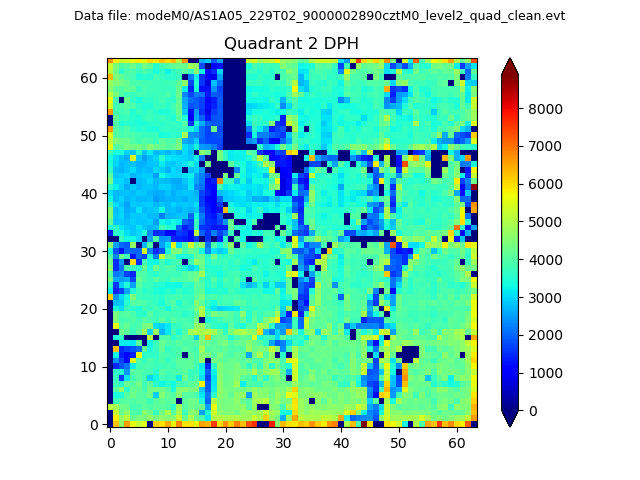
Histogram calculated using DETX and DETY for each event in the final _common_clean file
| Quadrant A |  |
 |
Quadrant B |
|---|---|---|---|
| Quadrant D |  |
 |
Quadrant C |
| Plot type | Count rate plots | Images |
|---|---|---|
| Comparison with Poisson distribution Blue bars denote a histogram of data divided into 1 sec bins. Red curve is a Poisson curve with rate = median count rate of data. |
 |
 |
| Quadrant-wise count rates Data is divided into 100 sec bins |
 |
|
| Module-wise count rates for Quadrant A Data is divided into 100 sec bins |
 |
 |
| Module-wise count rates for Quadrant B Data is divided into 100 sec bins |
 |
 |
| Module-wise count rates for Quadrant C Data is divided into 100 sec bins |
 |
 |
| Module-wise count rates for Quadrant D Data is divided into 100 sec bins |
 |
 |
| Parameter | Plot |
|---|---|
| CZT HV Monitor |  |
| D_VDD | 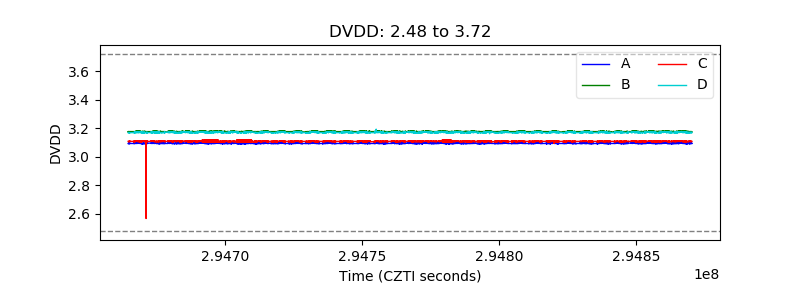 |
| Temperature 1 |  |
| Veto HV Monitor |  |
| Veto LLD | 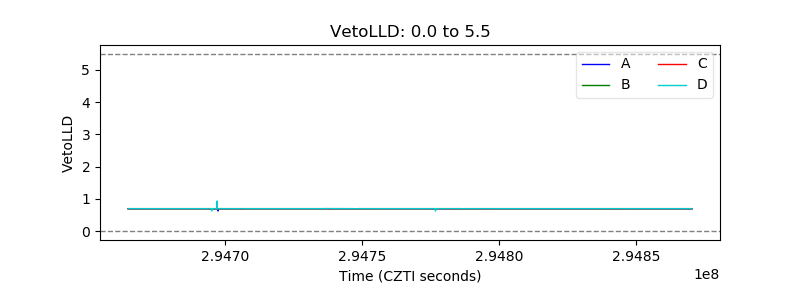 |
| Alpha Counter |  |
| _CPM_Rate |  |
| CZT Counter |  |
| +2.5 Volts monitor |  |
| +5 Volts monitor |  |
| _ROLL_ROT |  |
| _Roll_DEC |  |
| _Roll_RA |  |
| Veto Counter |  |