| Param | Original file | Final file |
|---|---|---|
| Filename | modeM0/AS1A05_229T02_9000002890_19454cztM0_level2.evt | modeM0/AS1A05_229T02_9000002890_19454cztM0_level2_quad_clean.evt |
| Size (bytes) | 178,188,480 | 18,953,280 |
| Size | 169.9 MB | 18.1 MB |
| Events in quadrant A | 1,401,958 | 103,609 |
| Events in quadrant B | 1,318,332 | 105,615 |
| Events in quadrant C | 1,277,693 | 102,027 |
| Events in quadrant D | 1,245,602 | 101,643 |
| Mode M0 | |||
|---|---|---|---|
| Quadrant | BADHDUFLAG | Total packets | Discarded packets |
| A | 0 | 5592 | 1 |
| B | 0 | 5329 | 1 |
| C | 0 | 5079 | 1 |
| D | 0 | 4970 | 1 |
| Mode SS | |||
|---|---|---|---|
| Quadrant | BADHDUFLAG | Total packets | Discarded packets |
| A | 0 | 46 | 0 |
| B | 0 | 46 | 0 |
| C | 0 | 46 | 0 |
| D | 0 | 46 | 0 |
| Mode M9 | |||
|---|---|---|---|
| Quadrant | BADHDUFLAG | Total packets | Discarded packets |
| A | 0 | 13 | 0 |
| B | 0 | 13 | 0 |
| C | 0 | 13 | 0 |
| D | 0 | 13 | 0 |
| Quadrant | Total seconds | Saturated seconds | Saturation percentage |
|---|---|---|---|
| A | 2218 | 139 | 6.266907% |
| B | 2218 | 125 | 5.635708% |
| C | 2218 | 118 | 5.320108% |
| D | 2218 | 90 | 4.057710% |
Noise dominated data is calculated using 1-second bins in cleaned event files. If a bin has >2000 counts, and if more than 50% of those come from <1% of pixels, then it is considered to be noise-dominated and hence unusable.
| Quadrant | # 1 sec bins | Bins with >0 counts | Bins with >2000 counts | High rate bins dominated by noise | Noise dominated (total time) | Noise dominated (detector-on time) | Marked lightcurve |
|---|---|---|---|---|---|---|---|
| A | 3498 | 2218 | 16 | 16 | 0.46% | 0.72% | 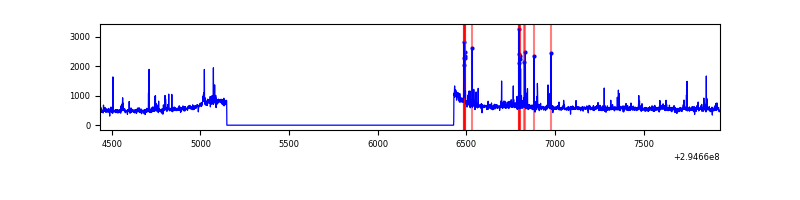 |
| B | 3498 | 2218 | 0 | 0 | 0.00% | 0.00% | 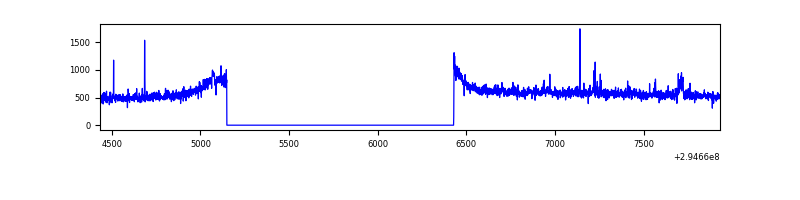 |
| C | 3498 | 2218 | 1 | 1 | 0.03% | 0.05% | 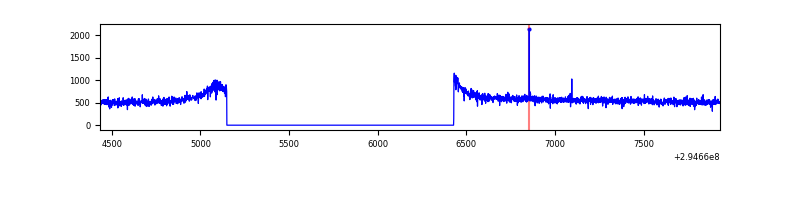 |
| D | 3498 | 2218 | 1 | 1 | 0.03% | 0.05% | 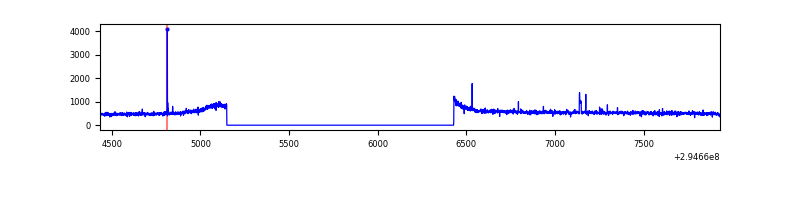 |
Top three noisy pixels from each quadrant. If the there are fewer than three noisy pixels in the level2.evt file, extra rows are filled as -1
| Pixel properties | Quadrant properties | ||||||
|---|---|---|---|---|---|---|---|
| Quadrant | DetID | PixID | Counts | Sigma | Mean | Median | Sigma |
| A | 4 | 2 | 120112 | 1760.39 | 332 | 325 | 68.0 |
| A | 13 | 254 | 2934 | 38.34 | 332 | 325 | 68.0 |
| A | 0 | 226 | 2901 | 37.86 | 332 | 325 | 68.0 |
| B | 3 | 64 | 8306 | 126.36 | 325 | 317 | 63.2 |
| B | 4 | 171 | 8014 | 121.74 | 325 | 317 | 63.2 |
| B | 0 | 190 | 7697 | 116.73 | 325 | 317 | 63.2 |
| C | 14 | 238 | 48665 | 665.79 | 312 | 313 | 72.6 |
| C | 9 | 221 | 5650 | 73.49 | 312 | 313 | 72.6 |
| C | 0 | 207 | 3401 | 42.52 | 312 | 313 | 72.6 |
| D | 1 | 52 | 20370 | 256.93 | 323 | 313 | 78.1 |
| D | 2 | 234 | 9340 | 115.64 | 323 | 313 | 78.1 |
| D | 14 | 226 | 3201 | 37.0 | 323 | 313 | 78.1 |
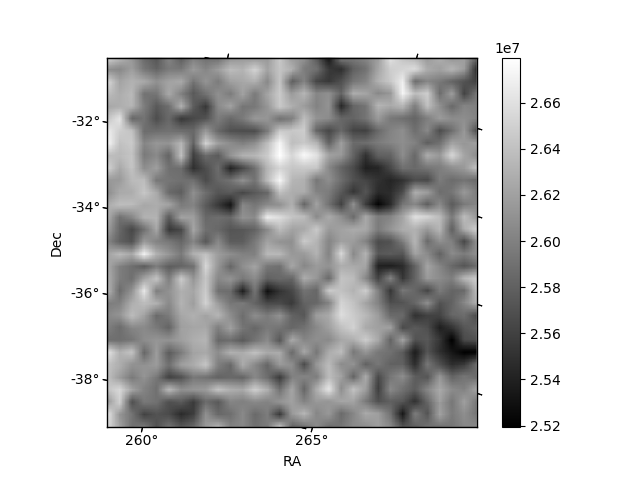
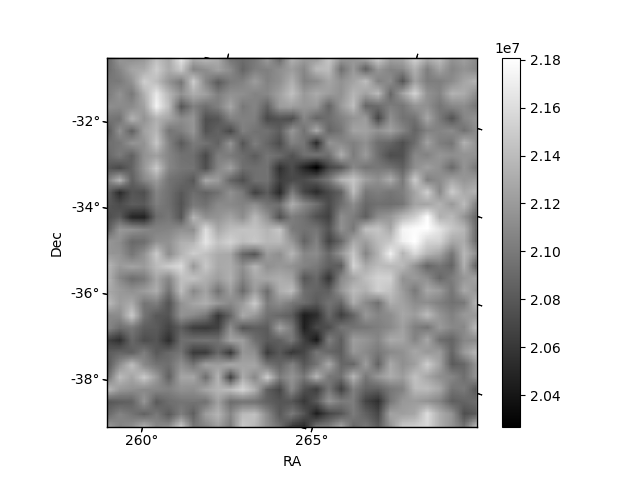
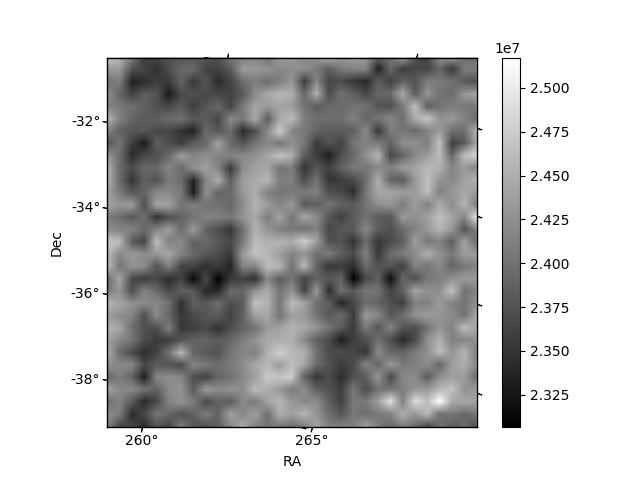
Histogram calculated using DETX and DETY for each event in the final _common_clean file
| Quadrant A | 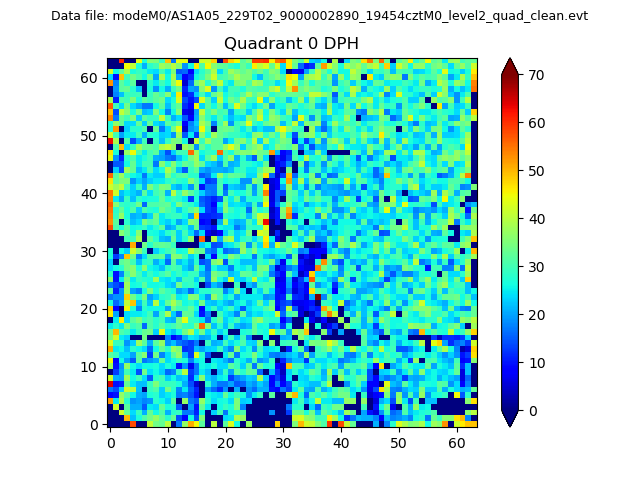 |
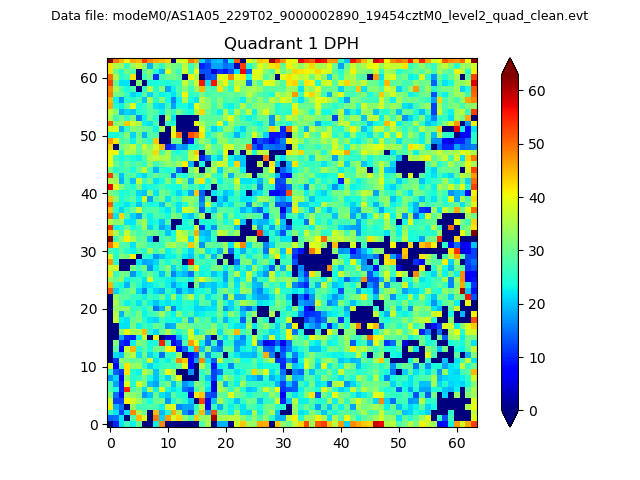 |
Quadrant B |
|---|---|---|---|
| Quadrant D | 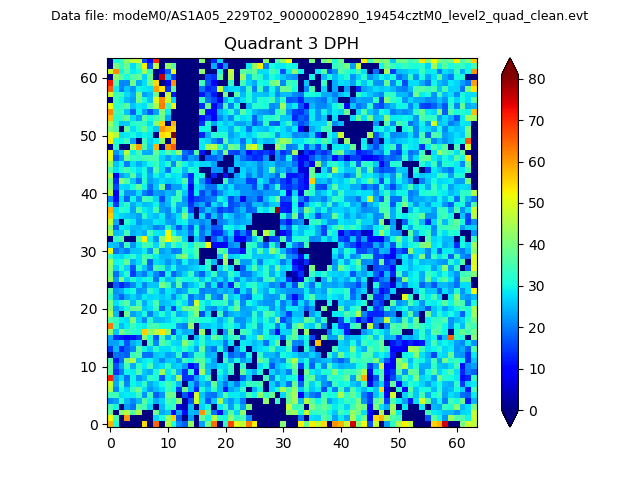 |
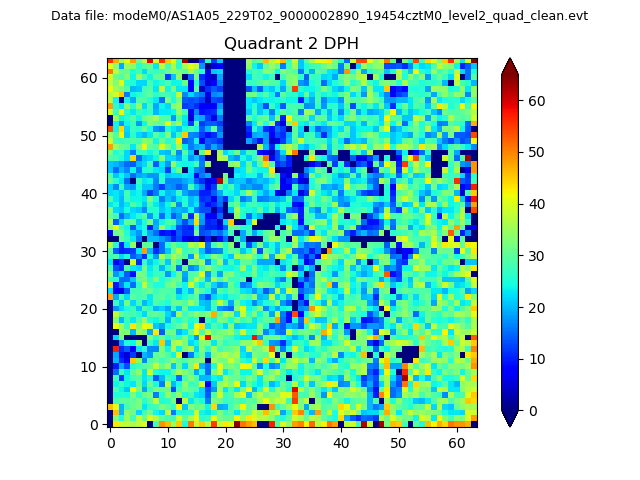 |
Quadrant C |
| Plot type | Count rate plots | Images |
|---|---|---|
| Comparison with Poisson distribution Blue bars denote a histogram of data divided into 1 sec bins. Red curve is a Poisson curve with rate = median count rate of data. |
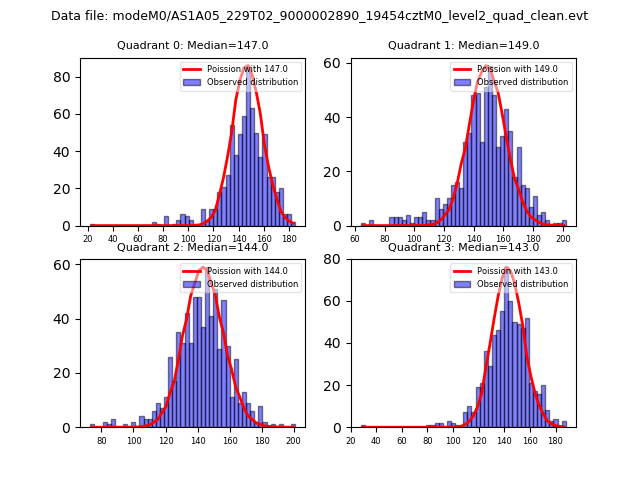 |
 |
| Quadrant-wise count rates Data is divided into 100 sec bins |
 |
|
| Module-wise count rates for Quadrant A Data is divided into 100 sec bins |
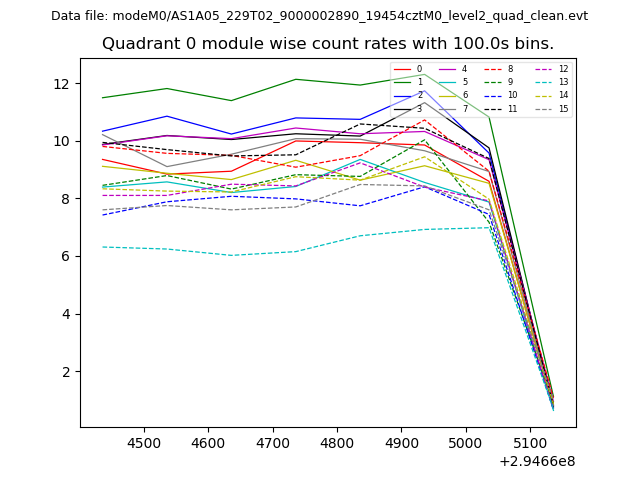 |
 |
| Module-wise count rates for Quadrant B Data is divided into 100 sec bins |
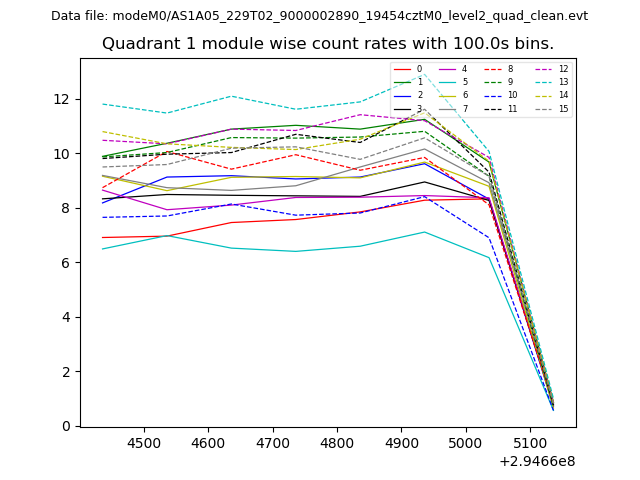 |
 |
| Module-wise count rates for Quadrant C Data is divided into 100 sec bins |
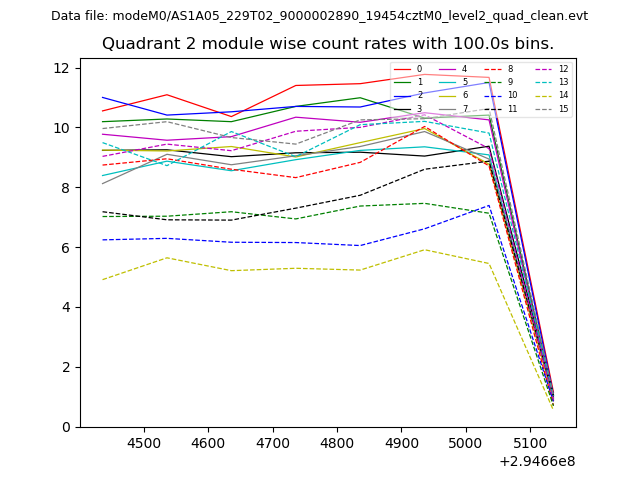 |
 |
| Module-wise count rates for Quadrant D Data is divided into 100 sec bins |
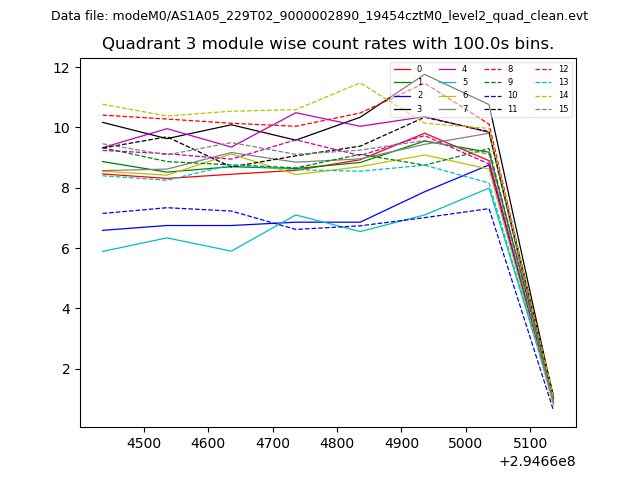 |
 |
| Parameter | Plot |
|---|---|
| CZT HV Monitor | 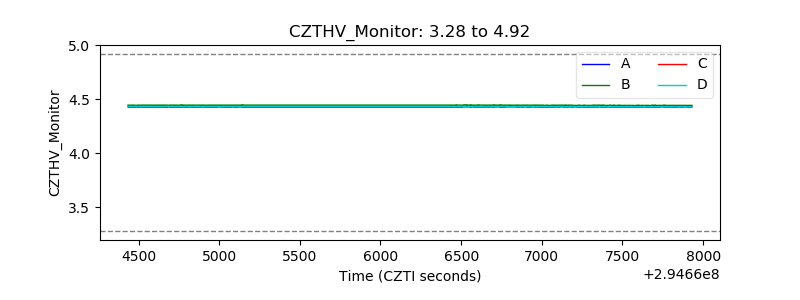 |
| D_VDD | 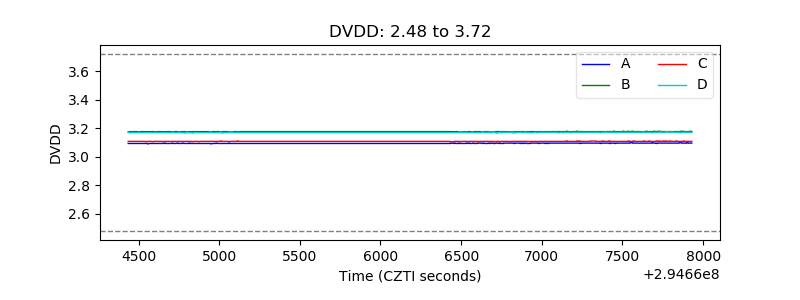 |
| Temperature 1 |  |
| Veto HV Monitor | 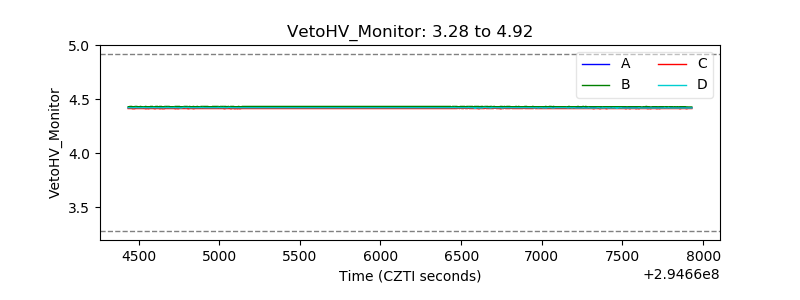 |
| Veto LLD | 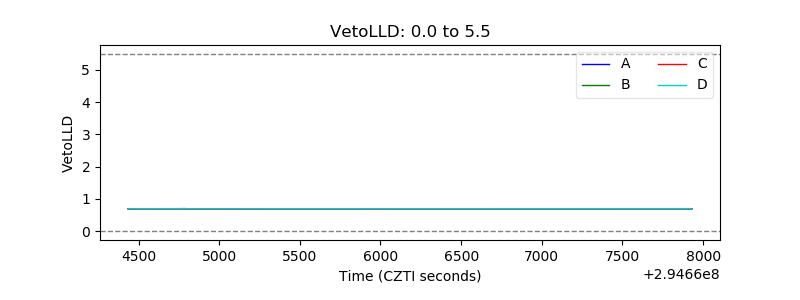 |
| Alpha Counter | 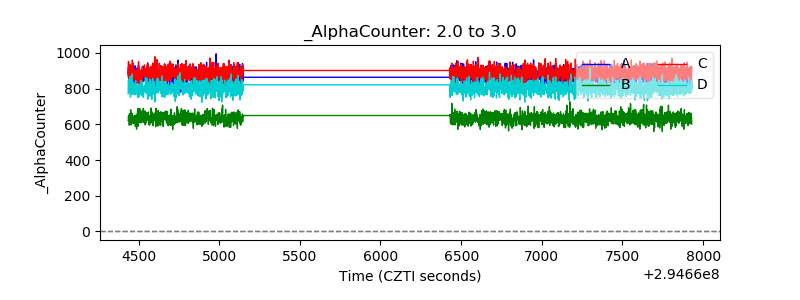 |
| _CPM_Rate | 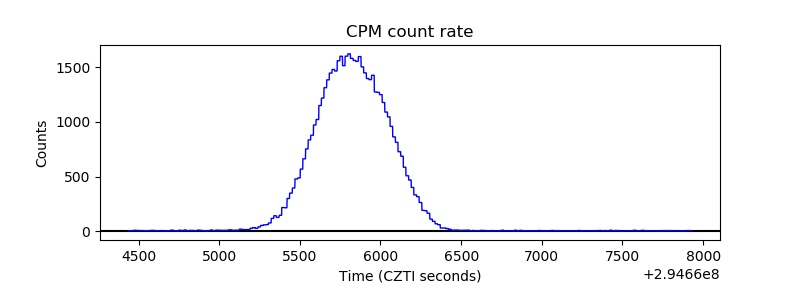 |
| CZT Counter | 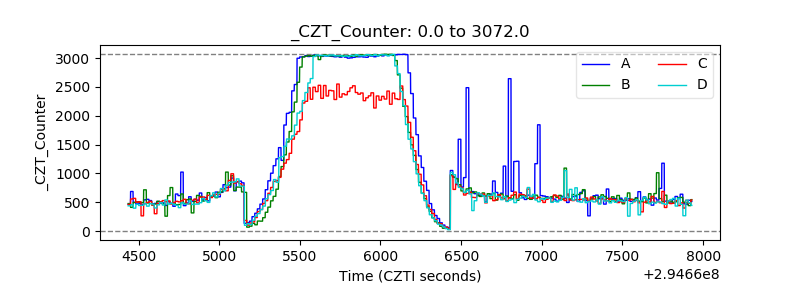 |
| +2.5 Volts monitor |  |
| +5 Volts monitor |  |
| _ROLL_ROT | 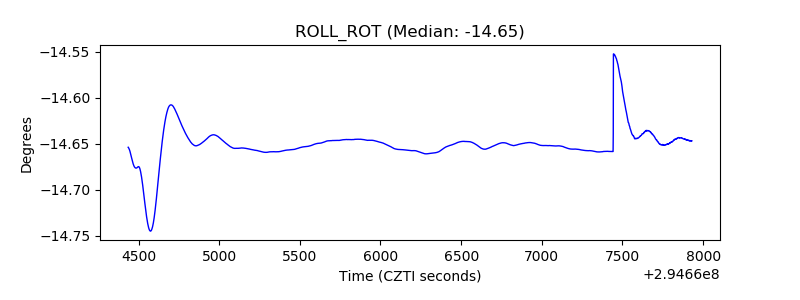 |
| _Roll_DEC | 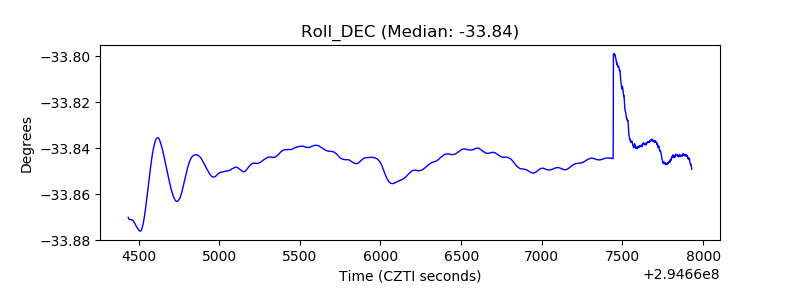 |
| _Roll_RA |  |
| Veto Counter | 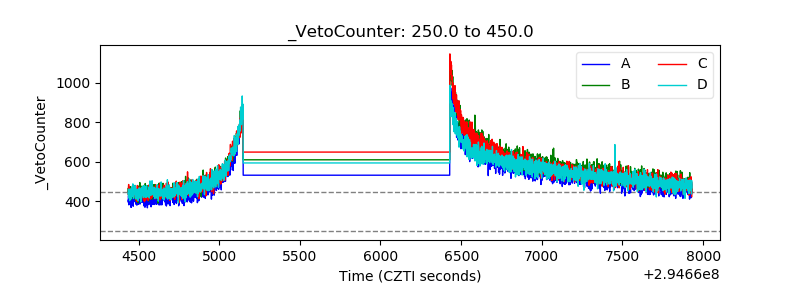 |