| Param | Original file | Final file |
|---|---|---|
| Filename | modeM0/AS1A05_229T02_9000002890_19455cztM0_level2.evt | modeM0/AS1A05_229T02_9000002890_19455cztM0_level2_quad_clean.evt |
| Size (bytes) | 510,799,680 | 69,370,560 |
| Size | 487.1 MB | 66.2 MB |
| Events in quadrant A | 3,818,763 | 416,844 |
| Events in quadrant B | 3,646,598 | 421,404 |
| Events in quadrant C | 3,756,654 | 402,166 |
| Events in quadrant D | 3,799,167 | 399,013 |
| Mode M0 | |||
|---|---|---|---|
| Quadrant | BADHDUFLAG | Total packets | Discarded packets |
| A | 0 | 15385 | 1 |
| B | 0 | 14753 | 1 |
| C | 0 | 15266 | 1 |
| D | 0 | 15404 | 1 |
| Mode SS | |||
|---|---|---|---|
| Quadrant | BADHDUFLAG | Total packets | Discarded packets |
| A | 0 | 134 | 0 |
| B | 0 | 134 | 0 |
| C | 0 | 134 | 0 |
| D | 0 | 134 | 0 |
| Mode M9 | |||
|---|---|---|---|
| Quadrant | BADHDUFLAG | Total packets | Discarded packets |
| A | 0 | 16 | 0 |
| B | 0 | 17 | 0 |
| C | 0 | 17 | 0 |
| D | 0 | 17 | 0 |
| Quadrant | Total seconds | Saturated seconds | Saturation percentage |
|---|---|---|---|
| A | 6609 | 234 | 3.540626% |
| B | 6609 | 191 | 2.889998% |
| C | 6609 | 190 | 2.874868% |
| D | 6609 | 194 | 2.935391% |
Noise dominated data is calculated using 1-second bins in cleaned event files. If a bin has >2000 counts, and if more than 50% of those come from <1% of pixels, then it is considered to be noise-dominated and hence unusable.
| Quadrant | # 1 sec bins | Bins with >0 counts | Bins with >2000 counts | High rate bins dominated by noise | Noise dominated (total time) | Noise dominated (detector-on time) | Marked lightcurve |
|---|---|---|---|---|---|---|---|
| A | 7784 | 6609 | 59 | 59 | 0.76% | 0.89% | 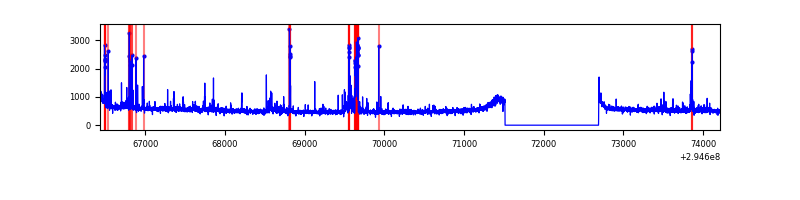 |
| B | 7784 | 6609 | 11 | 11 | 0.14% | 0.17% | 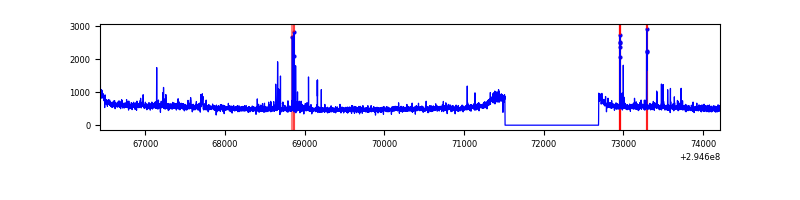 |
| C | 7784 | 6609 | 1 | 1 | 0.01% | 0.02% | 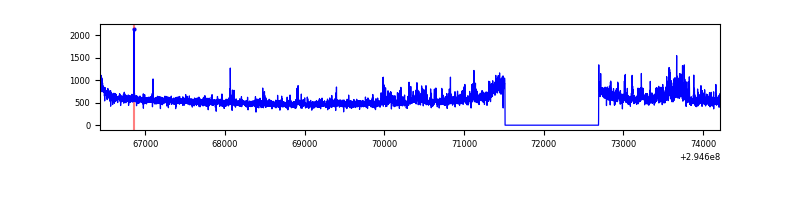 |
| D | 7784 | 6609 | 82 | 82 | 1.05% | 1.24% | 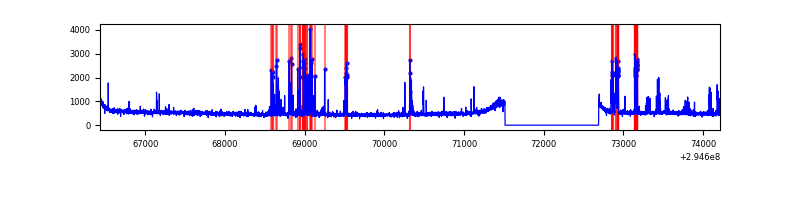 |
Top three noisy pixels from each quadrant. If the there are fewer than three noisy pixels in the level2.evt file, extra rows are filled as -1
| Pixel properties | Quadrant properties | ||||||
|---|---|---|---|---|---|---|---|
| Quadrant | DetID | PixID | Counts | Sigma | Mean | Median | Sigma |
| A | 4 | 2 | 327949 | 1809.97 | 900 | 883 | 180.7 |
| A | 11 | 29 | 15399 | 80.33 | 900 | 883 | 180.7 |
| A | 13 | 254 | 8982 | 44.82 | 900 | 883 | 180.7 |
| B | 7 | 220 | 36395 | 210.82 | 890 | 870 | 168.5 |
| B | 0 | 198 | 30467 | 175.64 | 890 | 870 | 168.5 |
| B | 12 | 111 | 19209 | 108.83 | 890 | 870 | 168.5 |
| C | 9 | 221 | 166252 | 847.38 | 848 | 856 | 195.2 |
| C | 14 | 238 | 133107 | 677.56 | 848 | 856 | 195.2 |
| C | 3 | 233 | 129570 | 659.44 | 848 | 856 | 195.2 |
| D | 1 | 52 | 483415 | 2303.65 | 870 | 847 | 209.5 |
| D | 2 | 234 | 27495 | 127.21 | 870 | 847 | 209.5 |
| D | 7 | 96 | 17722 | 80.56 | 870 | 847 | 209.5 |
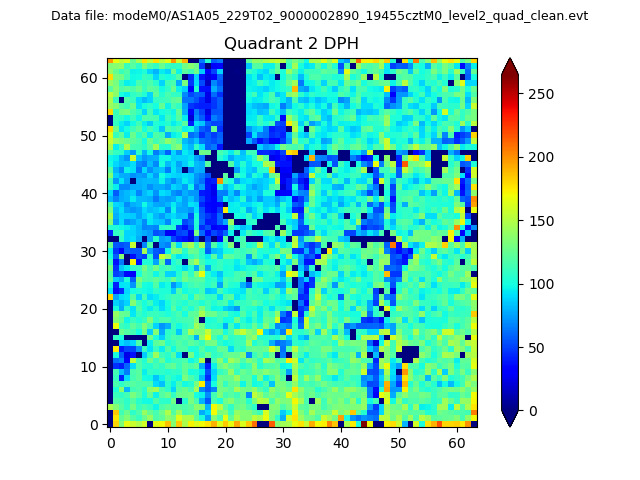
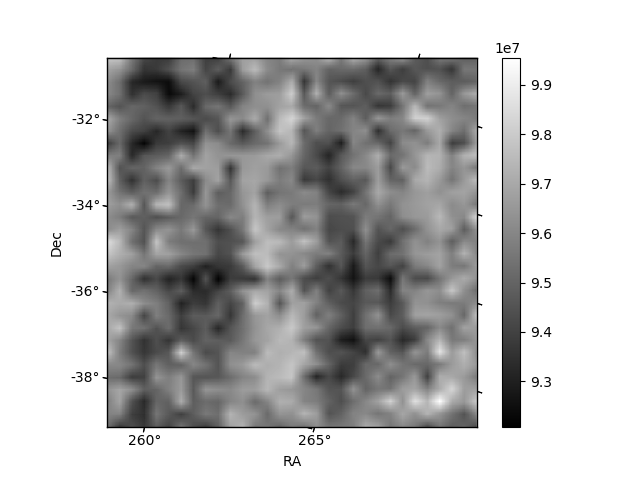
Histogram calculated using DETX and DETY for each event in the final _common_clean file
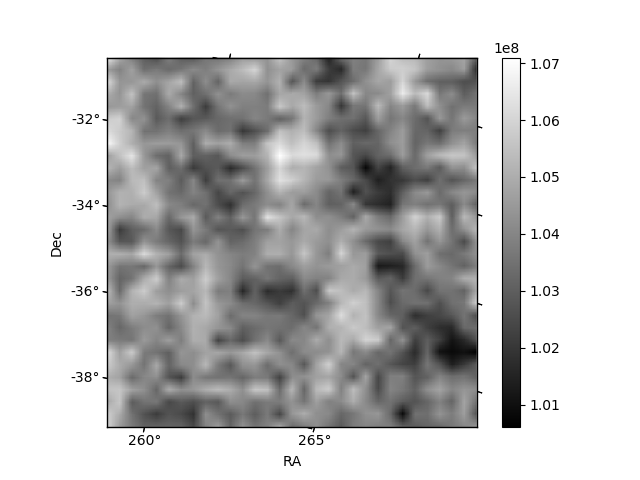
| Quadrant A | 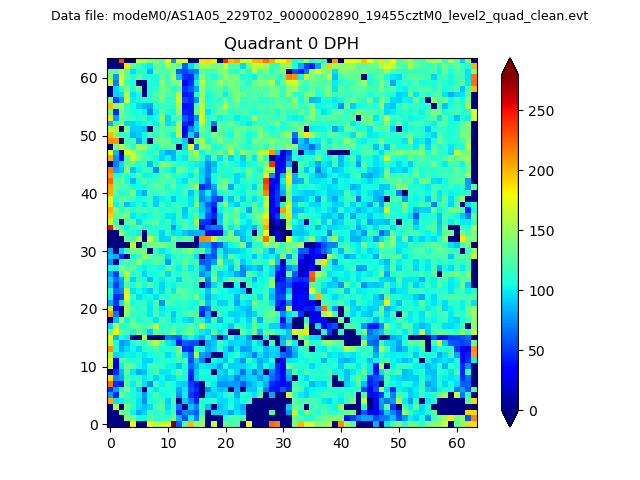 |
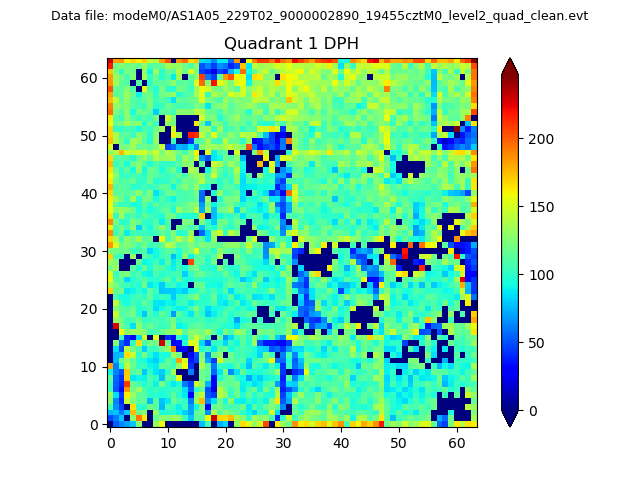 |
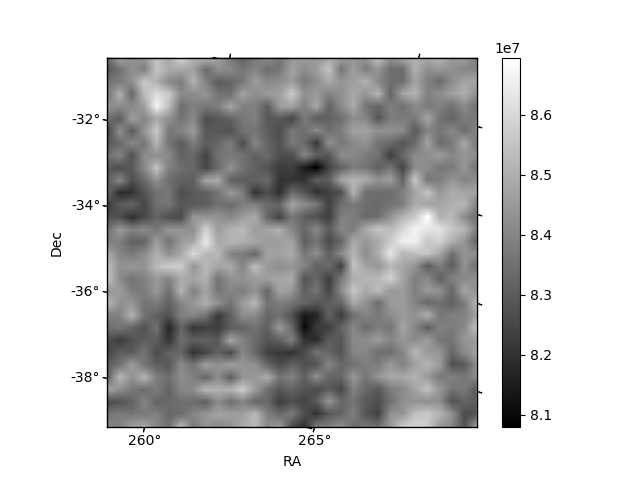
Quadrant B |
|---|---|---|---|
| Quadrant D | 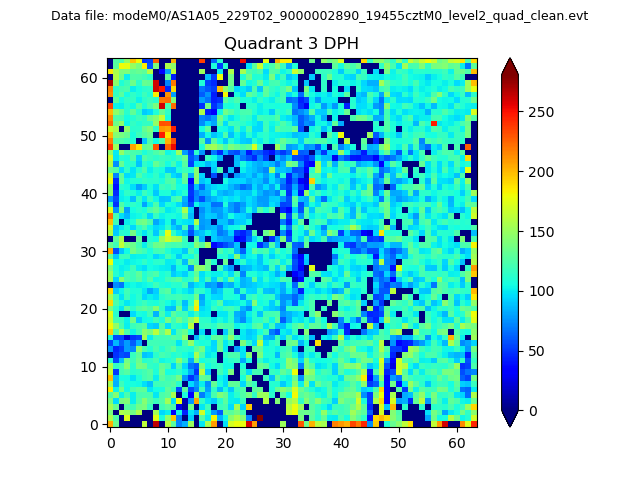 |
 |
Quadrant C |
| Plot type | Count rate plots | Images |
|---|---|---|
| Comparison with Poisson distribution Blue bars denote a histogram of data divided into 1 sec bins. Red curve is a Poisson curve with rate = median count rate of data. |
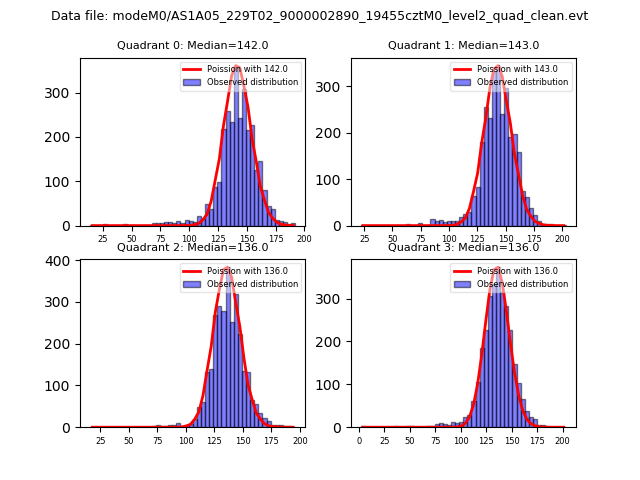 |
 |
| Quadrant-wise count rates Data is divided into 100 sec bins |
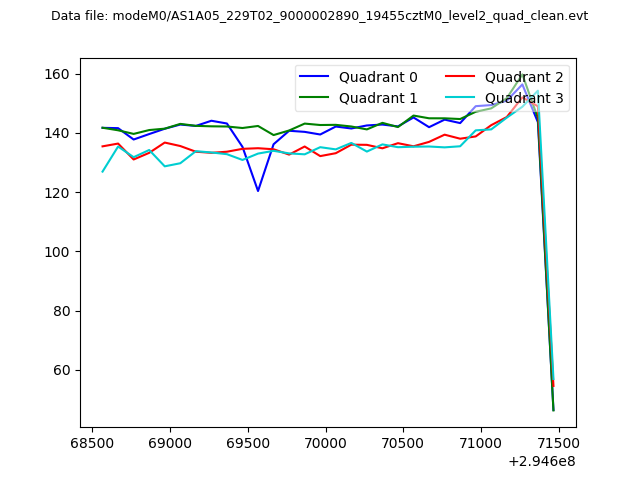 |
|
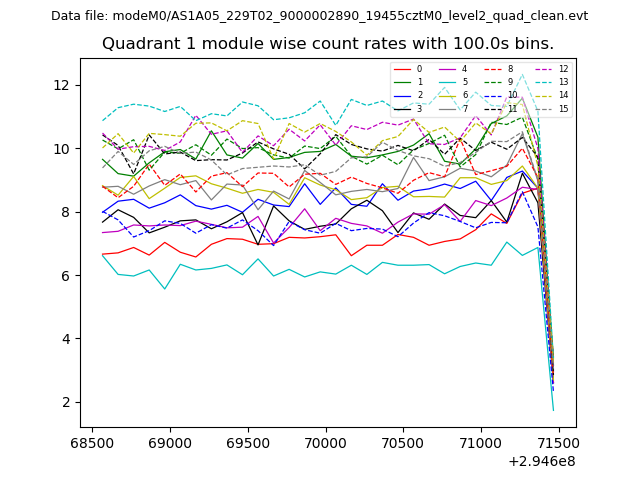
| Module-wise count rates for Quadrant A Data is divided into 100 sec bins |
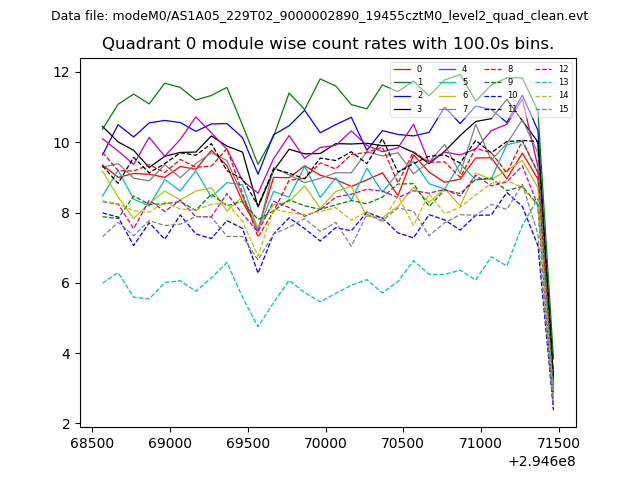 |
 |
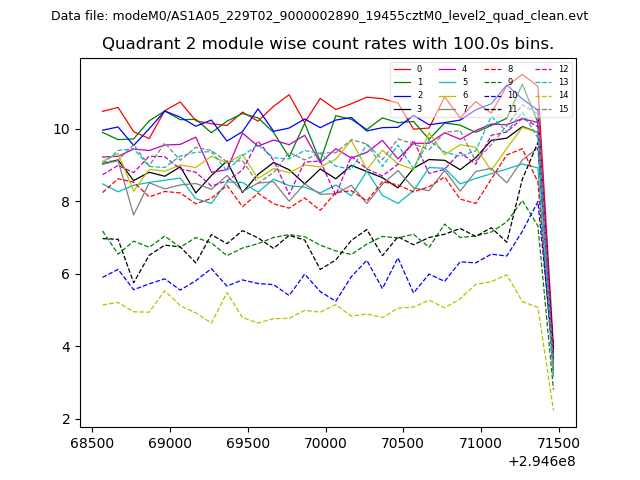
| Module-wise count rates for Quadrant B Data is divided into 100 sec bins |
 |
 |
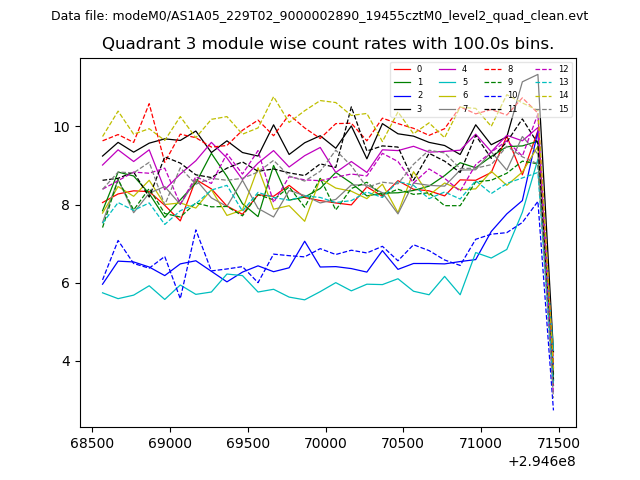
| Module-wise count rates for Quadrant C Data is divided into 100 sec bins |
 |
 |
| Module-wise count rates for Quadrant D Data is divided into 100 sec bins |
 |
 |
| Parameter | Plot |
|---|---|
| CZT HV Monitor | 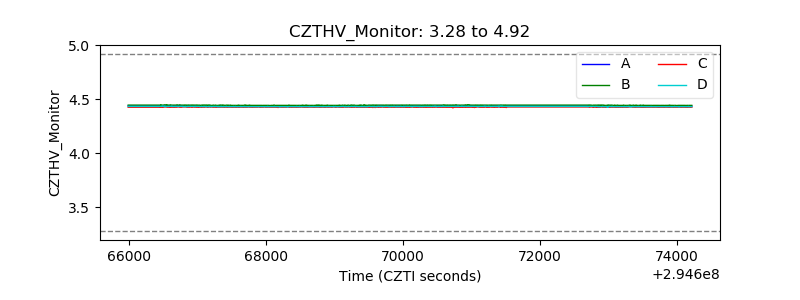 |
| D_VDD | 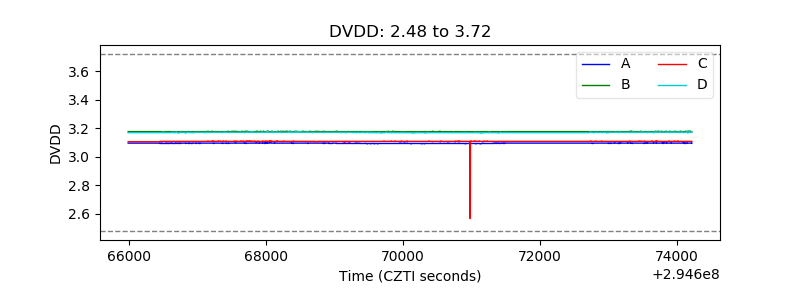 |
| Temperature 1 | 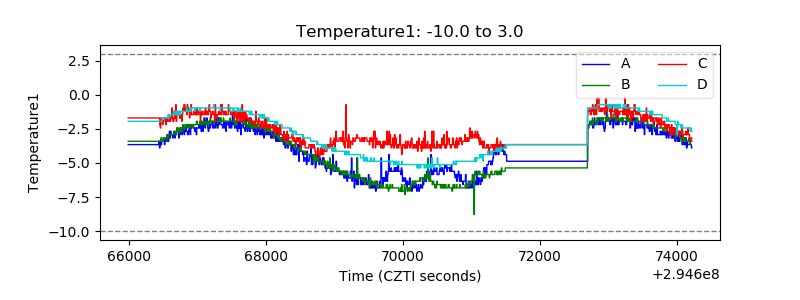 |
| Veto HV Monitor | 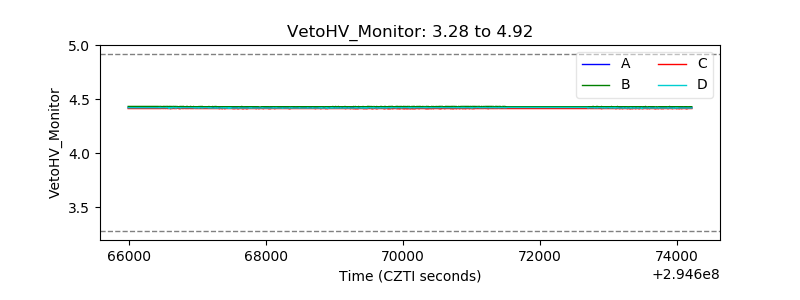 |
| Veto LLD | 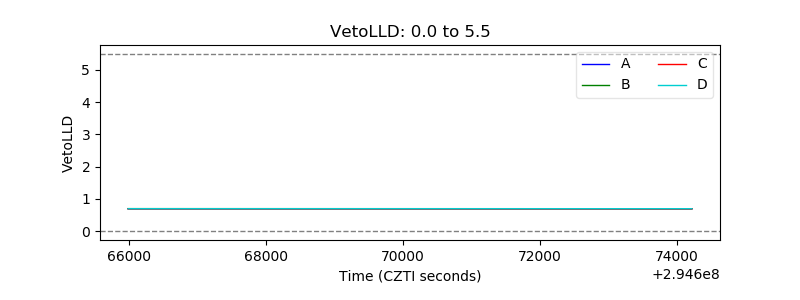 |
| Alpha Counter | 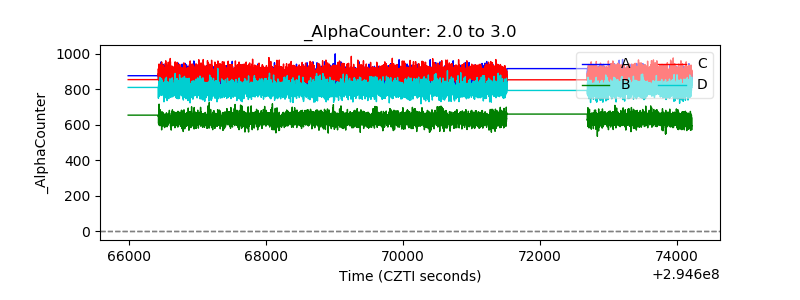 |
| _CPM_Rate | 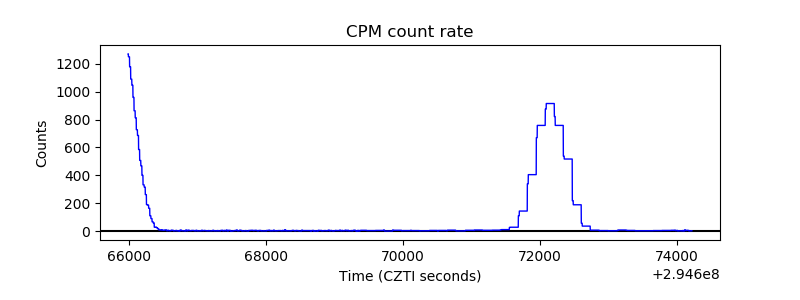 |
| CZT Counter |  |
| +2.5 Volts monitor |  |
| +5 Volts monitor |  |
| _ROLL_ROT | 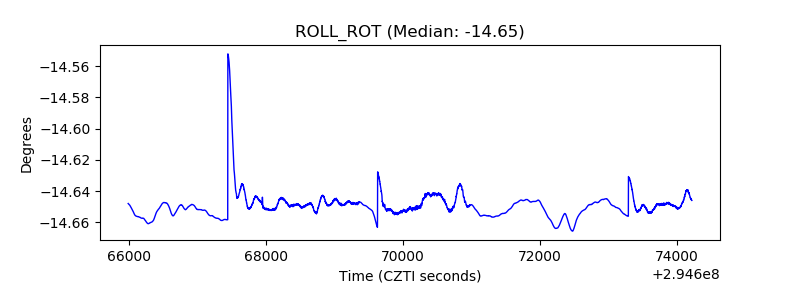 |
| _Roll_DEC | 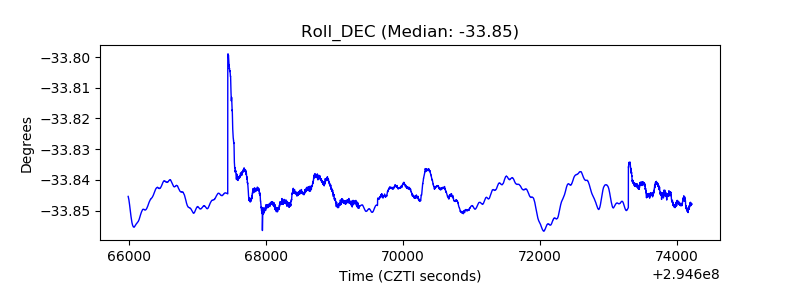 |
| _Roll_RA | 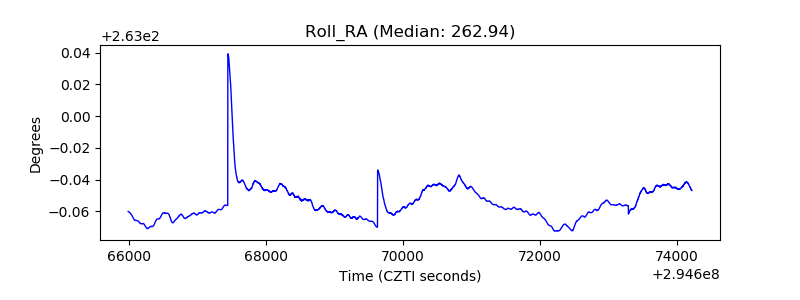 |
| Veto Counter | 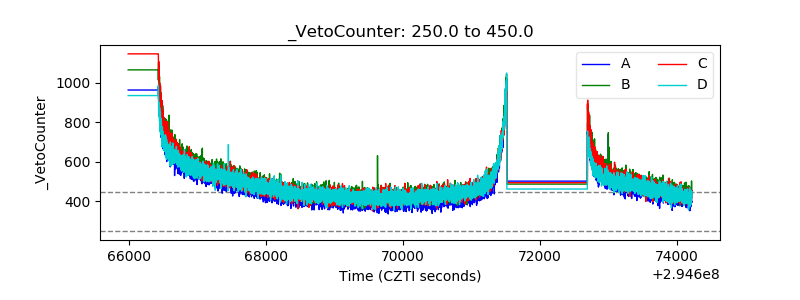 |