| Param | Original file | Final file |
|---|---|---|
| Filename | modeM0/AS1A05_229T02_9000002890_19456cztM0_level2.evt | modeM0/AS1A05_229T02_9000002890_19456cztM0_level2_quad_clean.evt |
| Size (bytes) | 514,748,160 | 78,445,440 |
| Size | 490.9 MB | 74.8 MB |
| Events in quadrant A | 3,425,338 | 489,556 |
| Events in quadrant B | 3,518,025 | 491,643 |
| Events in quadrant C | 4,138,768 | 470,508 |
| Events in quadrant D | 4,058,349 | 462,411 |
| Mode M0 | |||
|---|---|---|---|
| Quadrant | BADHDUFLAG | Total packets | Discarded packets |
| A | 0 | 14172 | 1 |
| B | 0 | 14390 | 1 |
| C | 0 | 16622 | 2 |
| D | 0 | 16386 | 1 |
| Mode SS | |||
|---|---|---|---|
| Quadrant | BADHDUFLAG | Total packets | Discarded packets |
| A | 0 | 132 | 0 |
| B | 0 | 132 | 0 |
| C | 0 | 132 | 0 |
| D | 0 | 132 | 0 |
| Mode M9 | |||
|---|---|---|---|
| Quadrant | BADHDUFLAG | Total packets | Discarded packets |
| A | 0 | 10 | 0 |
| B | 0 | 11 | 0 |
| C | 0 | 11 | 0 |
| D | 0 | 11 | 0 |
| Quadrant | Total seconds | Saturated seconds | Saturation percentage |
|---|---|---|---|
| A | 6623 | 92 | 1.389099% |
| B | 6623 | 153 | 2.310131% |
| C | 6622 | 169 | 2.552099% |
| D | 6622 | 218 | 3.292057% |
Noise dominated data is calculated using 1-second bins in cleaned event files. If a bin has >2000 counts, and if more than 50% of those come from <1% of pixels, then it is considered to be noise-dominated and hence unusable.
| Quadrant | # 1 sec bins | Bins with >0 counts | Bins with >2000 counts | High rate bins dominated by noise | Noise dominated (total time) | Noise dominated (detector-on time) | Marked lightcurve |
|---|---|---|---|---|---|---|---|
| A | 7583 | 6623 | 4 | 4 | 0.05% | 0.06% |  |
| B | 7583 | 6623 | 36 | 36 | 0.47% | 0.54% |  |
| C | 7582 | 6622 | 10 | 10 | 0.13% | 0.15% |  |
| D | 7582 | 6623 | 150 | 150 | 1.98% | 2.26% | 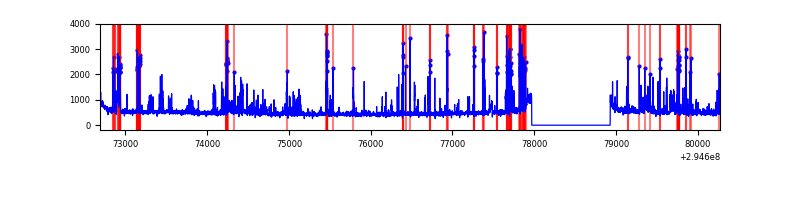 |
Top three noisy pixels from each quadrant. If the there are fewer than three noisy pixels in the level2.evt file, extra rows are filled as -1
| Pixel properties | Quadrant properties | ||||||
|---|---|---|---|---|---|---|---|
| Quadrant | DetID | PixID | Counts | Sigma | Mean | Median | Sigma |
| A | 4 | 2 | 94891 | 549.15 | 853 | 835 | 171.3 |
| A | 11 | 29 | 33700 | 191.88 | 853 | 835 | 171.3 |
| A | 13 | 254 | 9067 | 48.06 | 853 | 835 | 171.3 |
| B | 7 | 220 | 106229 | 656.82 | 845 | 825 | 160.5 |
| B | 0 | 198 | 21841 | 130.96 | 845 | 825 | 160.5 |
| B | 12 | 111 | 18481 | 110.02 | 845 | 825 | 160.5 |
| C | 9 | 221 | 579656 | 3102.82 | 809 | 816 | 186.6 |
| C | 3 | 233 | 236516 | 1263.45 | 809 | 816 | 186.6 |
| C | 14 | 238 | 126227 | 672.25 | 809 | 816 | 186.6 |
| D | 1 | 52 | 742673 | 3738.66 | 820 | 798 | 198.4 |
| D | 7 | 238 | 57778 | 287.15 | 820 | 798 | 198.4 |
| D | 7 | 96 | 57149 | 283.98 | 820 | 798 | 198.4 |
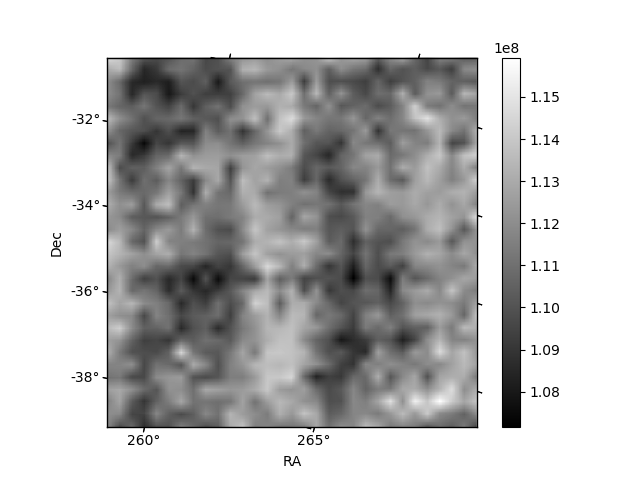
Histogram calculated using DETX and DETY for each event in the final _common_clean file
| Quadrant A |  |
 |
Quadrant B |
|---|---|---|---|
| Quadrant D |  |
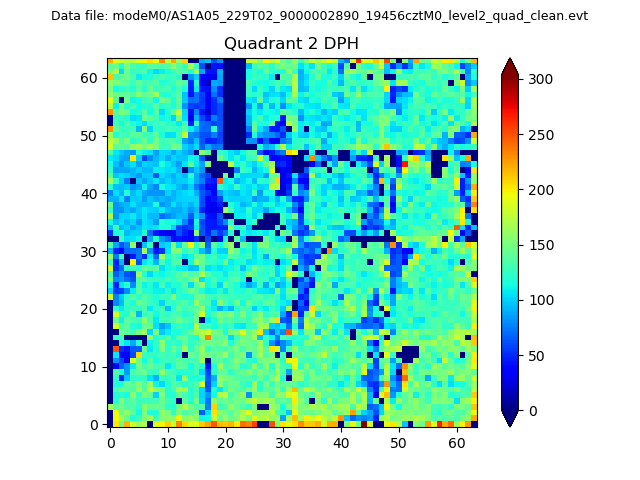 |
Quadrant C |
| Plot type | Count rate plots | Images |
|---|---|---|
| Comparison with Poisson distribution Blue bars denote a histogram of data divided into 1 sec bins. Red curve is a Poisson curve with rate = median count rate of data. |
 |
 |
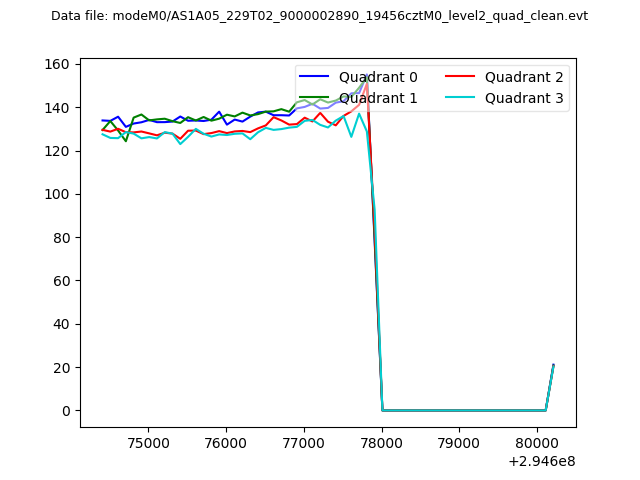
| Quadrant-wise count rates Data is divided into 100 sec bins |
 |
|
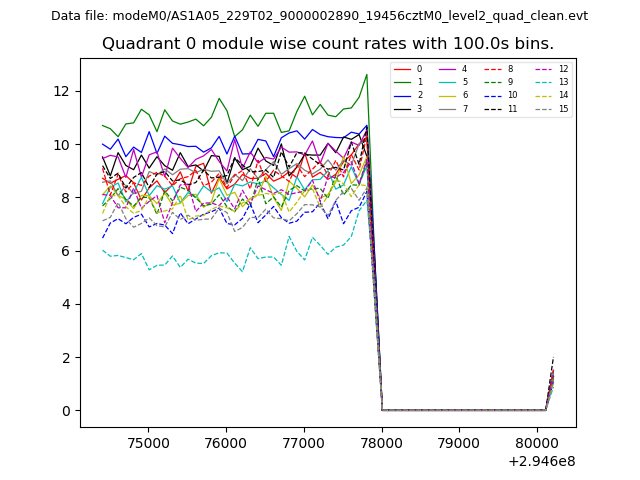
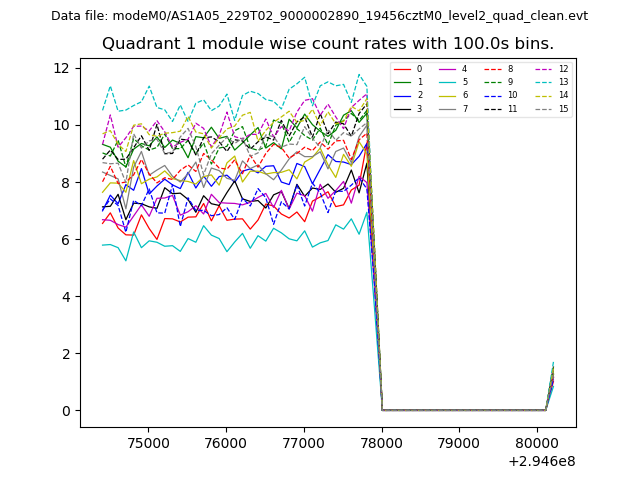
| Module-wise count rates for Quadrant A Data is divided into 100 sec bins |
 |
 |
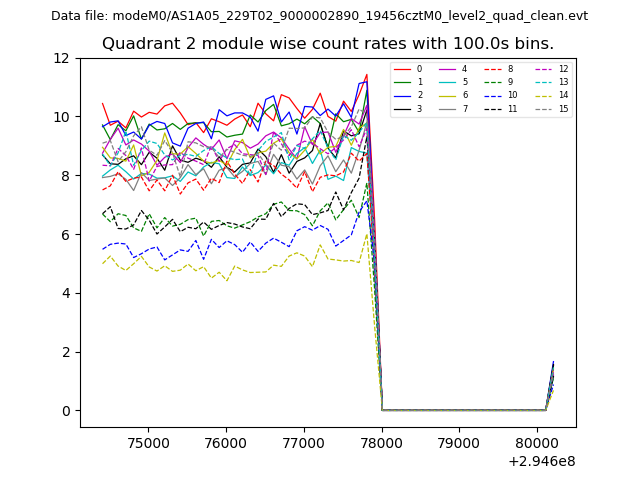
| Module-wise count rates for Quadrant B Data is divided into 100 sec bins |
 |
 |
| Module-wise count rates for Quadrant C Data is divided into 100 sec bins |
 |
 |
| Module-wise count rates for Quadrant D Data is divided into 100 sec bins |
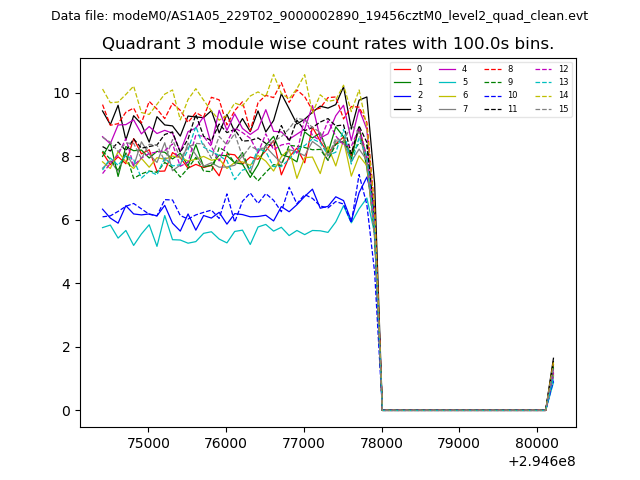 |
 |
| Parameter | Plot |
|---|---|
| CZT HV Monitor | 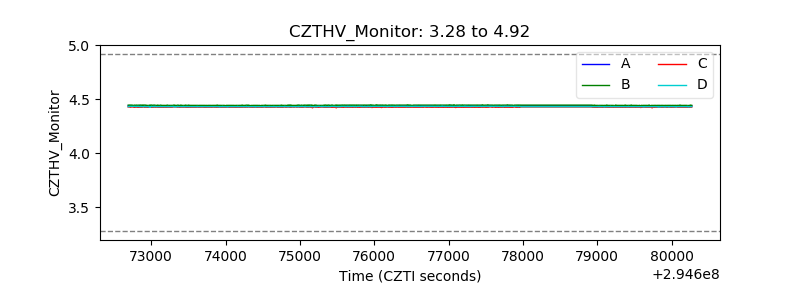 |
| D_VDD | 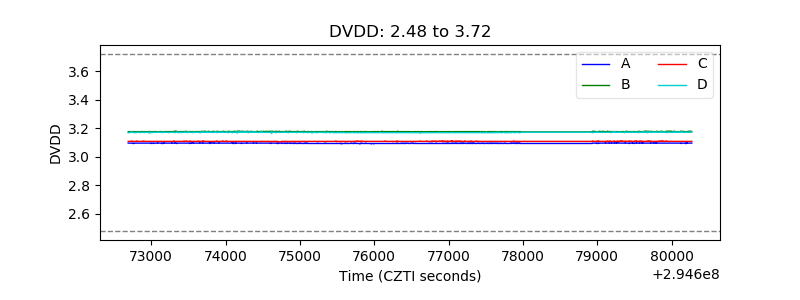 |
| Temperature 1 | 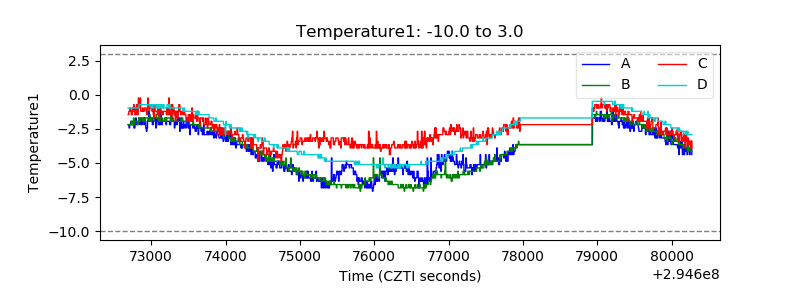 |
| Veto HV Monitor | 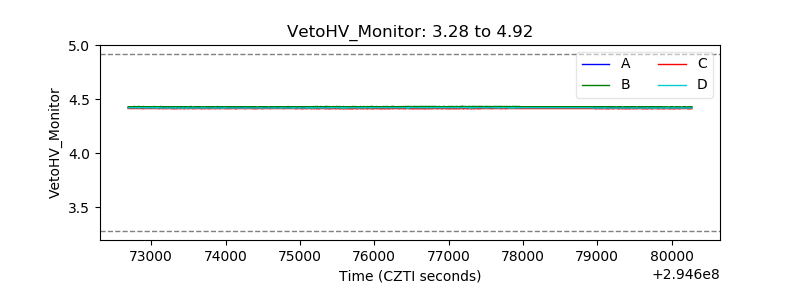 |
| Veto LLD |  |
| Alpha Counter | 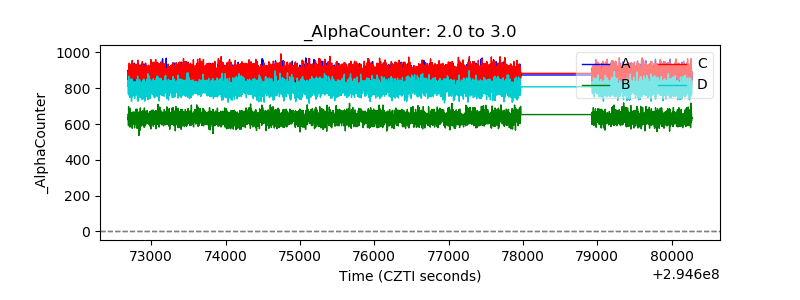 |
| _CPM_Rate | 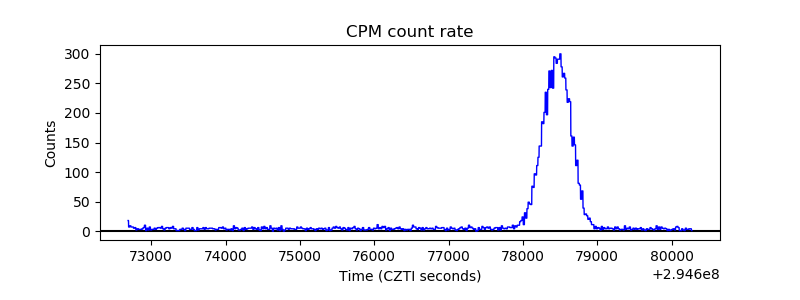 |
| CZT Counter | 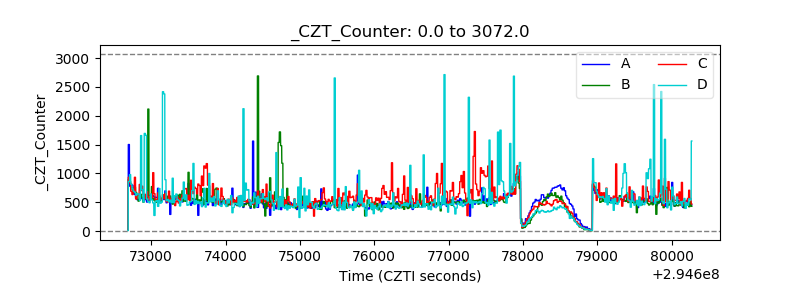 |
| +2.5 Volts monitor |  |
| +5 Volts monitor | 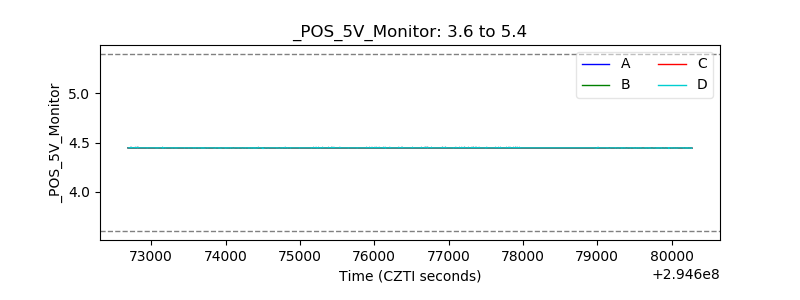 |
| _ROLL_ROT | 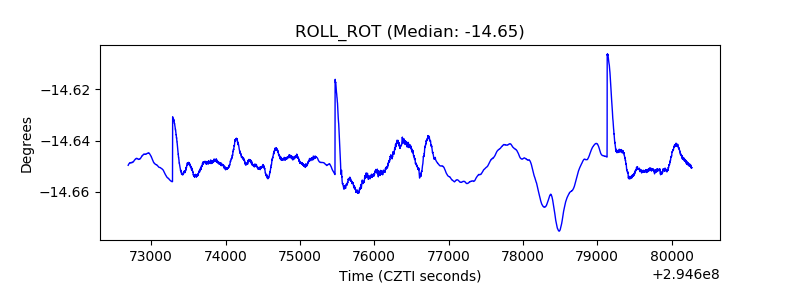 |
| _Roll_DEC | 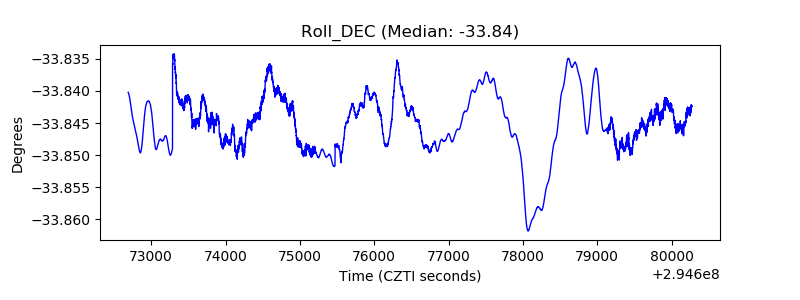 |
| _Roll_RA | 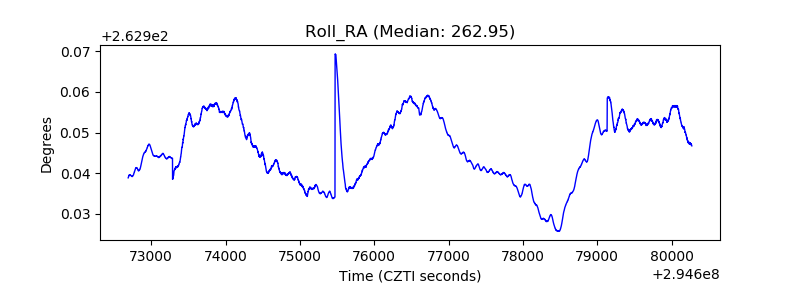 |
| Veto Counter | 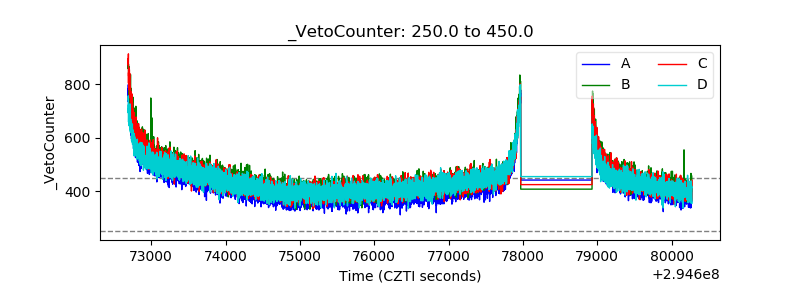 |