| Param | Original file | Final file |
|---|---|---|
| Filename | modeM0/AS1A05_229T02_9000002890_19457cztM0_level2.evt | modeM0/AS1A05_229T02_9000002890_19457cztM0_level2_quad_clean.evt |
| Size (bytes) | 522,754,560 | 90,826,560 |
| Size | 498.5 MB | 86.6 MB |
| Events in quadrant A | 3,616,456 | 570,906 |
| Events in quadrant B | 3,819,516 | 573,266 |
| Events in quadrant C | 3,935,149 | 554,437 |
| Events in quadrant D | 3,965,025 | 544,013 |
| Mode M0 | |||
|---|---|---|---|
| Quadrant | BADHDUFLAG | Total packets | Discarded packets |
| A | 0 | 15353 | 2 |
| B | 0 | 15857 | 2 |
| C | 0 | 16306 | 2 |
| D | 0 | 16749 | 2 |
| Mode SS | |||
|---|---|---|---|
| Quadrant | BADHDUFLAG | Total packets | Discarded packets |
| A | 0 | 148 | 0 |
| B | 0 | 148 | 0 |
| C | 0 | 148 | 0 |
| D | 0 | 148 | 0 |
| Mode M9 | |||
|---|---|---|---|
| Quadrant | BADHDUFLAG | Total packets | Discarded packets |
| A | 0 | 16 | 0 |
| B | 0 | 16 | 0 |
| C | 0 | 16 | 0 |
| D | 0 | 16 | 0 |
| Quadrant | Total seconds | Saturated seconds | Saturation percentage |
|---|---|---|---|
| A | 7302 | 142 | 1.944673% |
| B | 7302 | 220 | 3.012873% |
| C | 7302 | 208 | 2.848535% |
| D | 7303 | 183 | 2.505820% |
Noise dominated data is calculated using 1-second bins in cleaned event files. If a bin has >2000 counts, and if more than 50% of those come from <1% of pixels, then it is considered to be noise-dominated and hence unusable.
| Quadrant | # 1 sec bins | Bins with >0 counts | Bins with >2000 counts | High rate bins dominated by noise | Noise dominated (total time) | Noise dominated (detector-on time) | Marked lightcurve |
|---|---|---|---|---|---|---|---|
| A | 8842 | 7303 | 0 | 0 | 0.00% | 0.00% | 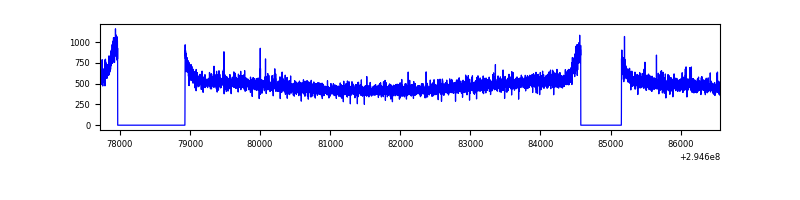 |
| B | 8842 | 7302 | 35 | 35 | 0.40% | 0.48% | 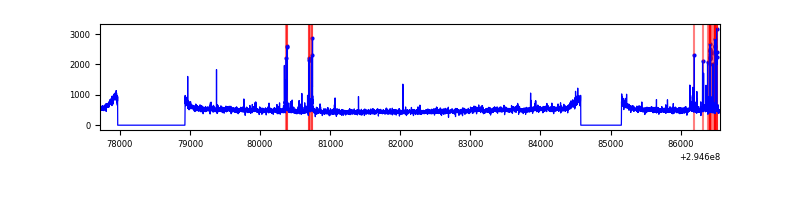 |
| C | 8842 | 7303 | 10 | 10 | 0.11% | 0.14% | 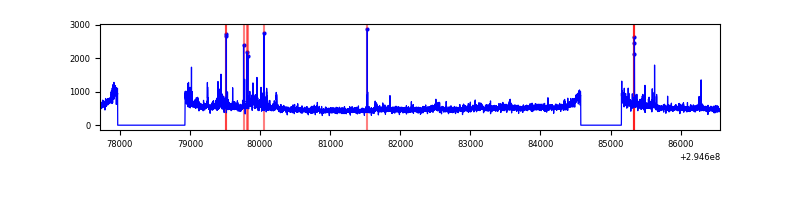 |
| D | 8843 | 7305 | 92 | 92 | 1.04% | 1.26% | 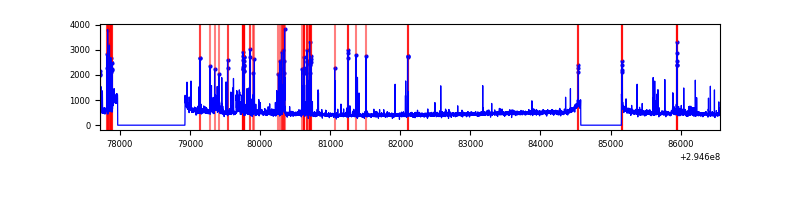 |
Top three noisy pixels from each quadrant. If the there are fewer than three noisy pixels in the level2.evt file, extra rows are filled as -1
| Pixel properties | Quadrant properties | ||||||
|---|---|---|---|---|---|---|---|
| Quadrant | DetID | PixID | Counts | Sigma | Mean | Median | Sigma |
| A | 11 | 29 | 32150 | 166.57 | 925 | 906 | 187.6 |
| A | 3 | 1 | 12156 | 59.98 | 925 | 906 | 187.6 |
| A | 13 | 254 | 9225 | 44.35 | 925 | 906 | 187.6 |
| B | 7 | 220 | 140039 | 786.84 | 916 | 894 | 176.8 |
| B | 0 | 198 | 44606 | 247.18 | 916 | 894 | 176.8 |
| B | 12 | 111 | 20799 | 112.56 | 916 | 894 | 176.8 |
| C | 3 | 233 | 196526 | 949.41 | 879 | 884 | 206.1 |
| C | 14 | 238 | 137881 | 664.81 | 879 | 884 | 206.1 |
| C | 9 | 221 | 111787 | 538.19 | 879 | 884 | 206.1 |
| D | 1 | 52 | 392780 | 1801.61 | 895 | 870 | 217.5 |
| D | 7 | 238 | 61024 | 276.53 | 895 | 870 | 217.5 |
| D | 13 | 172 | 56527 | 255.86 | 895 | 870 | 217.5 |
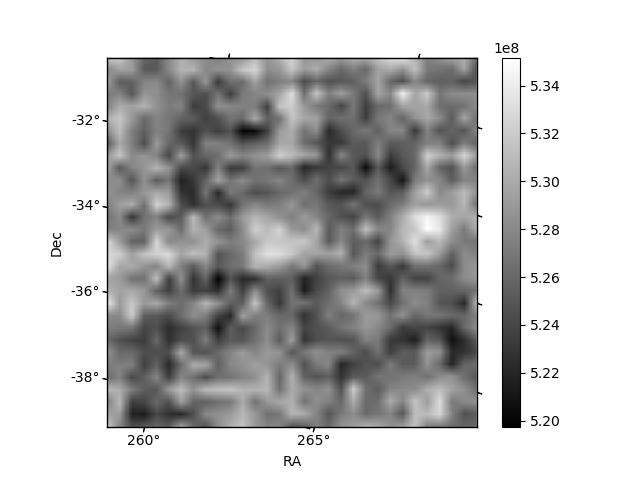
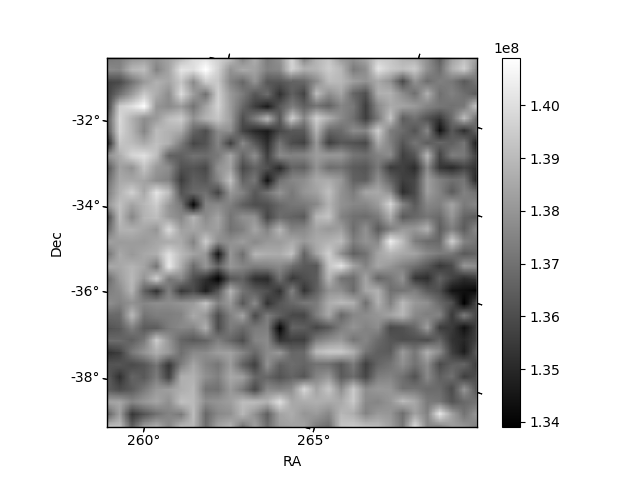
Histogram calculated using DETX and DETY for each event in the final _common_clean file
| Quadrant A | 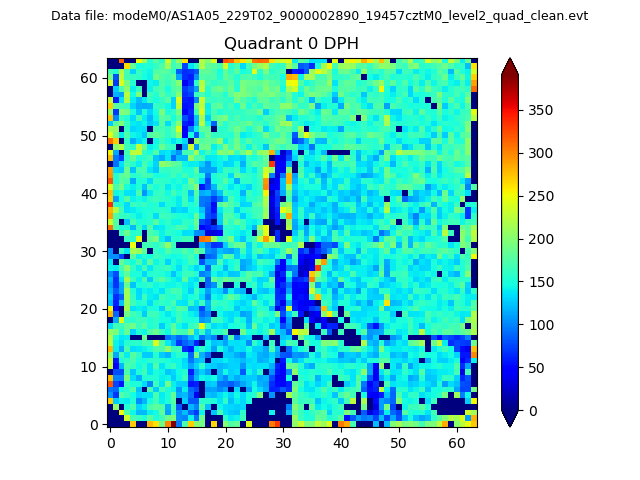 |
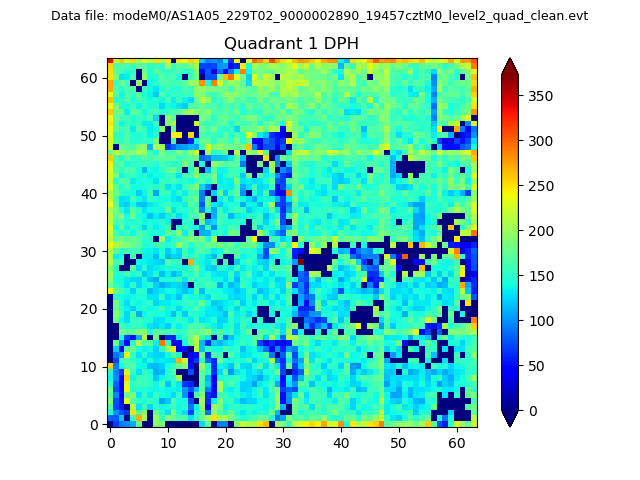 |
Quadrant B |
|---|---|---|---|
| Quadrant D | 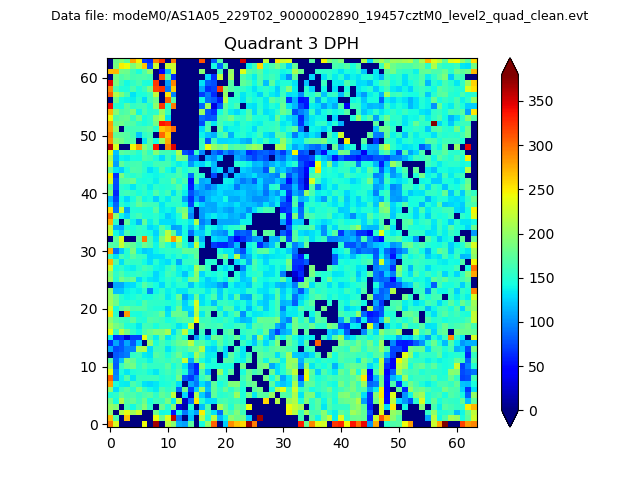 |
 |
Quadrant C |
| Plot type | Count rate plots | Images |
|---|---|---|
| Comparison with Poisson distribution Blue bars denote a histogram of data divided into 1 sec bins. Red curve is a Poisson curve with rate = median count rate of data. |
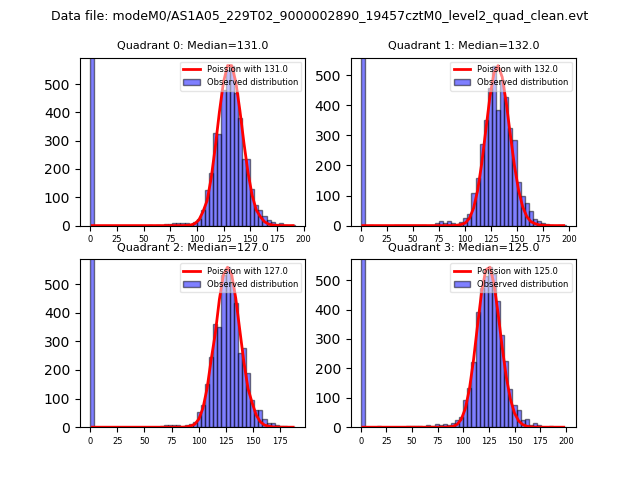 |
 |
| Quadrant-wise count rates Data is divided into 100 sec bins |
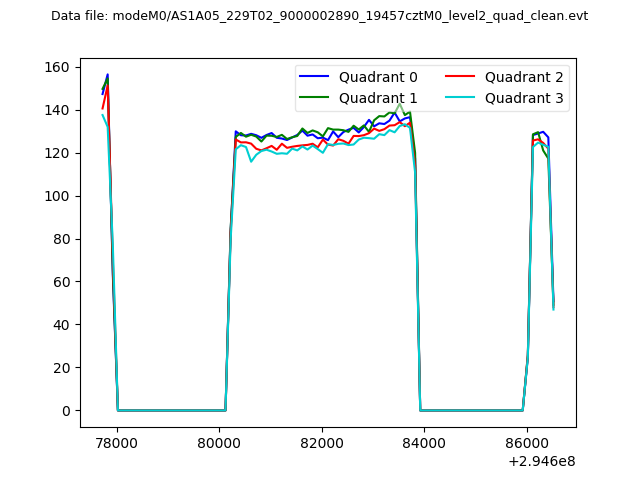 |
|
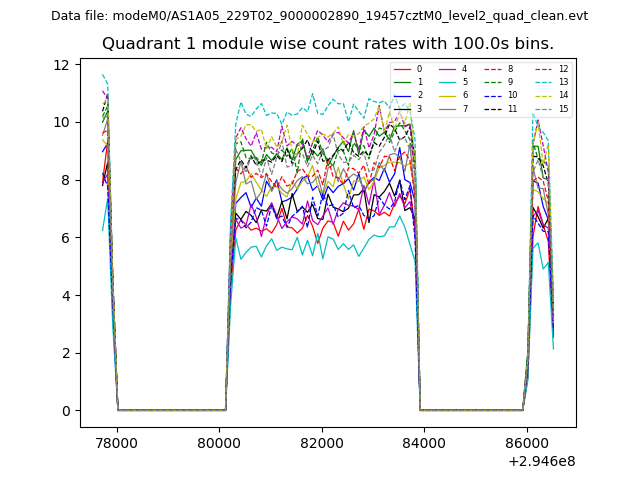
| Module-wise count rates for Quadrant A Data is divided into 100 sec bins |
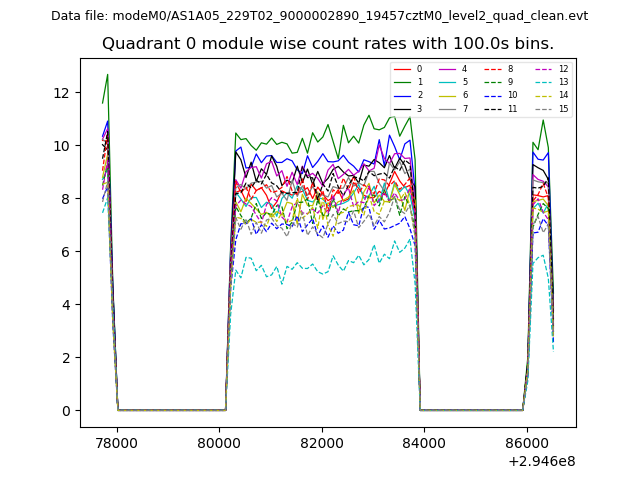 |
 |
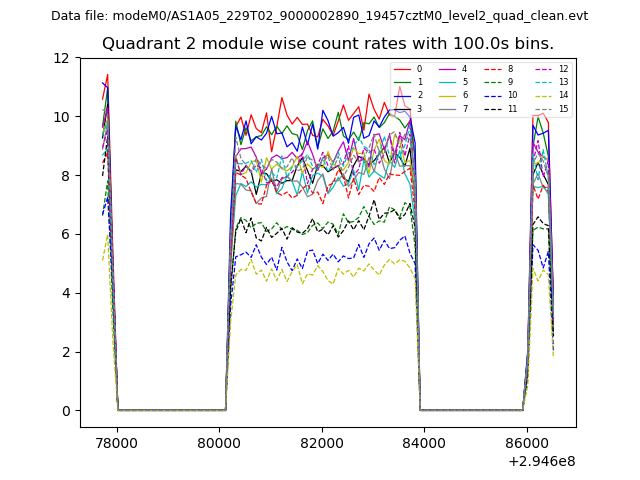
| Module-wise count rates for Quadrant B Data is divided into 100 sec bins |
 |
 |
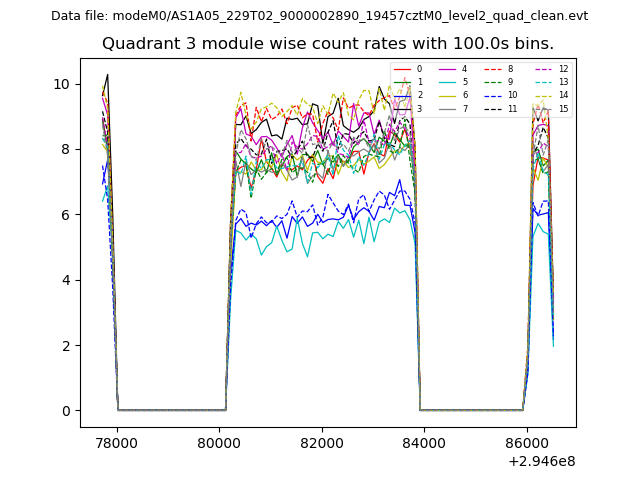
| Module-wise count rates for Quadrant C Data is divided into 100 sec bins |
 |
 |
| Module-wise count rates for Quadrant D Data is divided into 100 sec bins |
 |
 |
| Parameter | Plot |
|---|---|
| CZT HV Monitor | 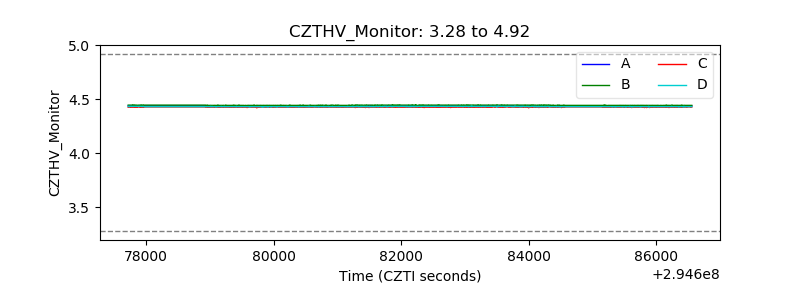 |
| D_VDD | 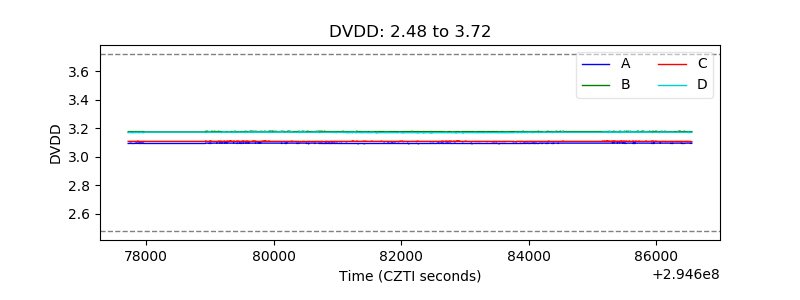 |
| Temperature 1 | 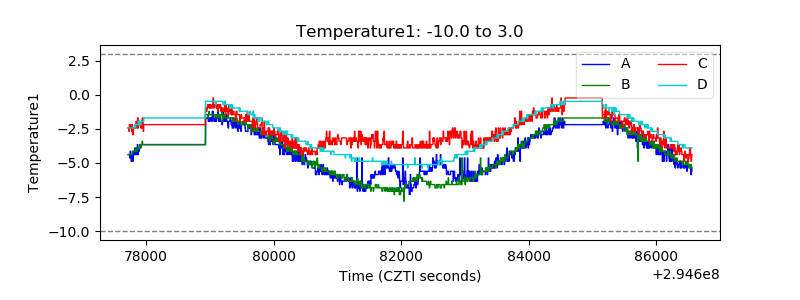 |
| Veto HV Monitor | 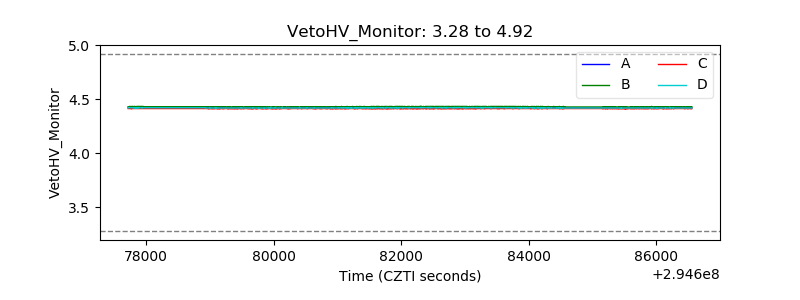 |
| Veto LLD | 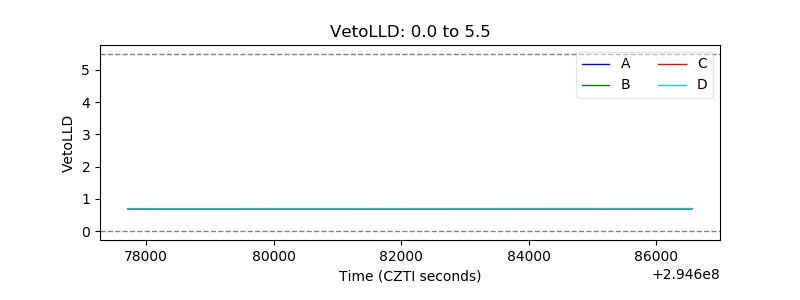 |
| Alpha Counter | 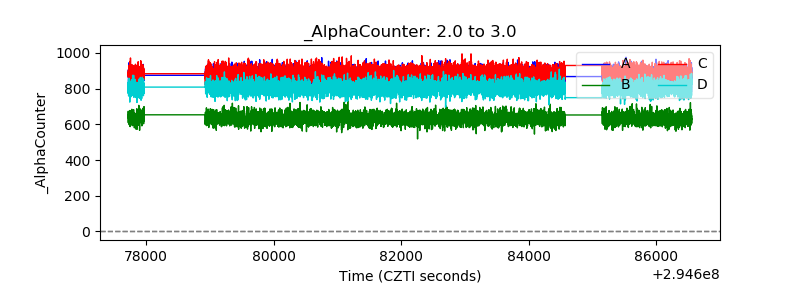 |
| _CPM_Rate | 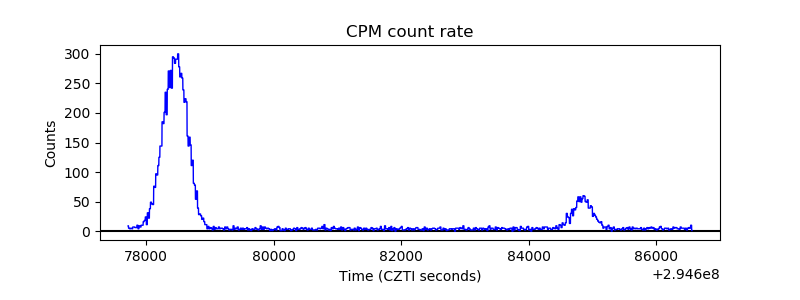 |
| CZT Counter | 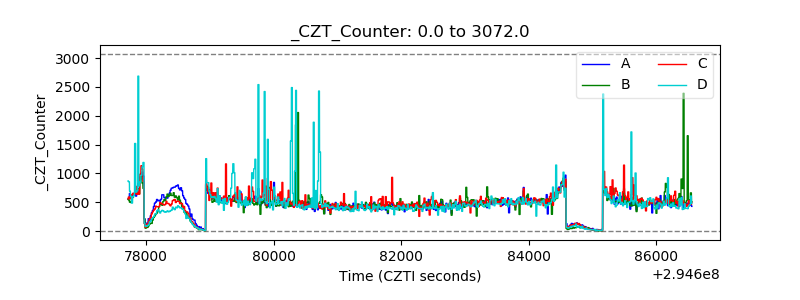 |
| +2.5 Volts monitor |  |
| +5 Volts monitor |  |
| _ROLL_ROT | 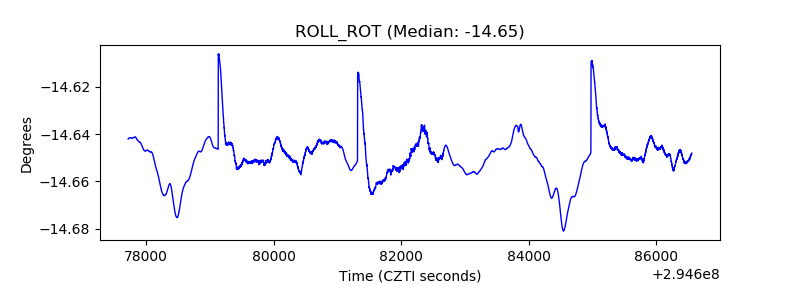 |
| _Roll_DEC | 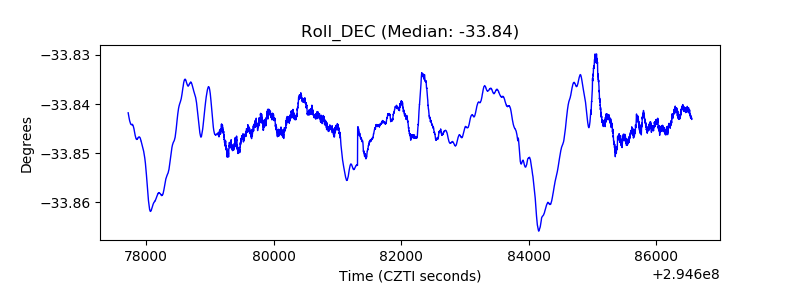 |
| _Roll_RA | 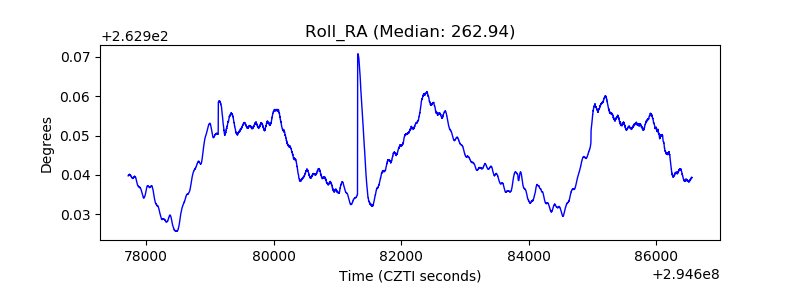 |
| Veto Counter | 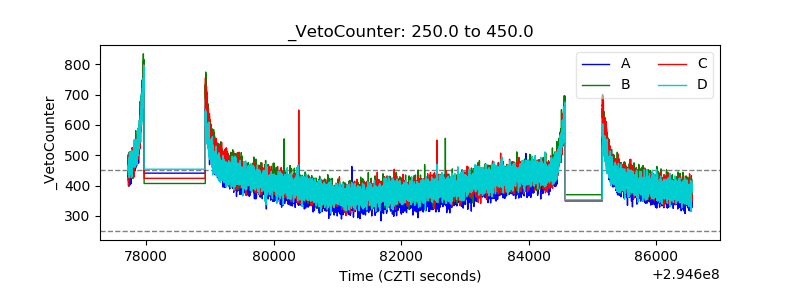 |