| Param | Original file | Final file |
|---|---|---|
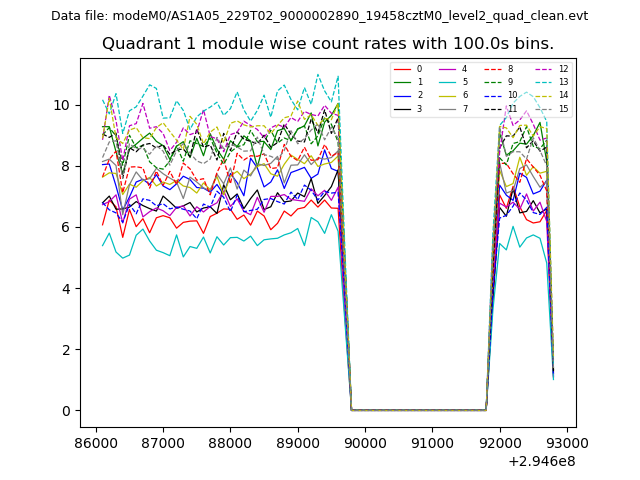
| Filename | modeM0/AS1A05_229T02_9000002890_19458cztM0_level2.evt | modeM0/AS1A05_229T02_9000002890_19458cztM0_level2_quad_clean.evt |
| Size (bytes) | 553,285,440 | 92,099,520 |
| Size | 527.7 MB | 87.8 MB |
| Events in quadrant A | 3,821,264 | 572,831 |
| Events in quadrant B | 4,000,869 | 573,522 |
| Events in quadrant C | 4,176,505 | 556,050 |
| Events in quadrant D | 4,231,073 | 547,233 |
| Mode M0 | |||
|---|---|---|---|
| Quadrant | BADHDUFLAG | Total packets | Discarded packets |
| A | 0 | 16308 | 2 |
| B | 0 | 16847 | 2 |
| C | 0 | 17289 | 2 |
| D | 0 | 17789 | 3 |
| Mode SS | |||
|---|---|---|---|
| Quadrant | BADHDUFLAG | Total packets | Discarded packets |
| A | 0 | 158 | 0 |
| B | 0 | 158 | 0 |
| C | 0 | 158 | 0 |
| D | 0 | 158 | 0 |
| Mode M9 | |||
|---|---|---|---|
| Quadrant | BADHDUFLAG | Total packets | Discarded packets |
| A | 0 | 10 | 0 |
| B | 0 | 10 | 0 |
| C | 0 | 10 | 0 |
| D | 0 | 10 | 0 |
| Quadrant | Total seconds | Saturated seconds | Saturation percentage |
|---|---|---|---|
| A | 7767 | 121 | 1.557873% |
| B | 7768 | 224 | 2.883625% |
| C | 7768 | 208 | 2.677652% |
| D | 7767 | 196 | 2.523497% |
Noise dominated data is calculated using 1-second bins in cleaned event files. If a bin has >2000 counts, and if more than 50% of those come from <1% of pixels, then it is considered to be noise-dominated and hence unusable.
| Quadrant | # 1 sec bins | Bins with >0 counts | Bins with >2000 counts | High rate bins dominated by noise | Noise dominated (total time) | Noise dominated (detector-on time) | Marked lightcurve |
|---|---|---|---|---|---|---|---|
| A | 8627 | 7770 | 1 | 1 | 0.01% | 0.01% | 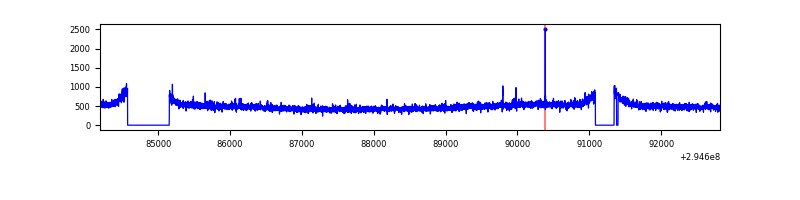 |
| B | 8628 | 7770 | 45 | 45 | 0.52% | 0.58% | 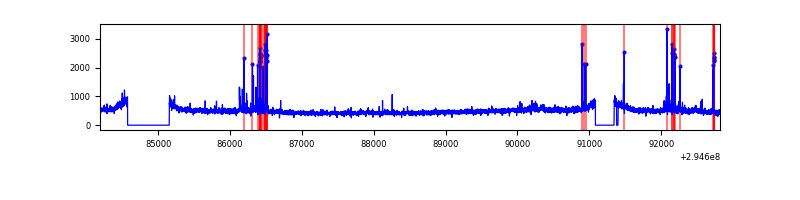 |
| C | 8628 | 7771 | 4 | 4 | 0.05% | 0.05% | 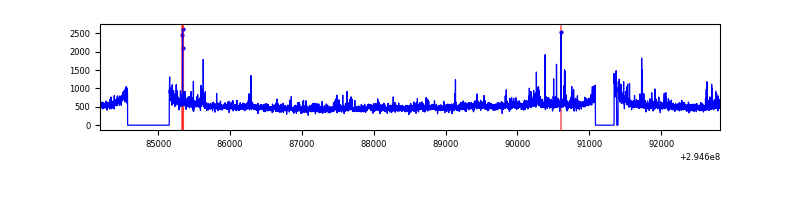 |
| D | 8627 | 7770 | 129 | 129 | 1.50% | 1.66% | 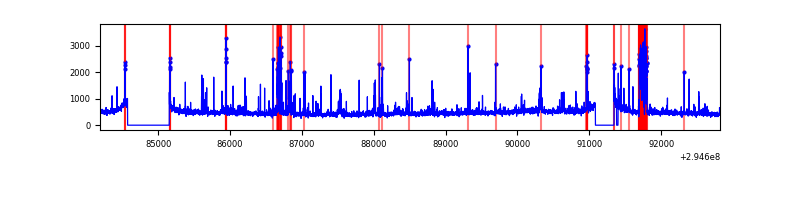 |
Top three noisy pixels from each quadrant. If the there are fewer than three noisy pixels in the level2.evt file, extra rows are filled as -1
| Pixel properties | Quadrant properties | ||||||
|---|---|---|---|---|---|---|---|
| Quadrant | DetID | PixID | Counts | Sigma | Mean | Median | Sigma |
| A | 11 | 29 | 44929 | 223.36 | 968 | 946 | 196.9 |
| A | 3 | 1 | 22984 | 111.92 | 968 | 946 | 196.9 |
| A | 4 | 2 | 13231 | 62.39 | 968 | 946 | 196.9 |
| B | 7 | 220 | 129335 | 689.77 | 961 | 936 | 186.1 |
| B | 3 | 64 | 38761 | 203.2 | 961 | 936 | 186.1 |
| B | 0 | 197 | 25914 | 134.18 | 961 | 936 | 186.1 |
| C | 9 | 221 | 238633 | 1092.32 | 925 | 931 | 217.6 |
| C | 14 | 238 | 146015 | 666.71 | 925 | 931 | 217.6 |
| C | 3 | 233 | 115630 | 527.08 | 925 | 931 | 217.6 |
| D | 1 | 52 | 476242 | 2071.65 | 935 | 906 | 229.4 |
| D | 5 | 222 | 114529 | 495.2 | 935 | 906 | 229.4 |
| D | 7 | 238 | 66072 | 284.01 | 935 | 906 | 229.4 |
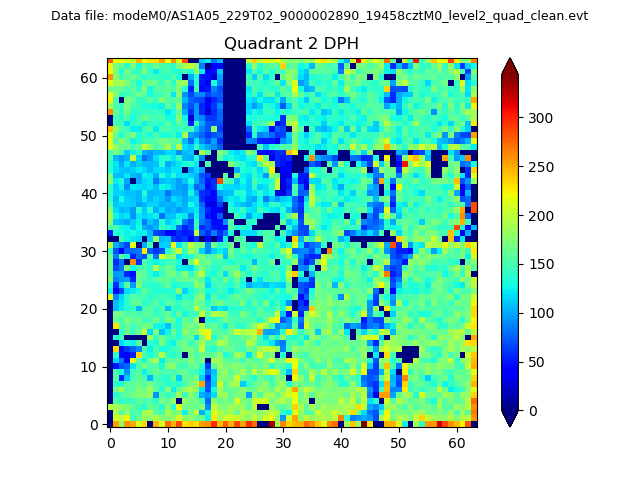
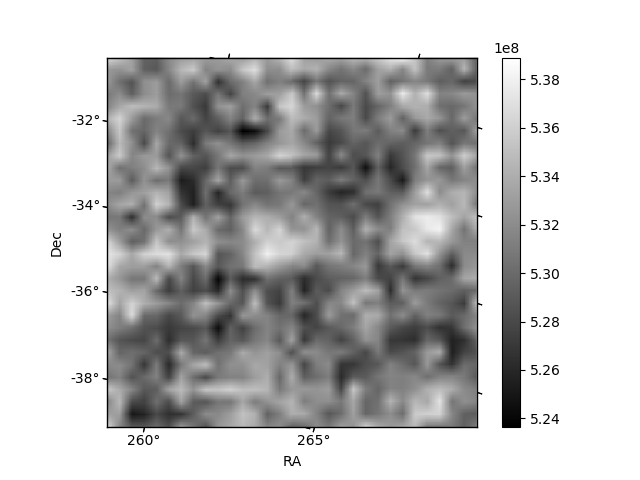
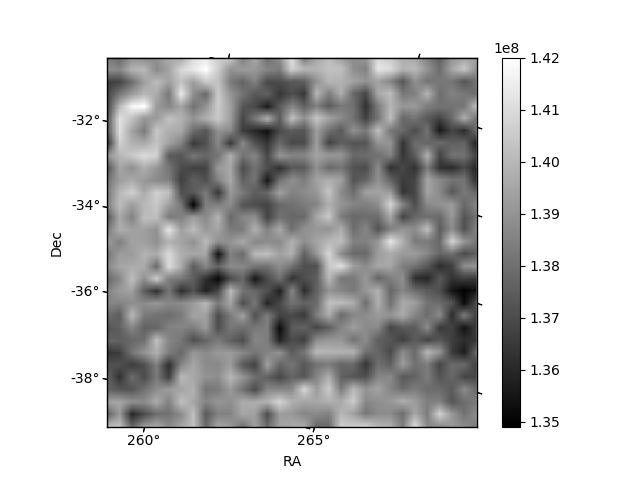
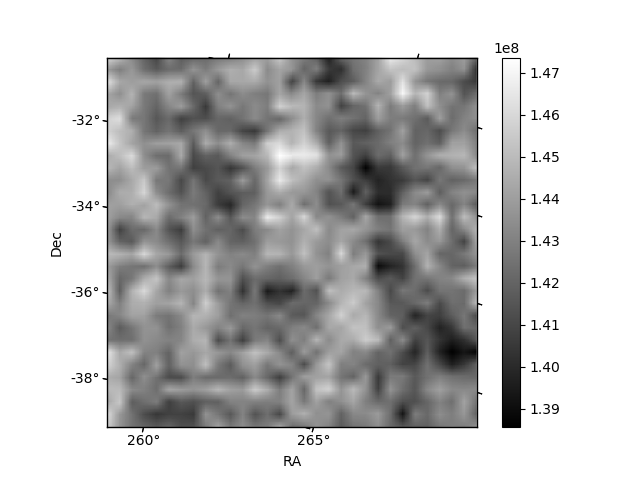
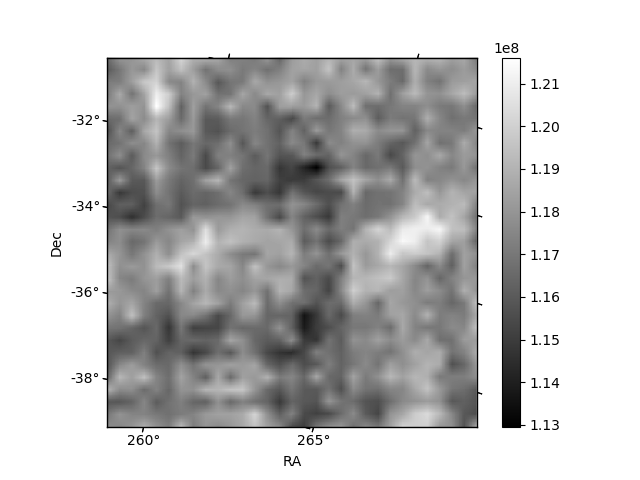
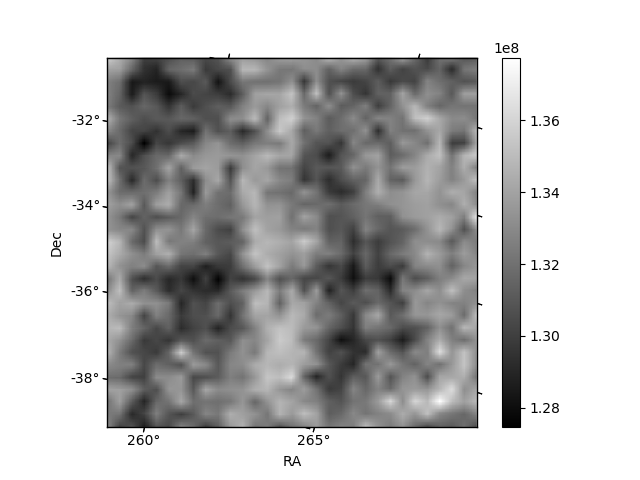
Histogram calculated using DETX and DETY for each event in the final _common_clean file
| Quadrant A | 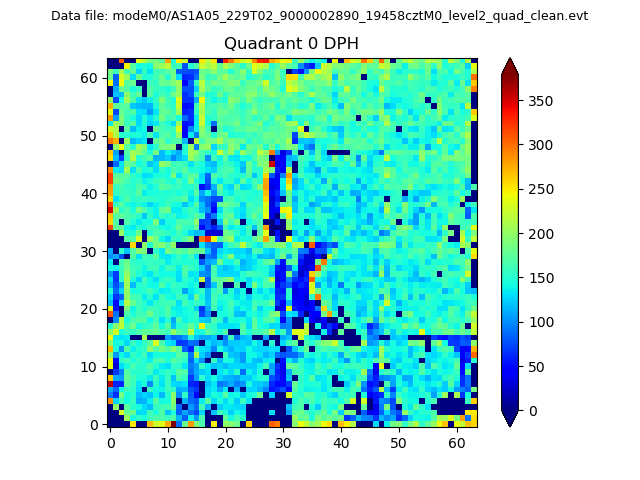 |
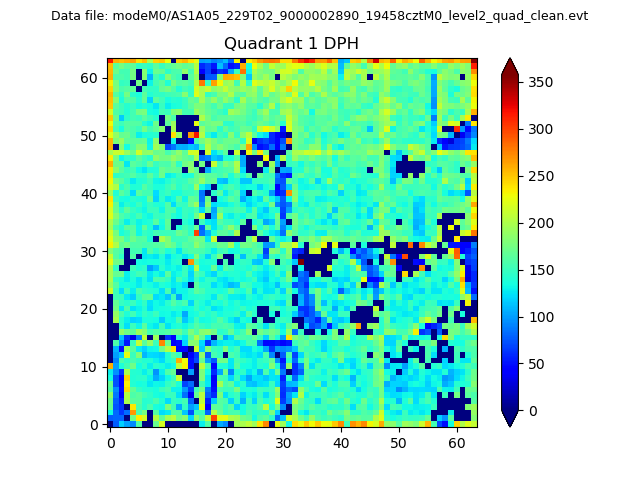 |
Quadrant B |
|---|---|---|---|
| Quadrant D | 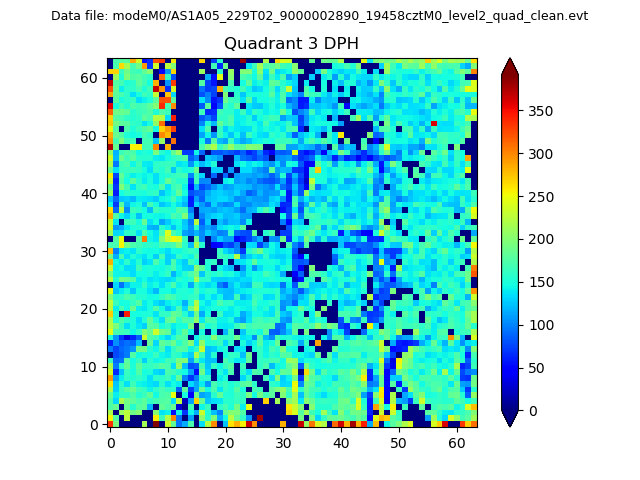 |
 |
Quadrant C |
| Plot type | Count rate plots | Images |
|---|---|---|
| Comparison with Poisson distribution Blue bars denote a histogram of data divided into 1 sec bins. Red curve is a Poisson curve with rate = median count rate of data. |
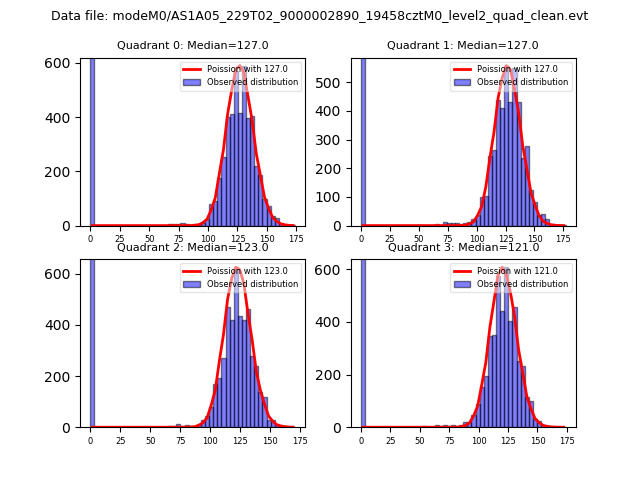 |
 |
| Quadrant-wise count rates Data is divided into 100 sec bins |
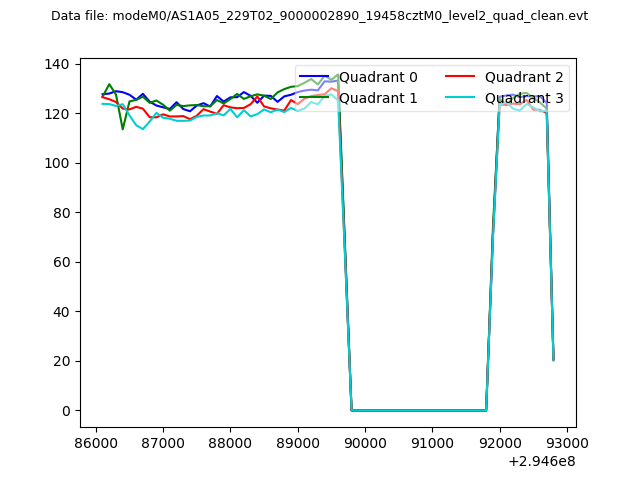 |
|
| Module-wise count rates for Quadrant A Data is divided into 100 sec bins |
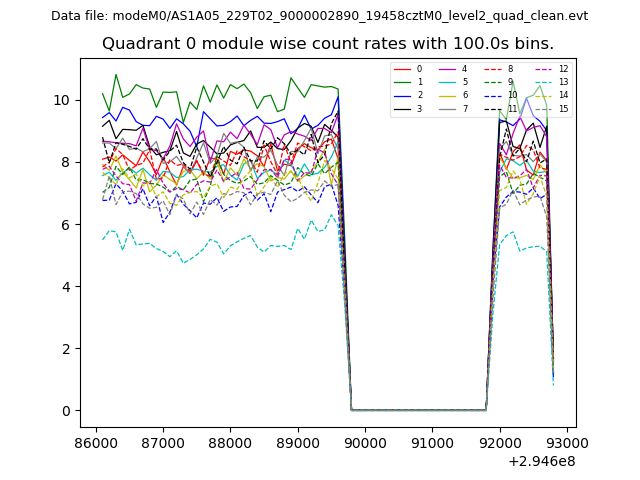 |
 |
| Module-wise count rates for Quadrant B Data is divided into 100 sec bins |
 |
 |
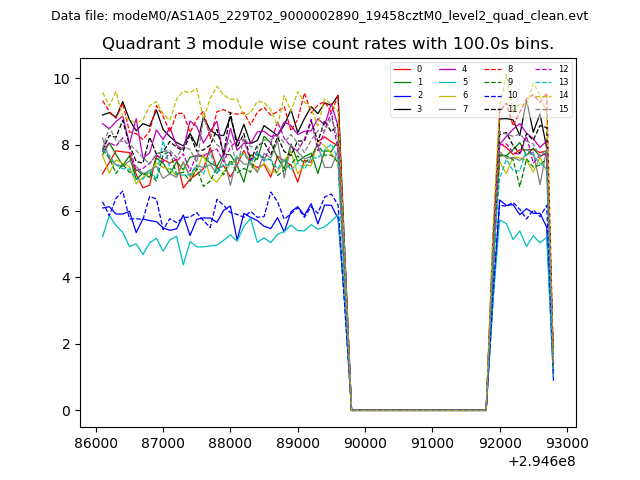
| Module-wise count rates for Quadrant C Data is divided into 100 sec bins |
 |
 |
| Module-wise count rates for Quadrant D Data is divided into 100 sec bins |
 |
 |
| Parameter | Plot |
|---|---|
| CZT HV Monitor | 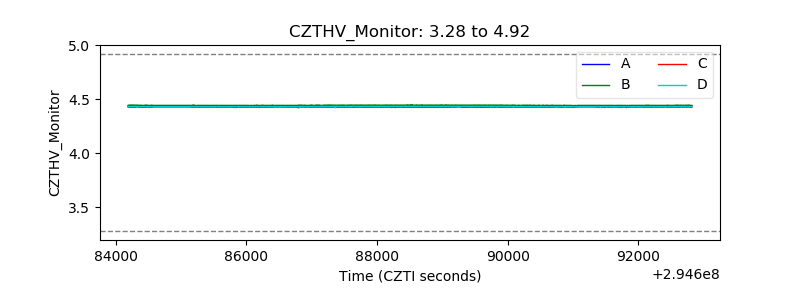 |
| D_VDD | 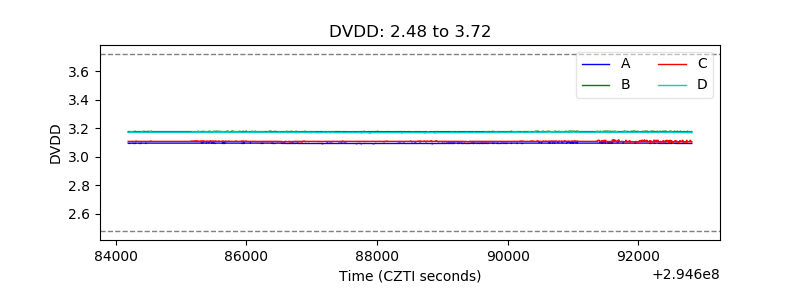 |
| Temperature 1 | 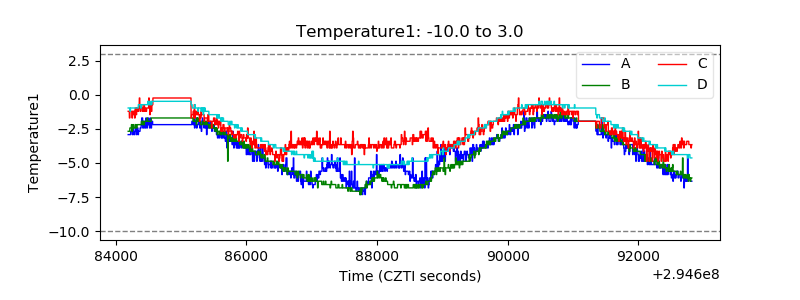 |
| Veto HV Monitor | 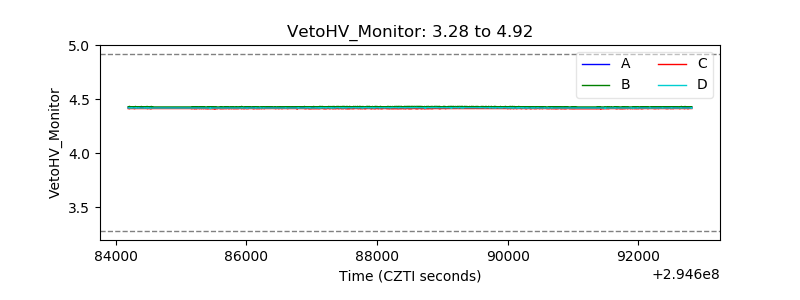 |
| Veto LLD | 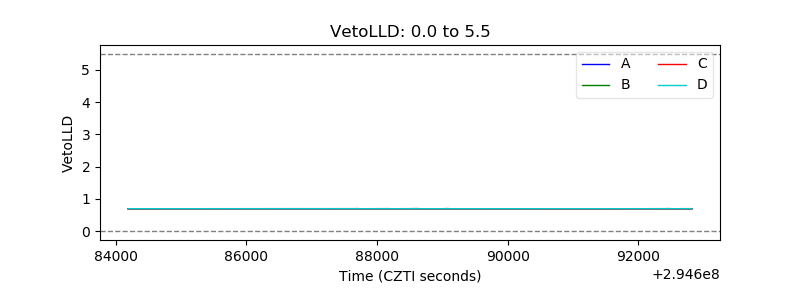 |
| Alpha Counter | 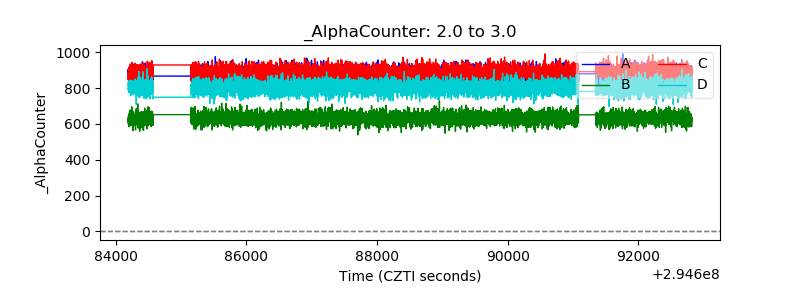 |
| _CPM_Rate | 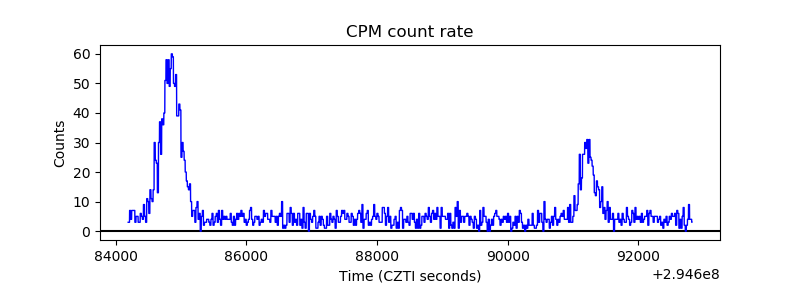 |
| CZT Counter |  |
| +2.5 Volts monitor |  |
| +5 Volts monitor | 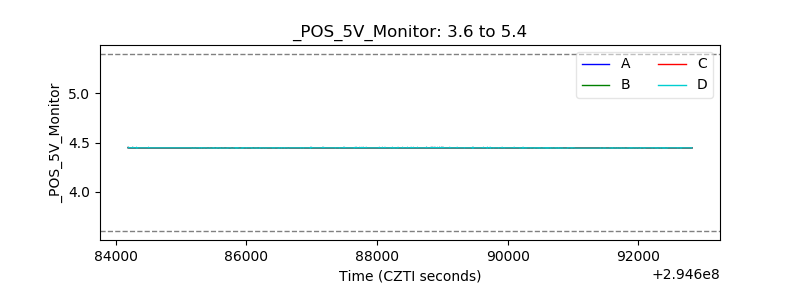 |
| _ROLL_ROT | 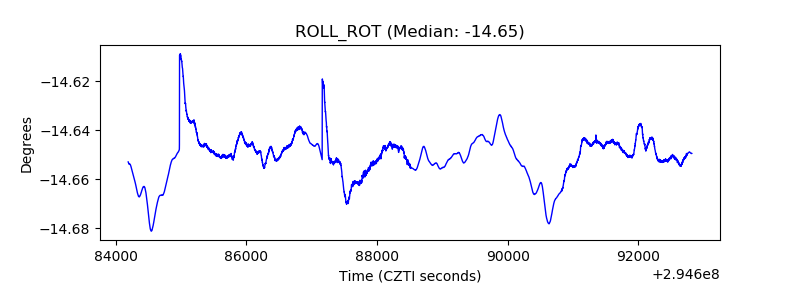 |
| _Roll_DEC | 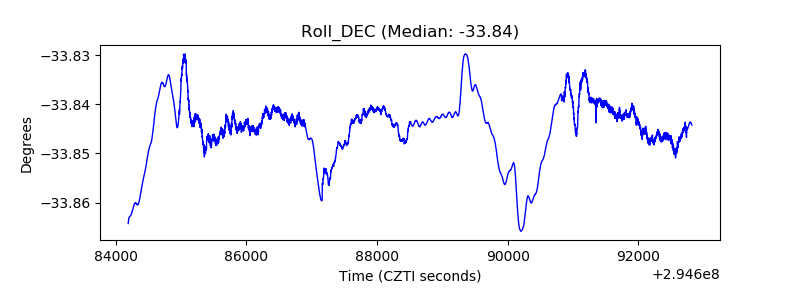 |
| _Roll_RA | 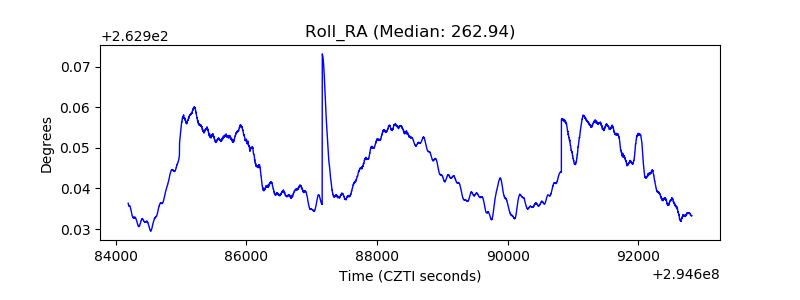 |
| Veto Counter | 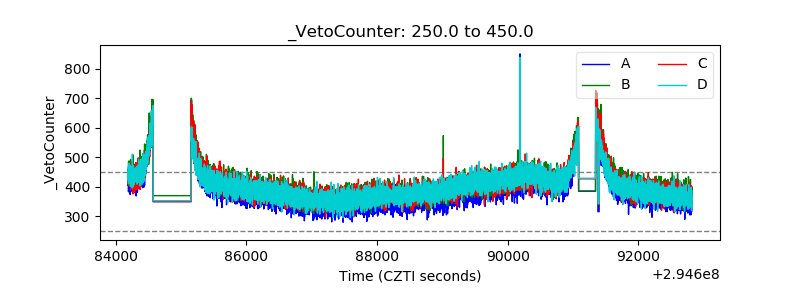 |