| Param | Original file | Final file |
|---|---|---|
| Filename | modeM0/AS1A05_229T02_9000002890_19459cztM0_level2.evt | modeM0/AS1A05_229T02_9000002890_19459cztM0_level2_quad_clean.evt |
| Size (bytes) | 613,321,920 | 99,694,080 |
| Size | 584.9 MB | 95.1 MB |
| Events in quadrant A | 3,764,805 | 636,632 |
| Events in quadrant B | 3,805,900 | 643,935 |
| Events in quadrant C | 4,066,496 | 621,902 |
| Events in quadrant D | 6,420,925 | 586,862 |
| Mode M0 | |||
|---|---|---|---|
| Quadrant | BADHDUFLAG | Total packets | Discarded packets |
| A | 0 | 16102 | 2 |
| B | 0 | 16269 | 2 |
| C | 0 | 16785 | 3 |
| D | 0 | 24357 | 2 |
| Mode SS | |||
|---|---|---|---|
| Quadrant | BADHDUFLAG | Total packets | Discarded packets |
| A | 0 | 154 | 0 |
| B | 0 | 154 | 0 |
| C | 0 | 154 | 0 |
| D | 0 | 154 | 0 |
| Mode M9 | |||
|---|---|---|---|
| Quadrant | BADHDUFLAG | Total packets | Discarded packets |
| A | 0 | 8 | 0 |
| B | 0 | 8 | 0 |
| C | 0 | 8 | 0 |
| D | 0 | 8 | 0 |
| Quadrant | Total seconds | Saturated seconds | Saturation percentage |
|---|---|---|---|
| A | 7630 | 82 | 1.074705% |
| B | 7631 | 138 | 1.808413% |
| C | 7630 | 171 | 2.241153% |
| D | 7630 | 827 | 10.838794% |
Noise dominated data is calculated using 1-second bins in cleaned event files. If a bin has >2000 counts, and if more than 50% of those come from <1% of pixels, then it is considered to be noise-dominated and hence unusable.
| Quadrant | # 1 sec bins | Bins with >0 counts | Bins with >2000 counts | High rate bins dominated by noise | Noise dominated (total time) | Noise dominated (detector-on time) | Marked lightcurve |
|---|---|---|---|---|---|---|---|
| A | 8250 | 7633 | 3 | 3 | 0.04% | 0.04% | 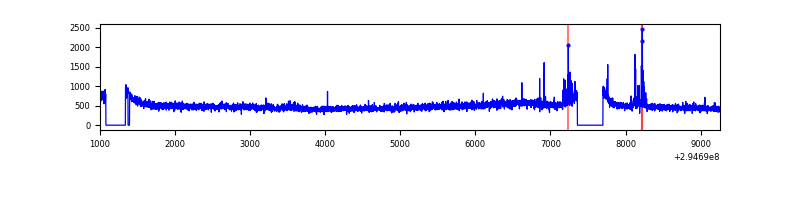 |
| B | 8251 | 7634 | 16 | 16 | 0.19% | 0.21% | 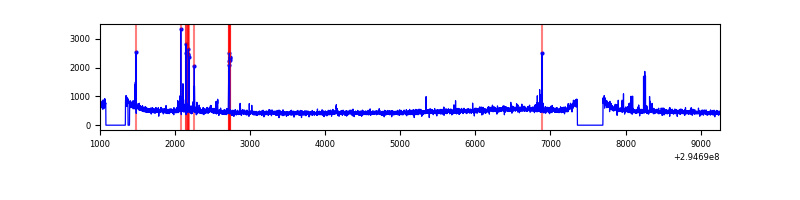 |
| C | 8250 | 7633 | 9 | 9 | 0.11% | 0.12% | 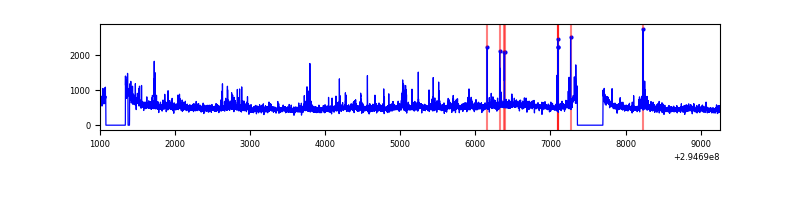 |
| D | 8250 | 7633 | 687 | 687 | 8.33% | 9.00% | 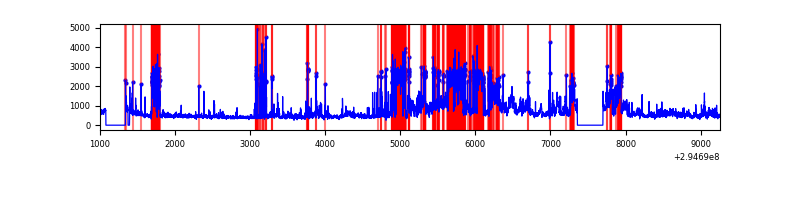 |
Top three noisy pixels from each quadrant. If the there are fewer than three noisy pixels in the level2.evt file, extra rows are filled as -1
| Pixel properties | Quadrant properties | ||||||
|---|---|---|---|---|---|---|---|
| Quadrant | DetID | PixID | Counts | Sigma | Mean | Median | Sigma |
| A | 4 | 2 | 88478 | 461.25 | 931 | 913 | 189.8 |
| A | 11 | 29 | 43344 | 223.51 | 931 | 913 | 189.8 |
| A | 5 | 16 | 20078 | 100.95 | 931 | 913 | 189.8 |
| B | 7 | 220 | 45026 | 244.9 | 932 | 906 | 180.2 |
| B | 0 | 197 | 41153 | 223.4 | 932 | 906 | 180.2 |
| B | 3 | 64 | 31480 | 169.71 | 932 | 906 | 180.2 |
| C | 9 | 221 | 253649 | 1201.07 | 895 | 901 | 210.4 |
| C | 14 | 238 | 139411 | 658.21 | 895 | 901 | 210.4 |
| C | 3 | 233 | 108349 | 510.6 | 895 | 901 | 210.4 |
| D | 1 | 52 | 3030819 | 14573.01 | 858 | 831 | 207.9 |
| D | 5 | 222 | 42451 | 200.17 | 858 | 831 | 207.9 |
| D | 7 | 238 | 36979 | 173.85 | 858 | 831 | 207.9 |
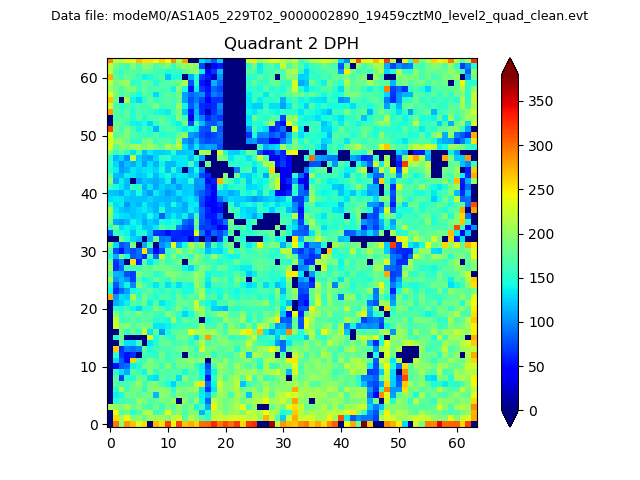
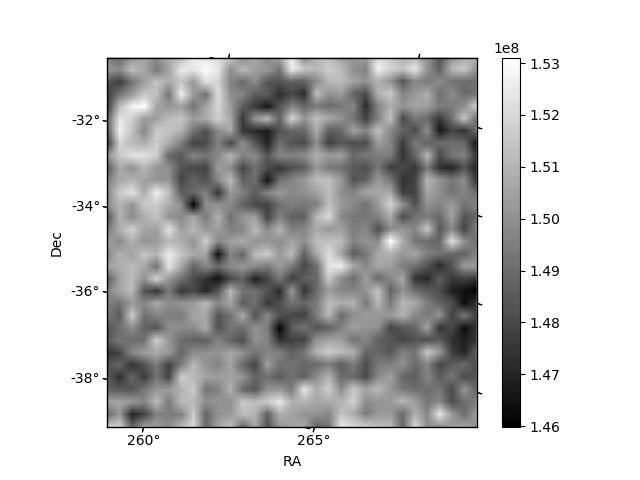
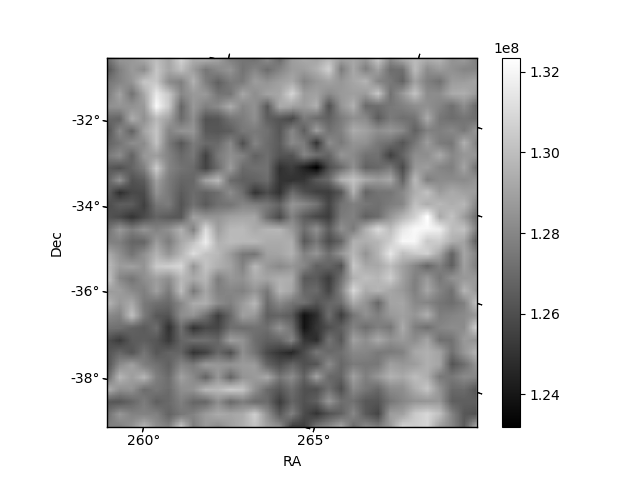
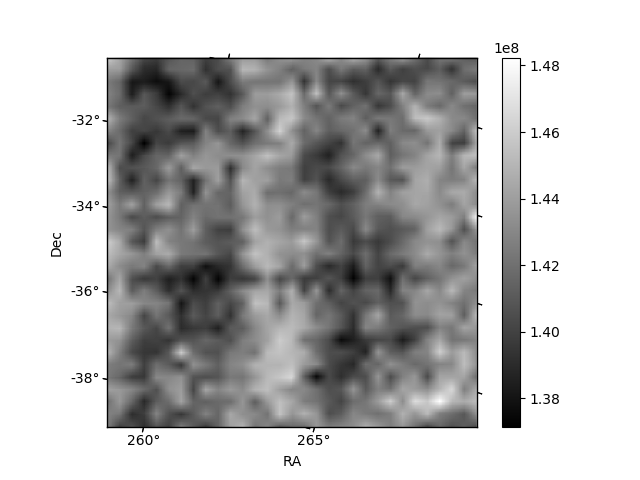
Histogram calculated using DETX and DETY for each event in the final _common_clean file
| Quadrant A |  |
 |
Quadrant B |
|---|---|---|---|
| Quadrant D | 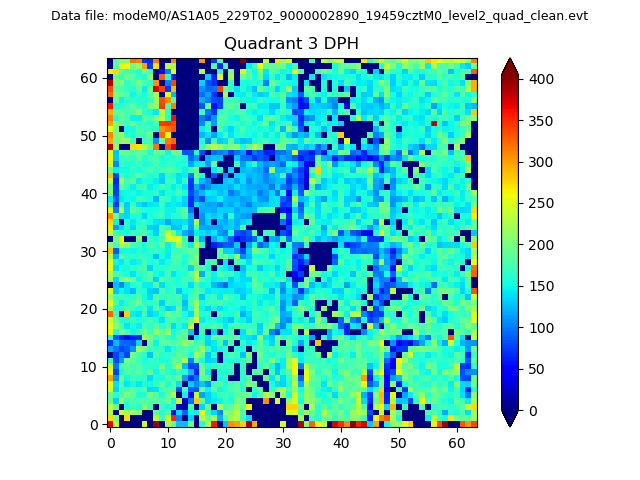 |
 |
Quadrant C |
| Plot type | Count rate plots | Images |
|---|---|---|
| Comparison with Poisson distribution Blue bars denote a histogram of data divided into 1 sec bins. Red curve is a Poisson curve with rate = median count rate of data. |
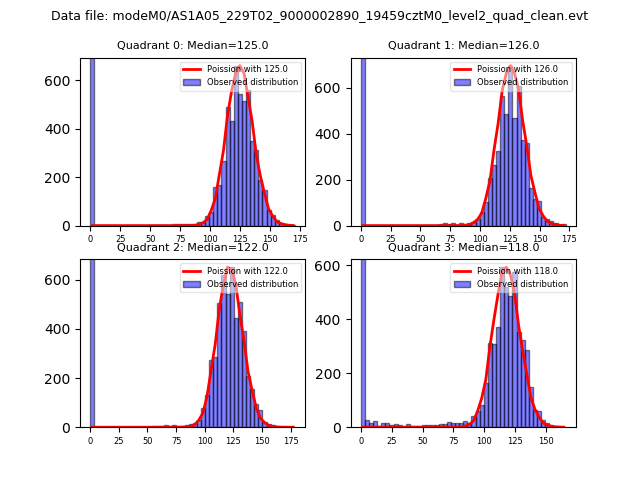 |
 |
| Quadrant-wise count rates Data is divided into 100 sec bins |
 |
|
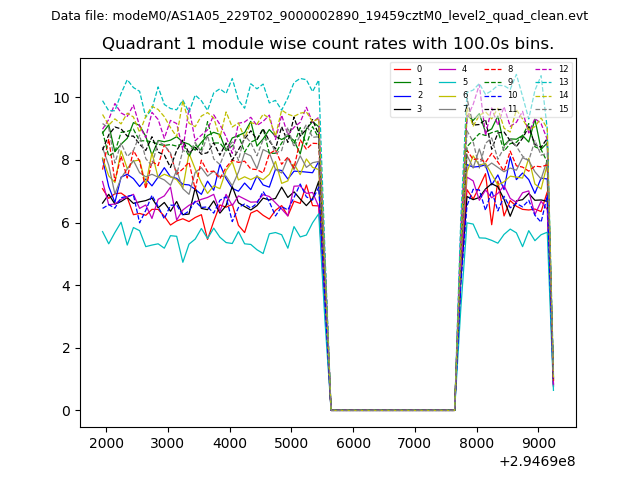
| Module-wise count rates for Quadrant A Data is divided into 100 sec bins |
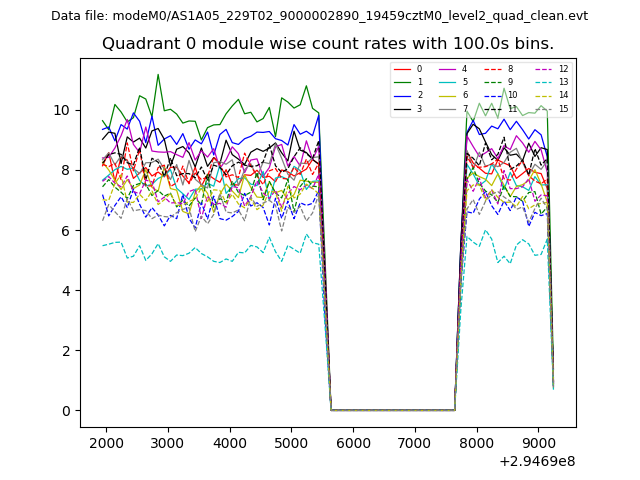 |
 |
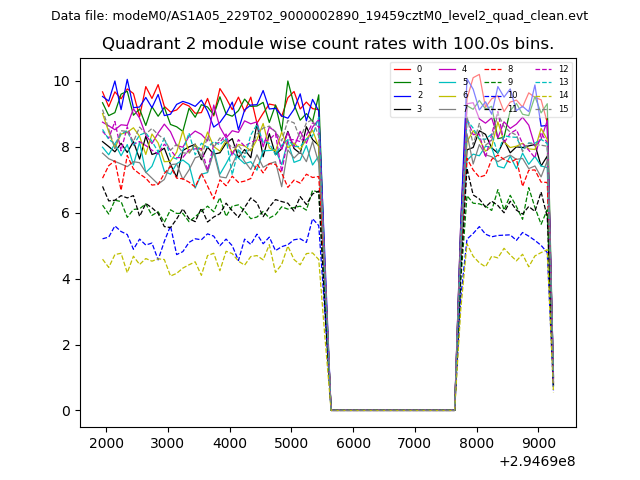
| Module-wise count rates for Quadrant B Data is divided into 100 sec bins |
 |
 |
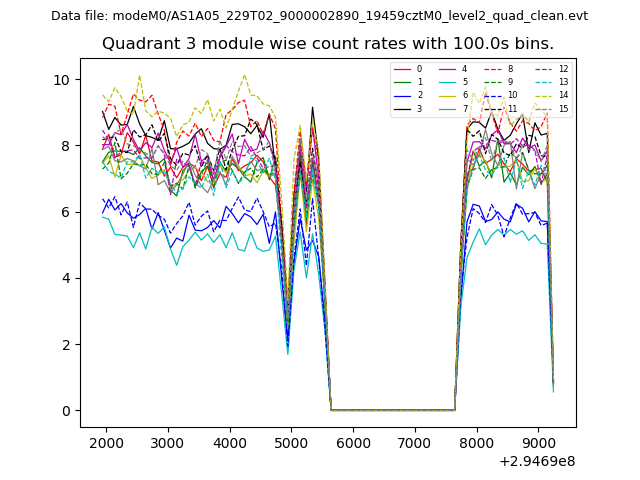
| Module-wise count rates for Quadrant C Data is divided into 100 sec bins |
 |
 |
| Module-wise count rates for Quadrant D Data is divided into 100 sec bins |
 |
 |
| Parameter | Plot |
|---|---|
| CZT HV Monitor | 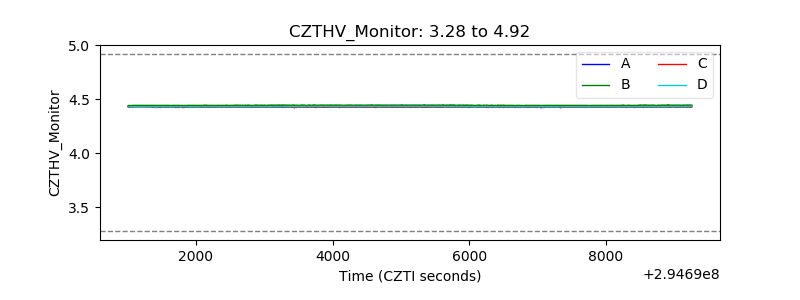 |
| D_VDD | 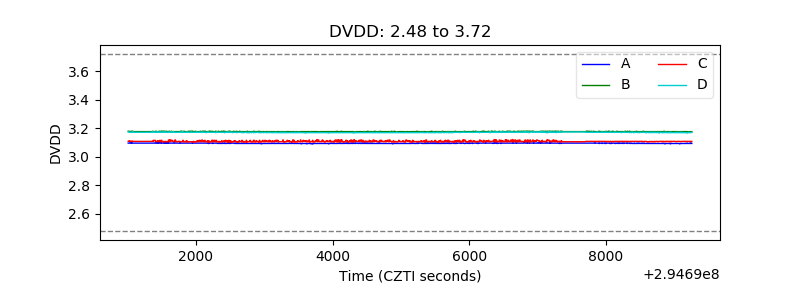 |
| Temperature 1 | 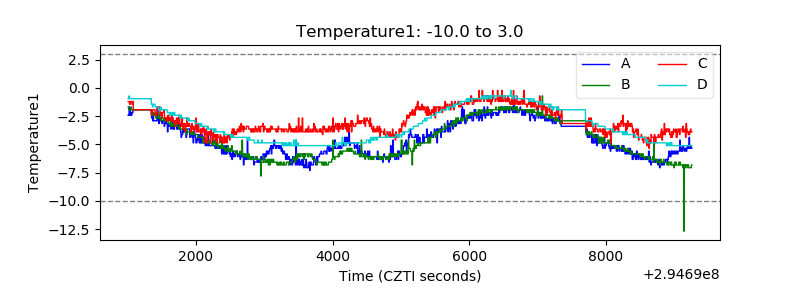 |
| Veto HV Monitor |  |
| Veto LLD |  |
| Alpha Counter | 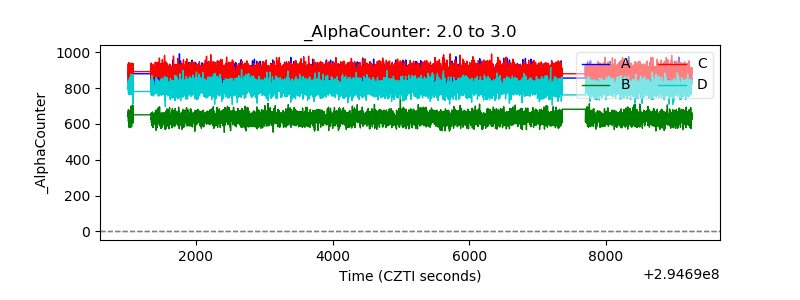 |
| _CPM_Rate | 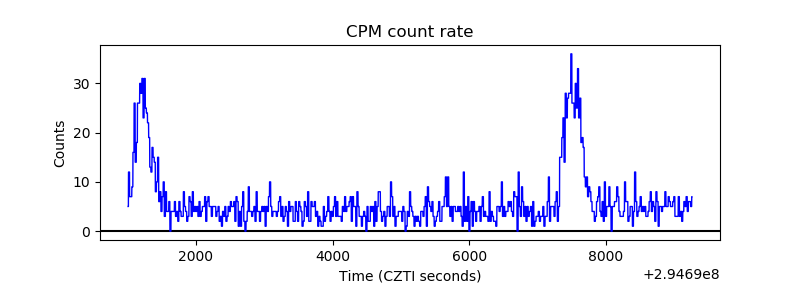 |
| CZT Counter | 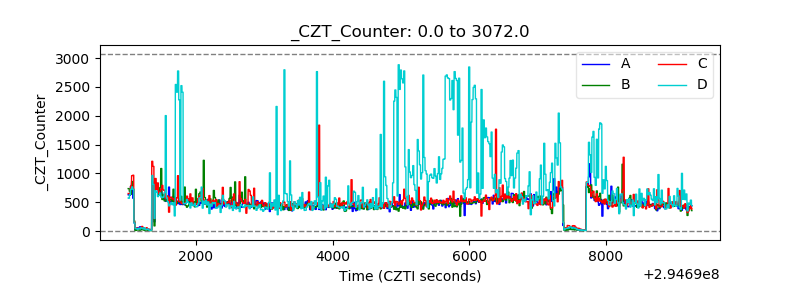 |
| +2.5 Volts monitor | 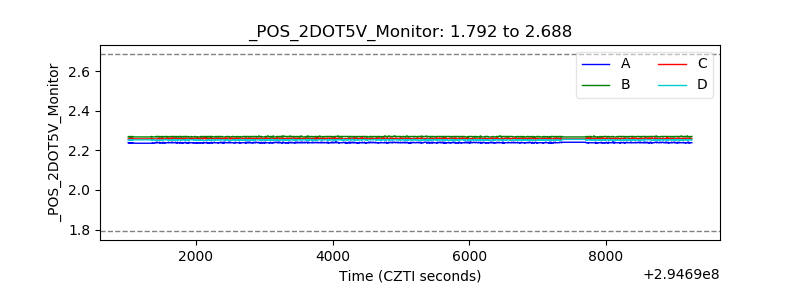 |
| +5 Volts monitor |  |
| _ROLL_ROT | 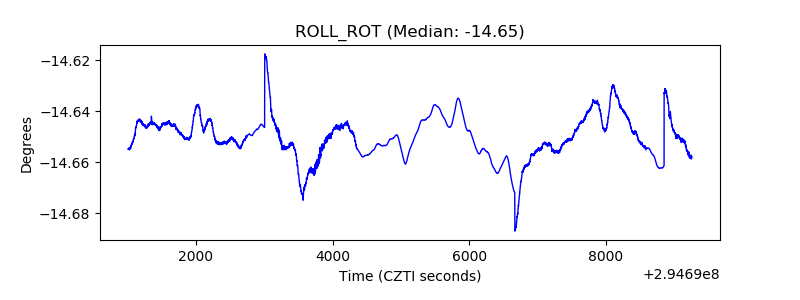 |
| _Roll_DEC | 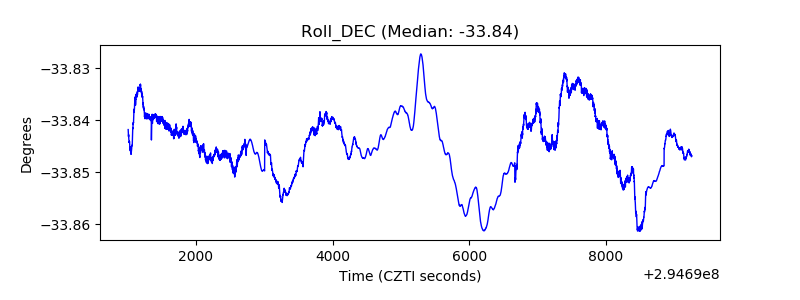 |
| _Roll_RA |  |
| Veto Counter | 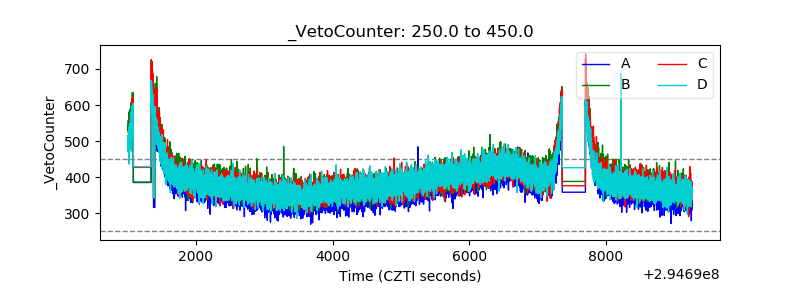 |