| Param | Original file | Final file |
|---|---|---|
| Filename | modeM0/AS1A05_229T02_9000002890_19466cztM0_level2.evt | modeM0/AS1A05_229T02_9000002890_19466cztM0_level2_quad_clean.evt |
| Size (bytes) | 2,093,716,800 | 336,925,440 |
| Size | 1.9 GB | 321.3 MB |
| Events in quadrant A | 13,559,242 | 2,147,720 |
| Events in quadrant B | 13,655,551 | 2,184,551 |
| Events in quadrant C | 14,056,808 | 2,109,826 |
| Events in quadrant D | 20,310,609 | 1,900,177 |
| Mode M0 | |||
|---|---|---|---|
| Quadrant | BADHDUFLAG | Total packets | Discarded packets |
| A | 0 | 57340 | 5 |
| B | 0 | 57490 | 6 |
| C | 0 | 58084 | 5 |
| D | 0 | 77825 | 5 |
| Mode SS | |||
|---|---|---|---|
| Quadrant | BADHDUFLAG | Total packets | Discarded packets |
| A | 0 | 550 | 0 |
| B | 0 | 550 | 0 |
| C | 0 | 550 | 0 |
| D | 0 | 550 | 0 |
| Mode M9 | |||
|---|---|---|---|
| Quadrant | BADHDUFLAG | Total packets | Discarded packets |
| A | 0 | 48 | 0 |
| B | 0 | 48 | 0 |
| C | 0 | 48 | 0 |
| D | 0 | 48 | 0 |
| Quadrant | Total seconds | Saturated seconds | Saturation percentage |
|---|---|---|---|
| A | 27085 | 158 | 0.583349% |
| B | 27085 | 254 | 0.937788% |
| C | 27085 | 308 | 1.137161% |
| D | 27085 | 1853 | 6.841425% |
Noise dominated data is calculated using 1-second bins in cleaned event files. If a bin has >2000 counts, and if more than 50% of those come from <1% of pixels, then it is considered to be noise-dominated and hence unusable.
| Quadrant | # 1 sec bins | Bins with >0 counts | Bins with >2000 counts | High rate bins dominated by noise | Noise dominated (total time) | Noise dominated (detector-on time) | Marked lightcurve |
|---|---|---|---|---|---|---|---|
| A | 31771 | 27089 | 36 | 36 | 0.11% | 0.13% | 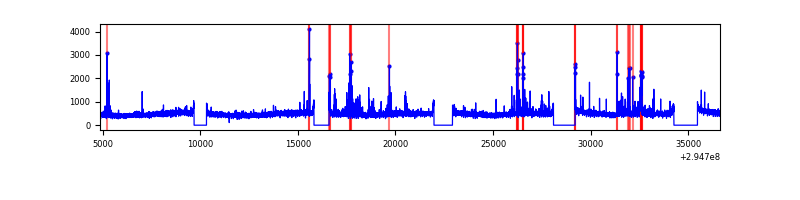 |
| B | 31771 | 27089 | 74 | 74 | 0.23% | 0.27% | 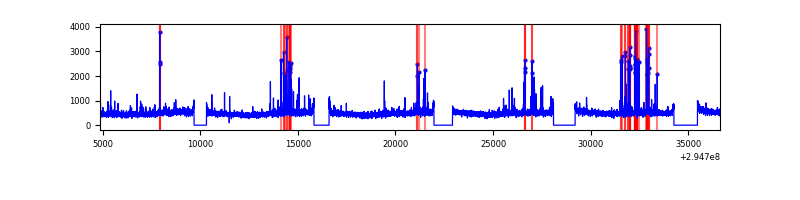 |
| C | 31771 | 27089 | 6 | 6 | 0.02% | 0.02% | 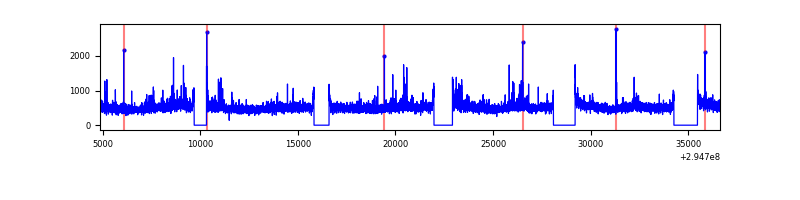 |
| D | 31771 | 27088 | 1572 | 1572 | 4.95% | 5.80% | 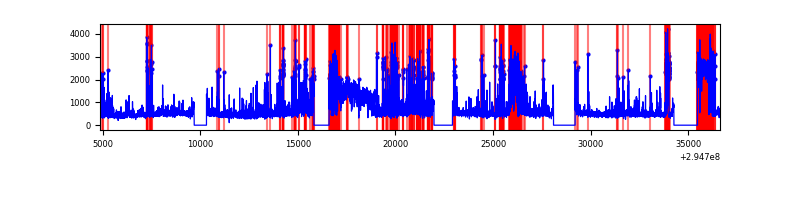 |
Top three noisy pixels from each quadrant. If the there are fewer than three noisy pixels in the level2.evt file, extra rows are filled as -1
| Pixel properties | Quadrant properties | ||||||
|---|---|---|---|---|---|---|---|
| Quadrant | DetID | PixID | Counts | Sigma | Mean | Median | Sigma |
| A | 5 | 16 | 466388 | 691.57 | 3337 | 3267 | 669.7 |
| A | 3 | 1 | 79176 | 113.35 | 3337 | 3267 | 669.7 |
| A | 4 | 2 | 65505 | 92.94 | 3337 | 3267 | 669.7 |
| B | 6 | 36 | 186205 | 292.48 | 3311 | 3225 | 625.6 |
| B | 7 | 220 | 159105 | 249.17 | 3311 | 3225 | 625.6 |
| B | 0 | 190 | 87975 | 135.47 | 3311 | 3225 | 625.6 |
| C | 9 | 221 | 589633 | 781.76 | 3223 | 3246 | 750.1 |
| C | 14 | 238 | 498852 | 660.73 | 3223 | 3246 | 750.1 |
| C | 3 | 233 | 336054 | 443.69 | 3223 | 3246 | 750.1 |
| D | 1 | 52 | 7283316 | 9636.66 | 3127 | 3042 | 755.5 |
| D | 12 | 225 | 986800 | 1302.17 | 3127 | 3042 | 755.5 |
| D | 2 | 234 | 117875 | 152.0 | 3127 | 3042 | 755.5 |
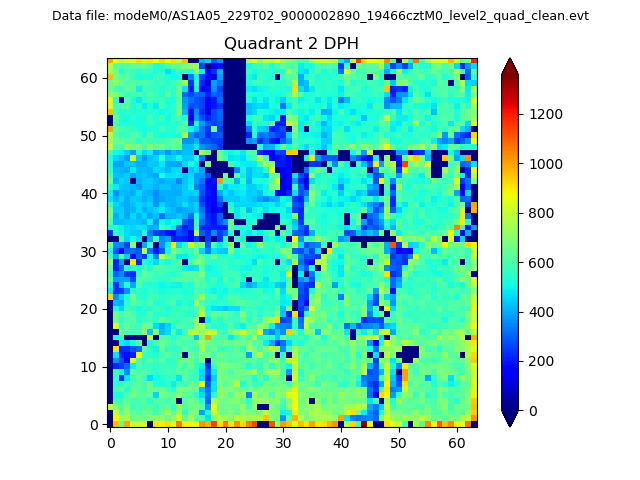
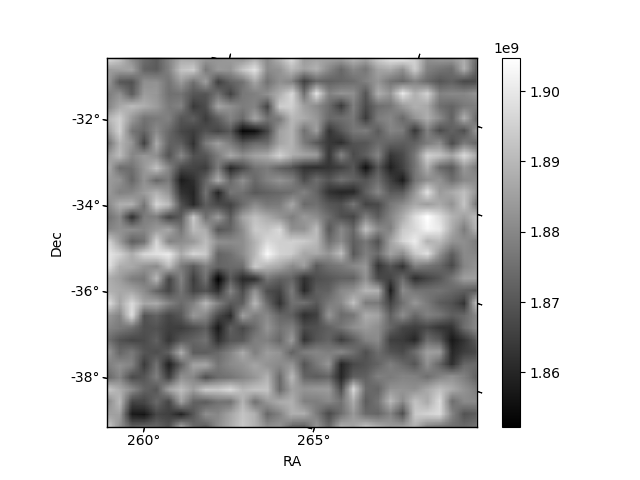
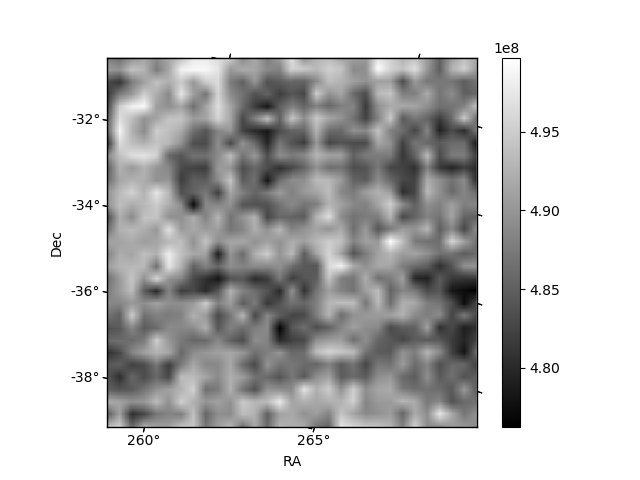
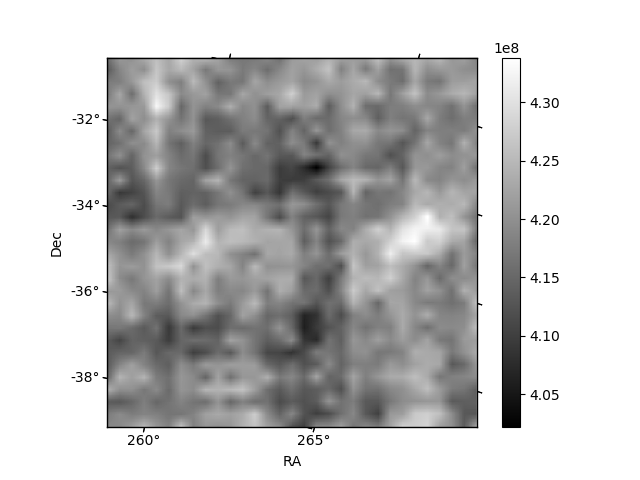
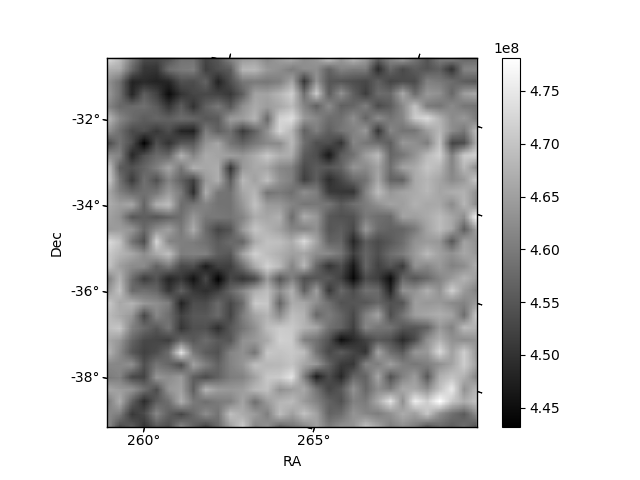
Histogram calculated using DETX and DETY for each event in the final _common_clean file
| Quadrant A | 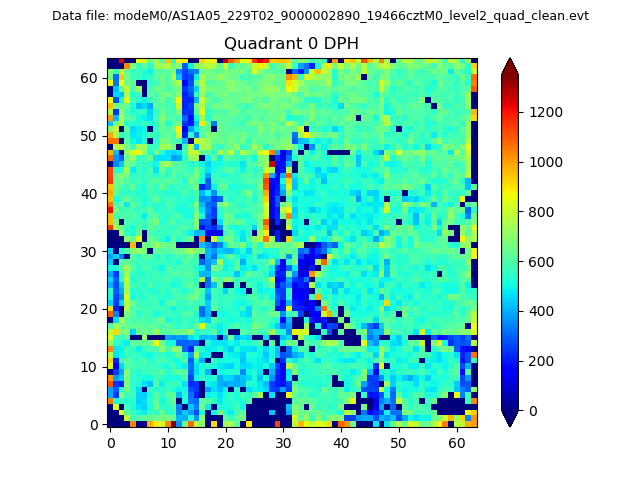 |
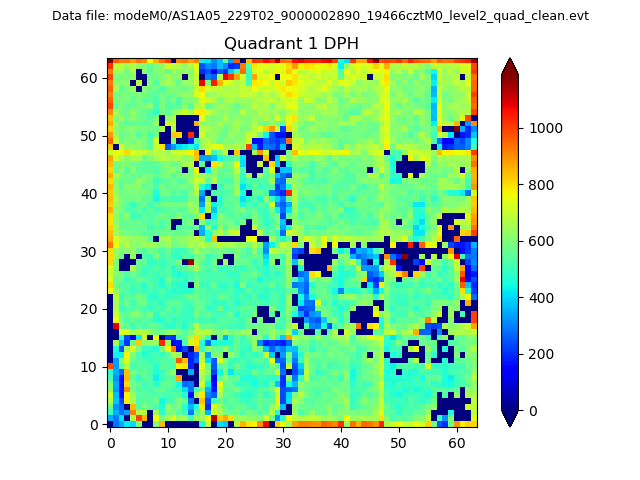 |
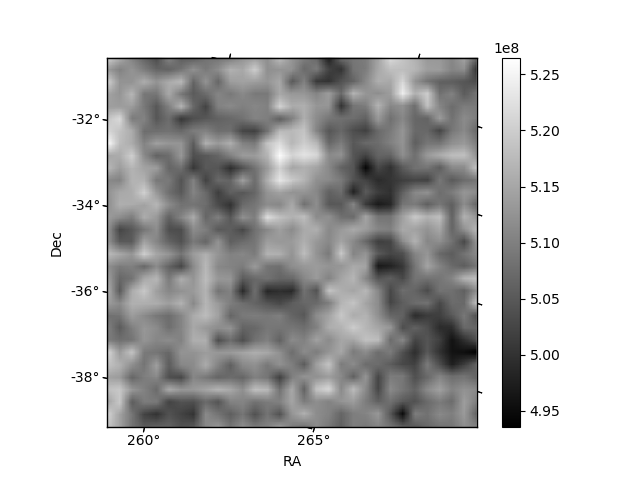
Quadrant B |
|---|---|---|---|
| Quadrant D | 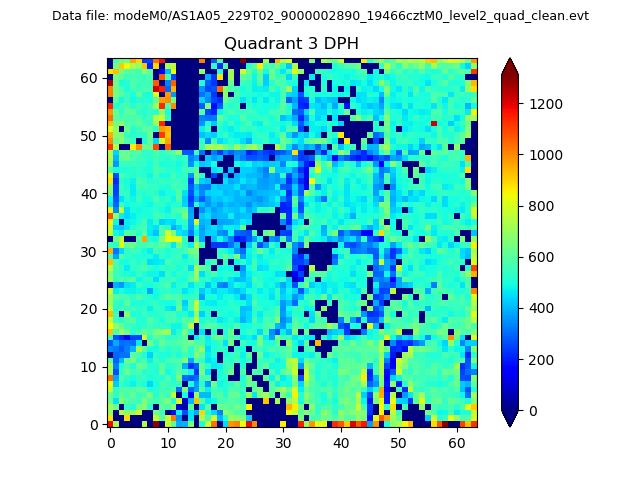 |
 |
Quadrant C |
| Plot type | Count rate plots | Images |
|---|---|---|
| Comparison with Poisson distribution Blue bars denote a histogram of data divided into 1 sec bins. Red curve is a Poisson curve with rate = median count rate of data. |
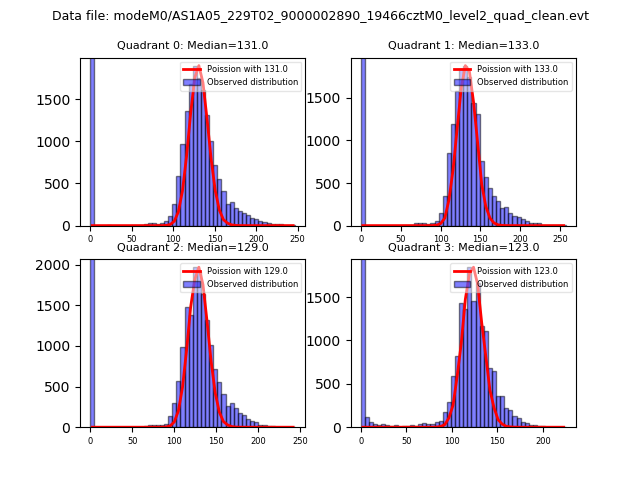 |
 |
| Quadrant-wise count rates Data is divided into 100 sec bins |
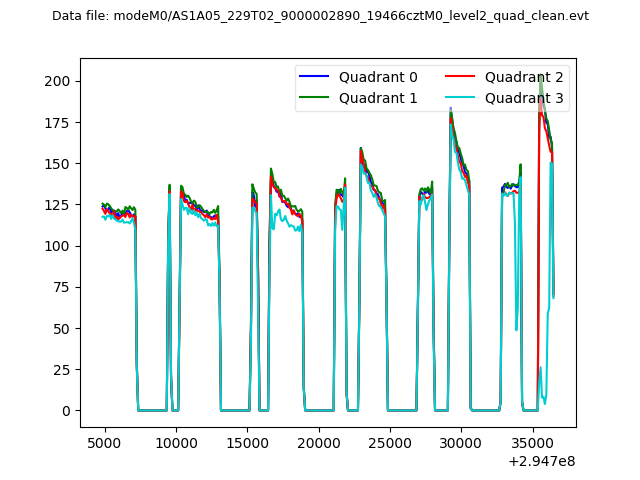 |
|
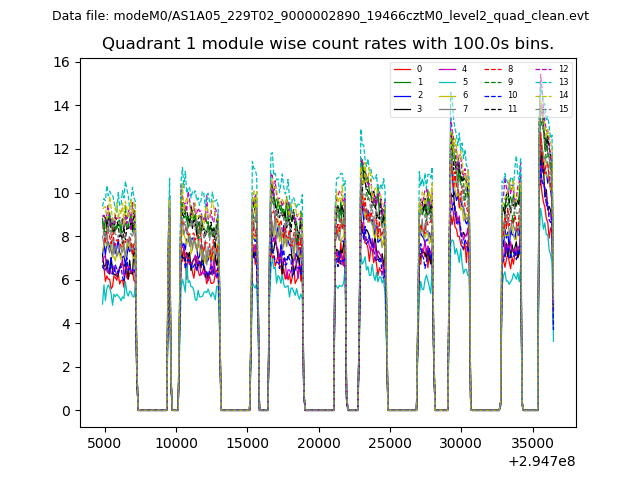
| Module-wise count rates for Quadrant A Data is divided into 100 sec bins |
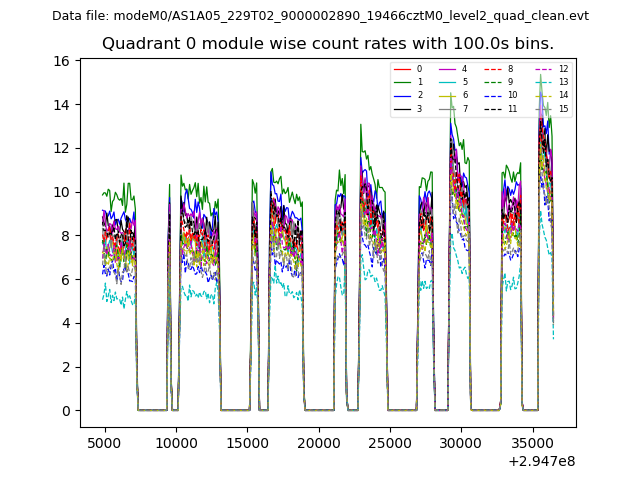 |
 |
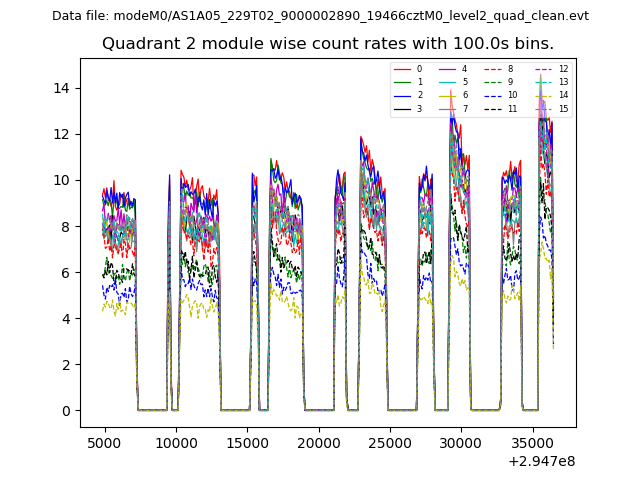
| Module-wise count rates for Quadrant B Data is divided into 100 sec bins |
 |
 |
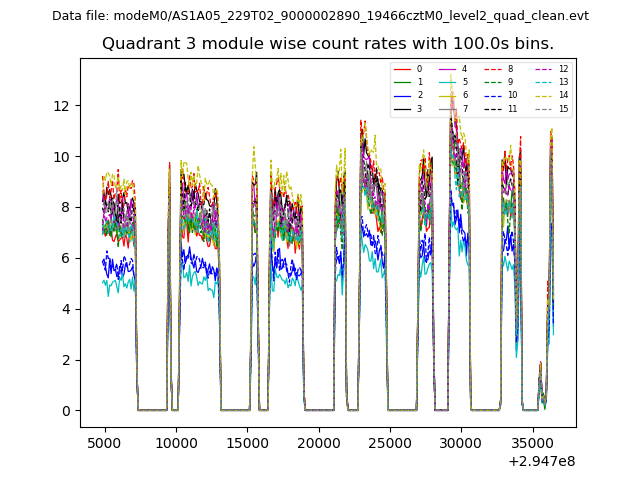
| Module-wise count rates for Quadrant C Data is divided into 100 sec bins |
 |
 |
| Module-wise count rates for Quadrant D Data is divided into 100 sec bins |
 |
 |
| Parameter | Plot |
|---|---|
| CZT HV Monitor | 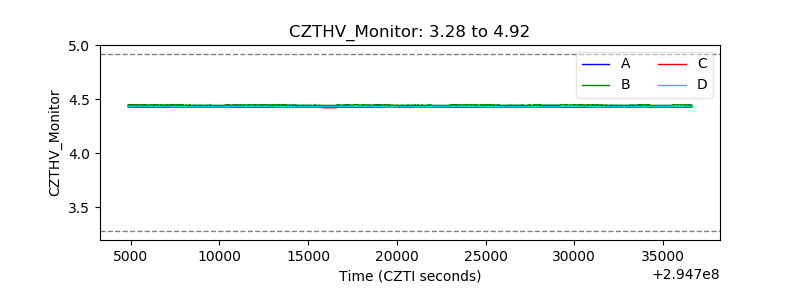 |
| D_VDD | 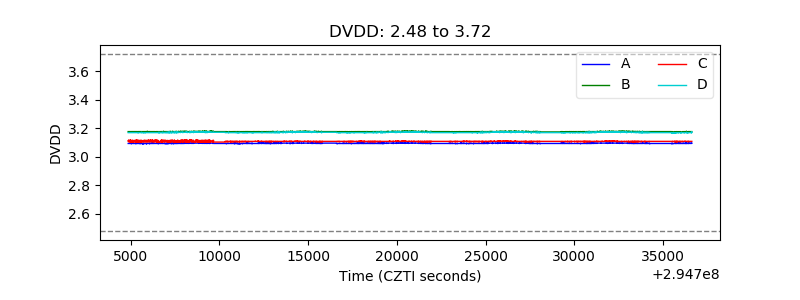 |
| Temperature 1 | 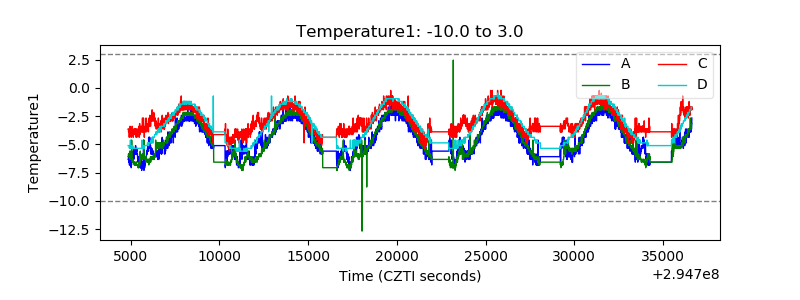 |
| Veto HV Monitor | 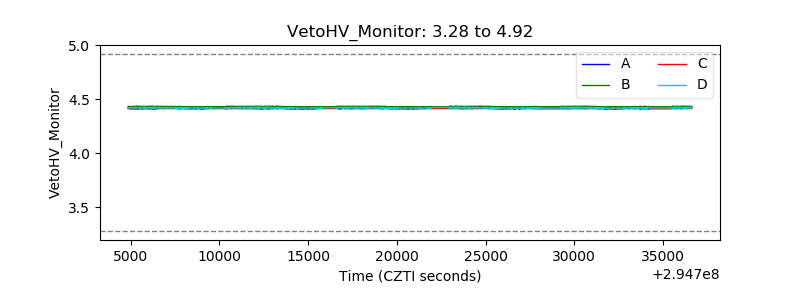 |
| Veto LLD | 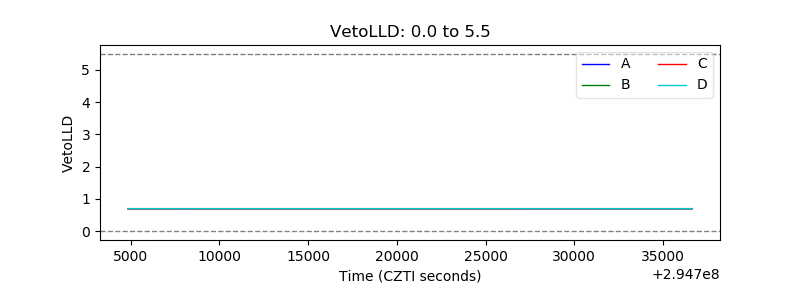 |
| Alpha Counter | 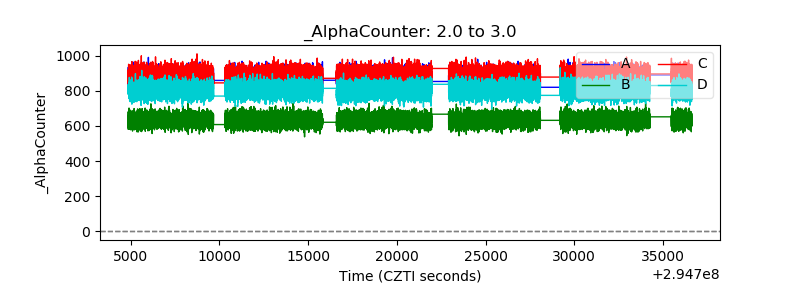 |
| _CPM_Rate | 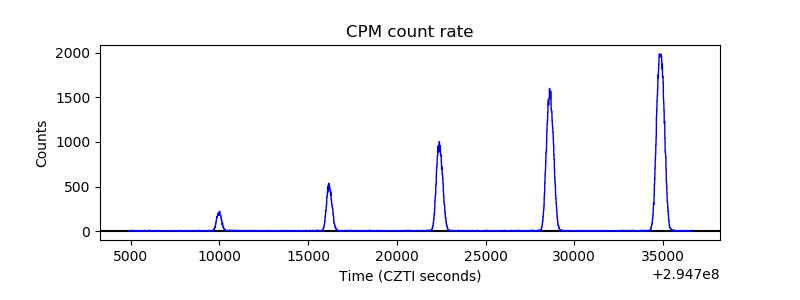 |
| CZT Counter | 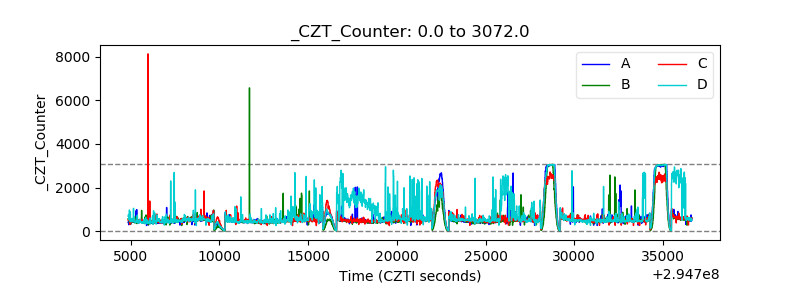 |
| +2.5 Volts monitor |  |
| +5 Volts monitor |  |
| _ROLL_ROT | 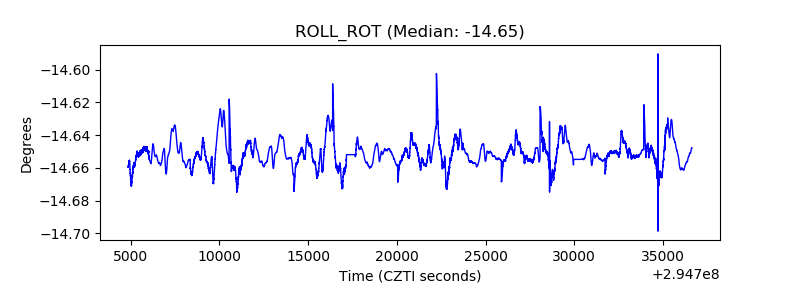 |
| _Roll_DEC | 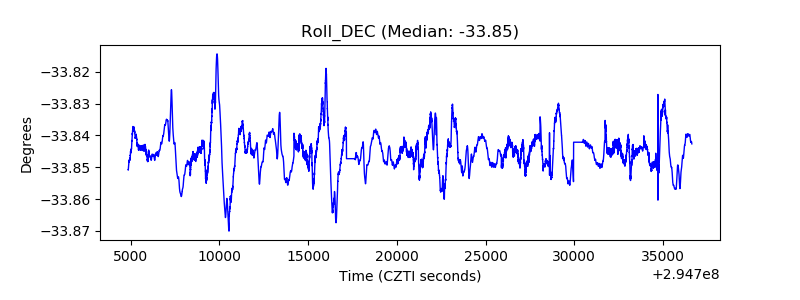 |
| _Roll_RA | 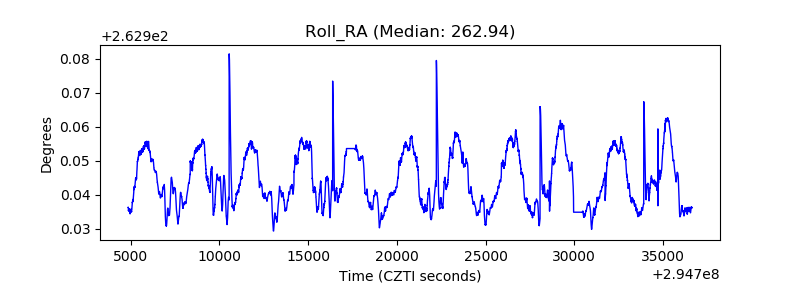 |
| Veto Counter | 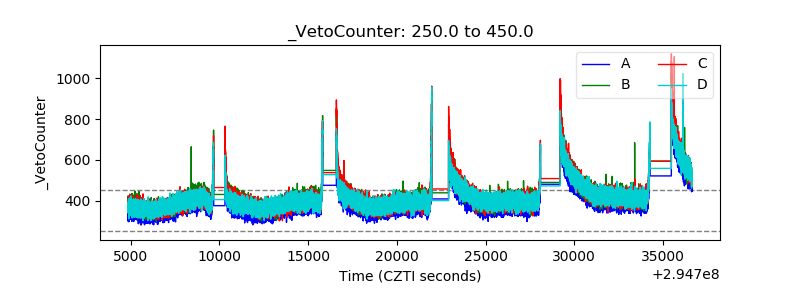 |