| Param | Original file | Final file |
|---|---|---|
| Filename | modeM0/AS1A05_229T02_9000002890_19468cztM0_level2.evt | modeM0/AS1A05_229T02_9000002890_19468cztM0_level2_quad_clean.evt |
| Size (bytes) | 515,977,920 | 75,291,840 |
| Size | 492.1 MB | 71.8 MB |
| Events in quadrant A | 3,586,557 | 466,797 |
| Events in quadrant B | 3,612,246 | 470,682 |
| Events in quadrant C | 3,665,826 | 445,318 |
| Events in quadrant D | 4,317,275 | 440,110 |
| Mode M0 | |||
|---|---|---|---|
| Quadrant | BADHDUFLAG | Total packets | Discarded packets |
| A | 0 | 14626 | 2 |
| B | 0 | 14648 | 2 |
| C | 0 | 14873 | 2 |
| D | 0 | 17122 | 2 |
| Mode SS | |||
|---|---|---|---|
| Quadrant | BADHDUFLAG | Total packets | Discarded packets |
| A | 0 | 134 | 0 |
| B | 0 | 134 | 0 |
| C | 0 | 134 | 0 |
| D | 0 | 134 | 0 |
| Mode M9 | |||
|---|---|---|---|
| Quadrant | BADHDUFLAG | Total packets | Discarded packets |
| A | 0 | 13 | 0 |
| B | 0 | 13 | 0 |
| C | 0 | 13 | 0 |
| D | 0 | 13 | 0 |
| Quadrant | Total seconds | Saturated seconds | Saturation percentage |
|---|---|---|---|
| A | 6548 | 118 | 1.802077% |
| B | 6549 | 130 | 1.985036% |
| C | 6549 | 138 | 2.107192% |
| D | 6549 | 258 | 3.939533% |
Noise dominated data is calculated using 1-second bins in cleaned event files. If a bin has >2000 counts, and if more than 50% of those come from <1% of pixels, then it is considered to be noise-dominated and hence unusable.
| Quadrant | # 1 sec bins | Bins with >0 counts | Bins with >2000 counts | High rate bins dominated by noise | Noise dominated (total time) | Noise dominated (detector-on time) | Marked lightcurve |
|---|---|---|---|---|---|---|---|
| A | 7828 | 6548 | 2 | 2 | 0.03% | 0.03% |  |
| B | 7829 | 6549 | 2 | 2 | 0.03% | 0.03% | 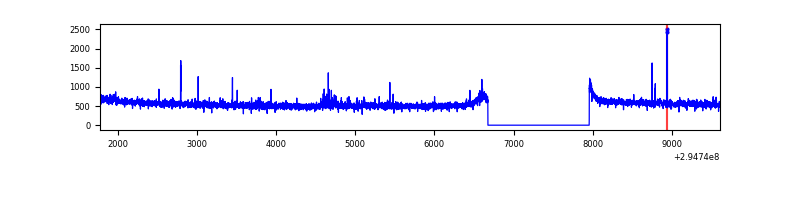 |
| C | 7829 | 6549 | 0 | 0 | 0.00% | 0.00% | 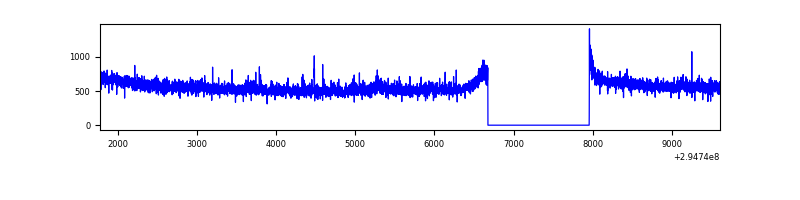 |
| D | 7829 | 6549 | 133 | 133 | 1.70% | 2.03% | 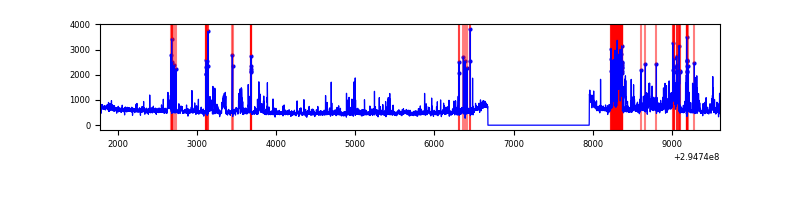 |
Top three noisy pixels from each quadrant. If the there are fewer than three noisy pixels in the level2.evt file, extra rows are filled as -1
| Pixel properties | Quadrant properties | ||||||
|---|---|---|---|---|---|---|---|
| Quadrant | DetID | PixID | Counts | Sigma | Mean | Median | Sigma |
| A | 5 | 16 | 21058 | 110.24 | 920 | 905 | 182.8 |
| A | 11 | 29 | 10784 | 54.04 | 920 | 905 | 182.8 |
| A | 3 | 1 | 9686 | 48.03 | 920 | 905 | 182.8 |
| B | 0 | 198 | 20562 | 117.11 | 902 | 883 | 168.0 |
| B | 12 | 111 | 18885 | 107.13 | 902 | 883 | 168.0 |
| B | 0 | 230 | 18768 | 106.44 | 902 | 883 | 168.0 |
| C | 14 | 238 | 138931 | 699.57 | 865 | 872 | 197.3 |
| C | 3 | 233 | 94359 | 473.71 | 865 | 872 | 197.3 |
| C | 9 | 221 | 51121 | 254.62 | 865 | 872 | 197.3 |
| D | 7 | 238 | 313146 | 1466.4 | 883 | 861 | 213.0 |
| D | 1 | 52 | 298468 | 1397.48 | 883 | 861 | 213.0 |
| D | 12 | 225 | 272946 | 1277.63 | 883 | 861 | 213.0 |
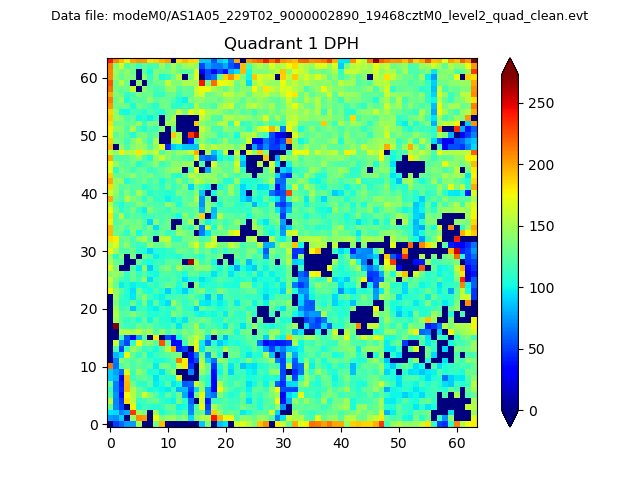
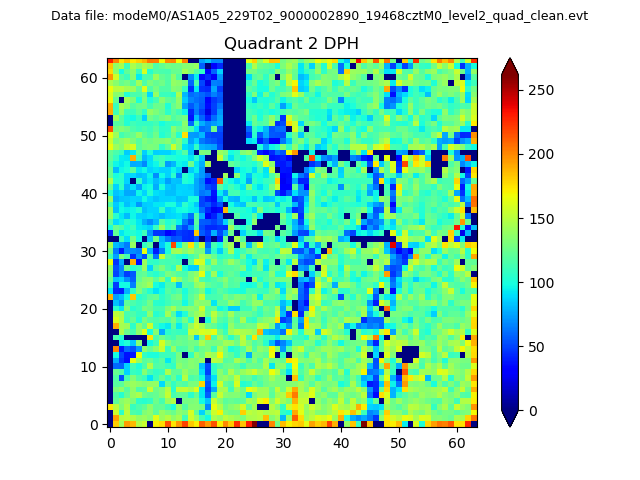
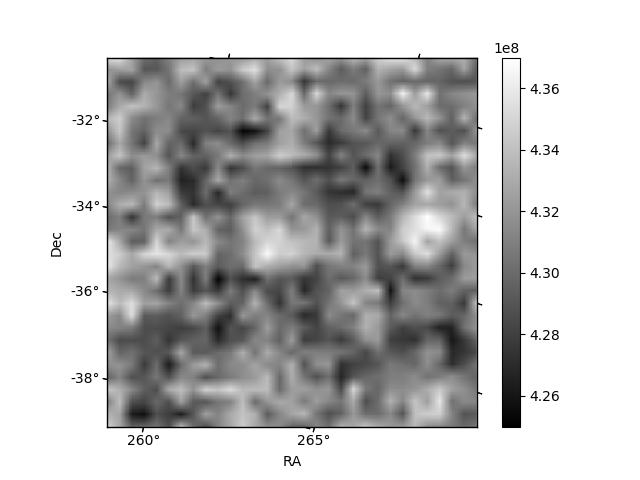
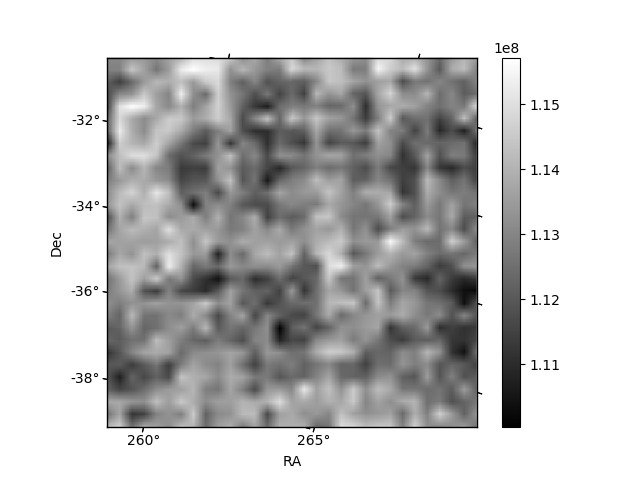
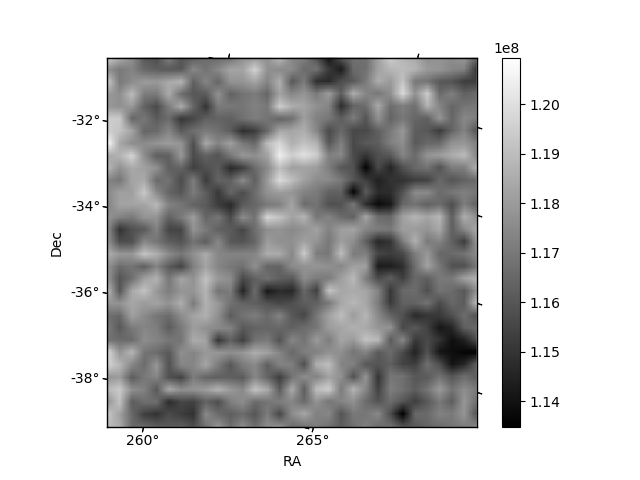
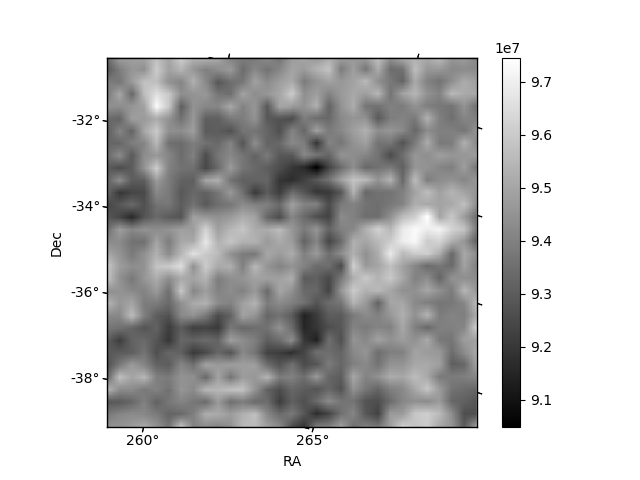
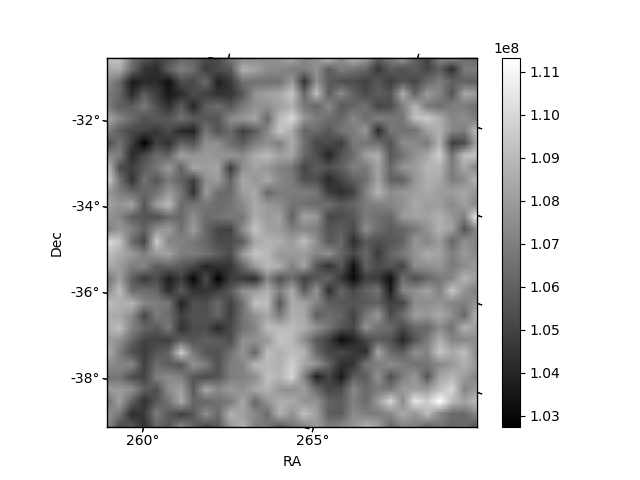
Histogram calculated using DETX and DETY for each event in the final _common_clean file
| Quadrant A | 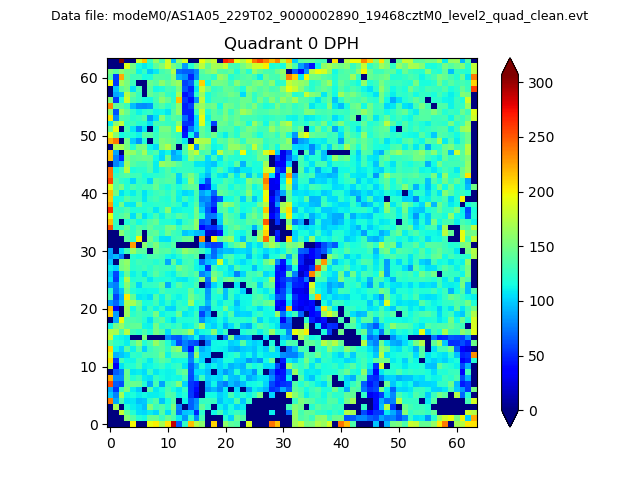 |
 |
Quadrant B |
|---|---|---|---|
| Quadrant D | 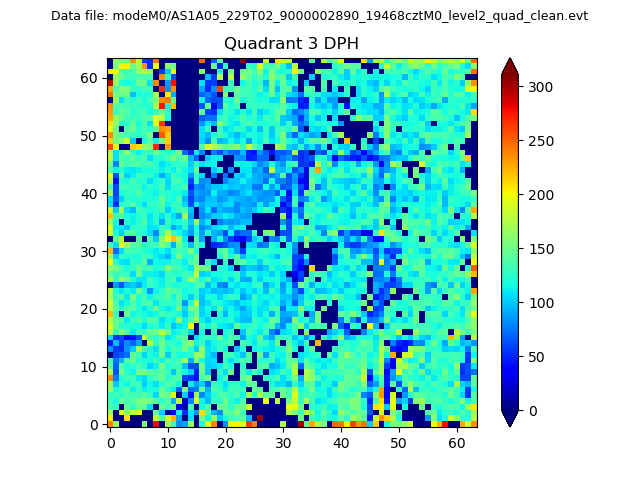 |
 |
Quadrant C |
| Plot type | Count rate plots | Images |
|---|---|---|
| Comparison with Poisson distribution Blue bars denote a histogram of data divided into 1 sec bins. Red curve is a Poisson curve with rate = median count rate of data. |
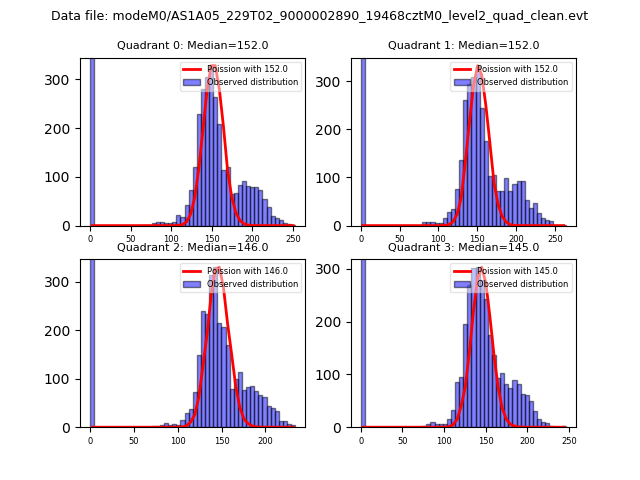 |
 |
| Quadrant-wise count rates Data is divided into 100 sec bins |
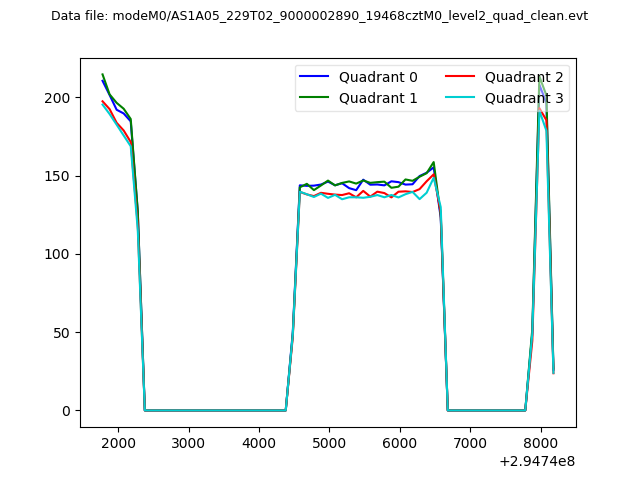 |
|
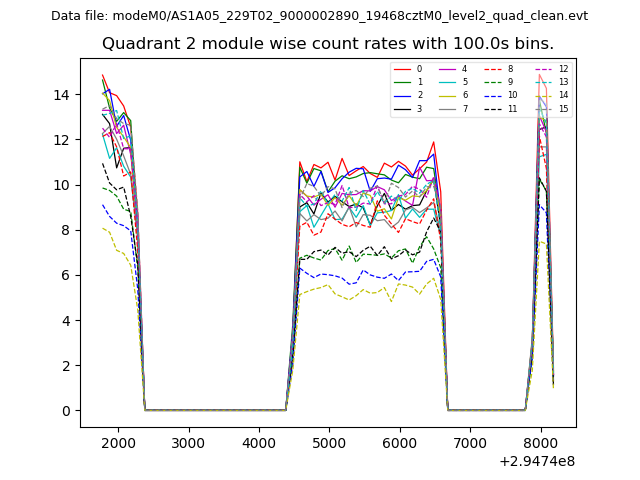
| Module-wise count rates for Quadrant A Data is divided into 100 sec bins |
 |
 |
| Module-wise count rates for Quadrant B Data is divided into 100 sec bins |
 |
 |
| Module-wise count rates for Quadrant C Data is divided into 100 sec bins |
 |
 |
| Module-wise count rates for Quadrant D Data is divided into 100 sec bins |
 |
 |
| Parameter | Plot |
|---|---|
| CZT HV Monitor |  |
| D_VDD | 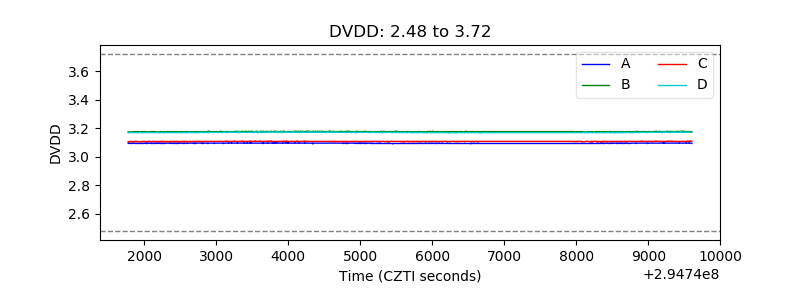 |
| Temperature 1 | 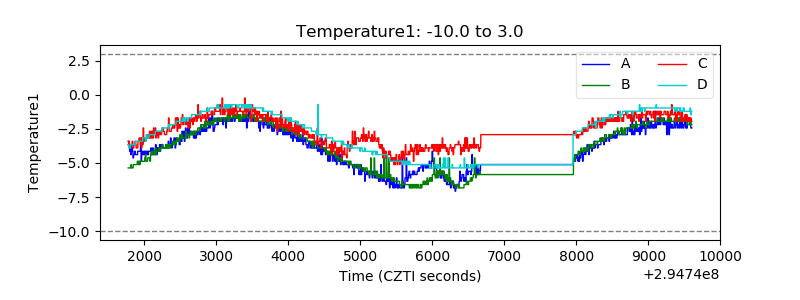 |
| Veto HV Monitor | 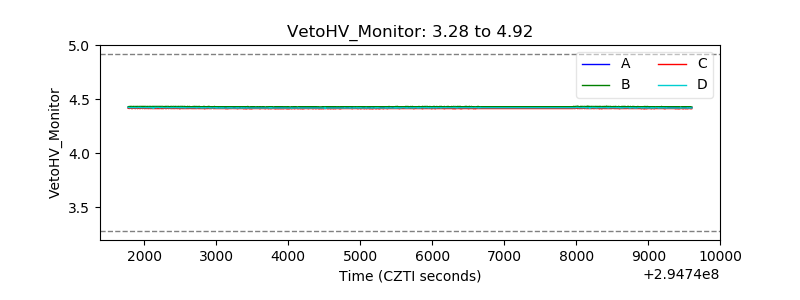 |
| Veto LLD | 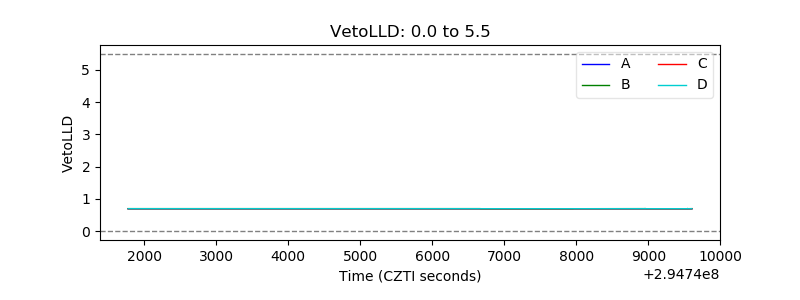 |
| Alpha Counter | 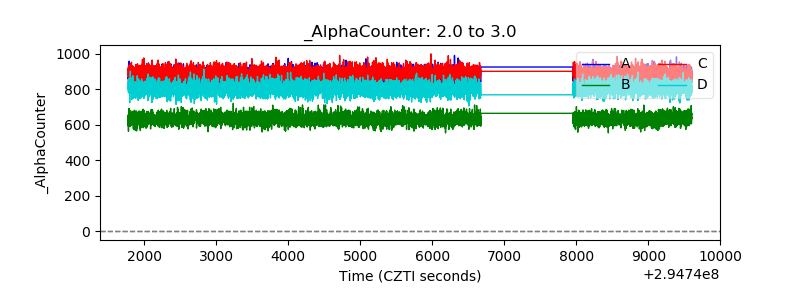 |
| _CPM_Rate | 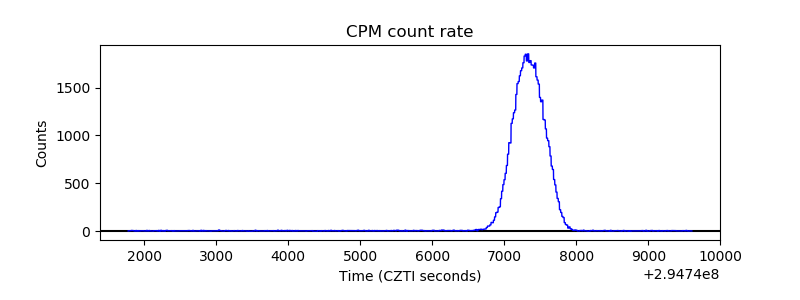 |
| CZT Counter | 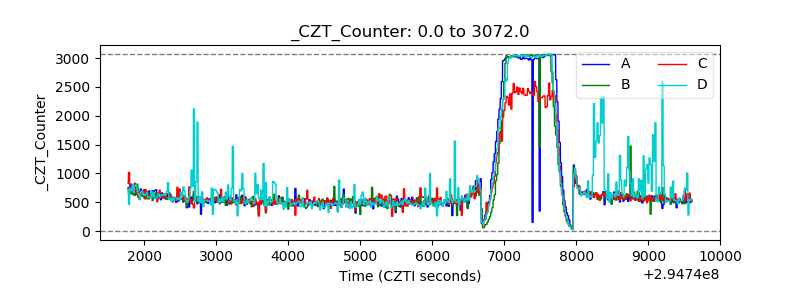 |
| +2.5 Volts monitor |  |
| +5 Volts monitor |  |
| _ROLL_ROT | 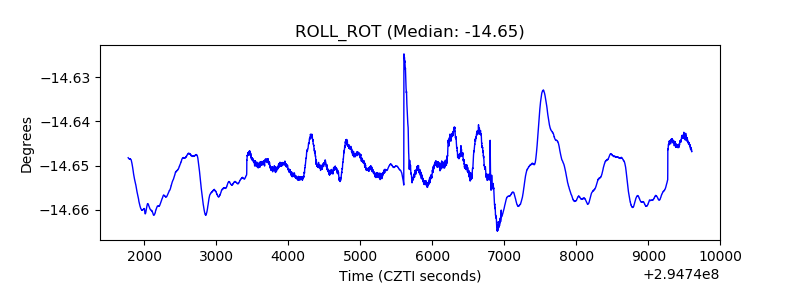 |
| _Roll_DEC | 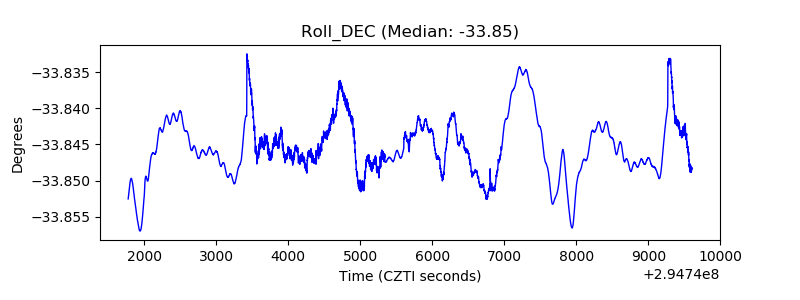 |
| _Roll_RA | 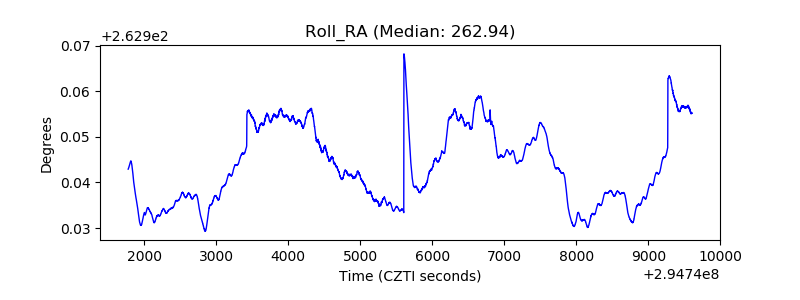 |
| Veto Counter |  |