| Param | Original file | Final file |
|---|---|---|
| Filename | modeM0/AS1A05_229T02_9000002890_19469cztM0_level2.evt | modeM0/AS1A05_229T02_9000002890_19469cztM0_level2_quad_clean.evt |
| Size (bytes) | 523,560,960 | 66,600,000 |
| Size | 499.3 MB | 63.5 MB |
| Events in quadrant A | 3,448,709 | 401,072 |
| Events in quadrant B | 3,554,091 | 402,151 |
| Events in quadrant C | 3,762,359 | 382,895 |
| Events in quadrant D | 4,651,754 | 378,746 |
| Mode M0 | |||
|---|---|---|---|
| Quadrant | BADHDUFLAG | Total packets | Discarded packets |
| A | 0 | 14077 | 1 |
| B | 0 | 14436 | 1 |
| C | 0 | 15321 | 1 |
| D | 0 | 18118 | 1 |
| Mode SS | |||
|---|---|---|---|
| Quadrant | BADHDUFLAG | Total packets | Discarded packets |
| A | 0 | 130 | 0 |
| B | 0 | 130 | 0 |
| C | 0 | 130 | 0 |
| D | 0 | 130 | 0 |
| Mode M9 | |||
|---|---|---|---|
| Quadrant | BADHDUFLAG | Total packets | Discarded packets |
| A | 0 | 13 | 0 |
| B | 0 | 13 | 0 |
| C | 0 | 13 | 0 |
| D | 0 | 13 | 0 |
| Quadrant | Total seconds | Saturated seconds | Saturation percentage |
|---|---|---|---|
| A | 6479 | 126 | 1.944745% |
| B | 6480 | 139 | 2.145062% |
| C | 6480 | 159 | 2.453704% |
| D | 6479 | 306 | 4.722951% |
Noise dominated data is calculated using 1-second bins in cleaned event files. If a bin has >2000 counts, and if more than 50% of those come from <1% of pixels, then it is considered to be noise-dominated and hence unusable.
| Quadrant | # 1 sec bins | Bins with >0 counts | Bins with >2000 counts | High rate bins dominated by noise | Noise dominated (total time) | Noise dominated (detector-on time) | Marked lightcurve |
|---|---|---|---|---|---|---|---|
| A | 7729 | 6479 | 0 | 0 | 0.00% | 0.00% | 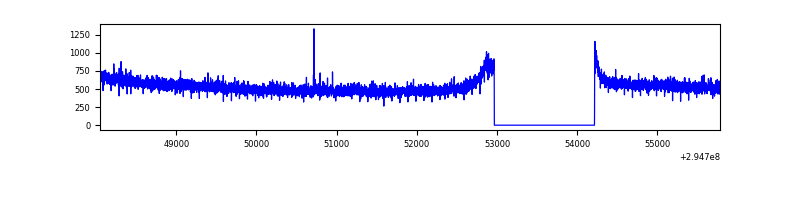 |
| B | 7730 | 6480 | 3 | 3 | 0.04% | 0.05% | 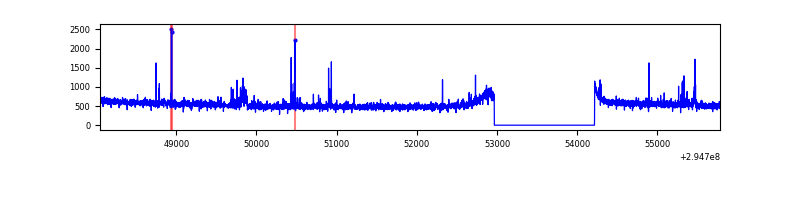 |
| C | 7730 | 6480 | 5 | 5 | 0.06% | 0.08% | 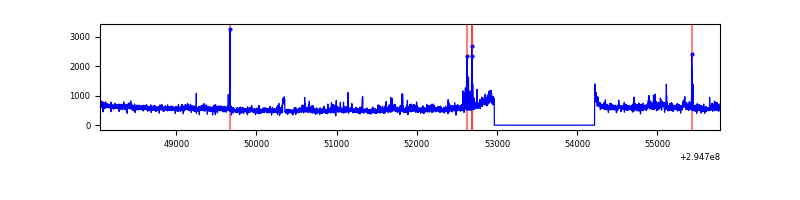 |
| D | 7728 | 6478 | 159 | 159 | 2.06% | 2.45% | 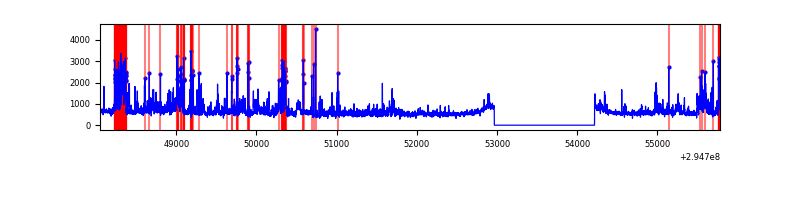 |
Top three noisy pixels from each quadrant. If the there are fewer than three noisy pixels in the level2.evt file, extra rows are filled as -1
| Pixel properties | Quadrant properties | ||||||
|---|---|---|---|---|---|---|---|
| Quadrant | DetID | PixID | Counts | Sigma | Mean | Median | Sigma |
| A | 11 | 29 | 9596 | 49.49 | 890 | 877 | 176.2 |
| A | 15 | 191 | 8141 | 41.23 | 890 | 877 | 176.2 |
| A | 0 | 226 | 7827 | 39.45 | 890 | 877 | 176.2 |
| B | 4 | 216 | 30226 | 177.79 | 877 | 857 | 165.2 |
| B | 0 | 230 | 20443 | 118.57 | 877 | 857 | 165.2 |
| B | 12 | 111 | 18611 | 107.48 | 877 | 857 | 165.2 |
| C | 3 | 233 | 195212 | 1016.11 | 836 | 844 | 191.3 |
| C | 9 | 221 | 135999 | 706.56 | 836 | 844 | 191.3 |
| C | 14 | 238 | 133064 | 691.21 | 836 | 844 | 191.3 |
| D | 12 | 225 | 462891 | 2244.1 | 851 | 828 | 205.9 |
| D | 7 | 238 | 363548 | 1761.62 | 851 | 828 | 205.9 |
| D | 1 | 52 | 278754 | 1349.8 | 851 | 828 | 205.9 |
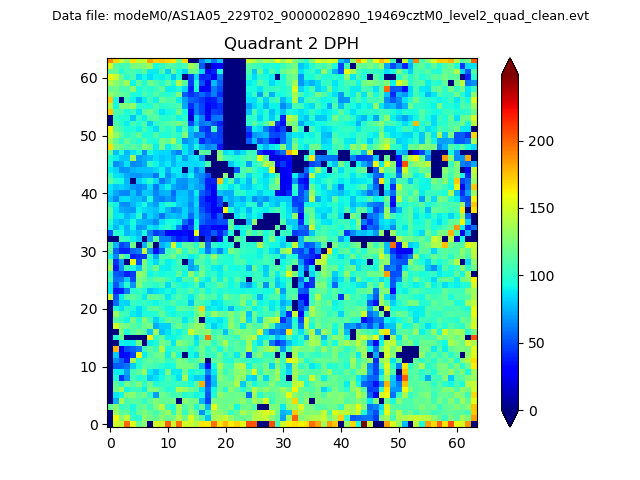
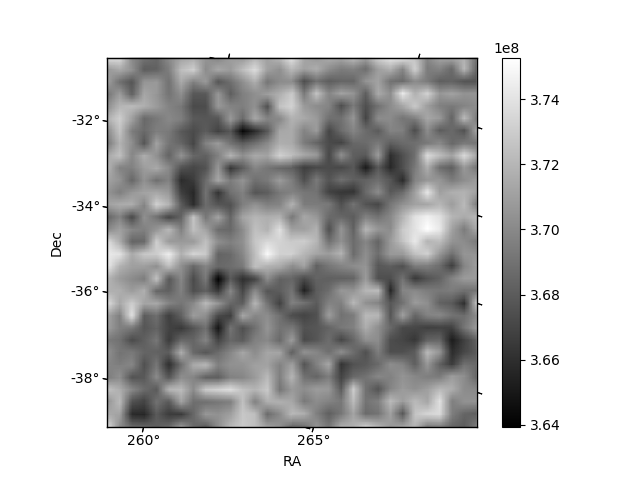
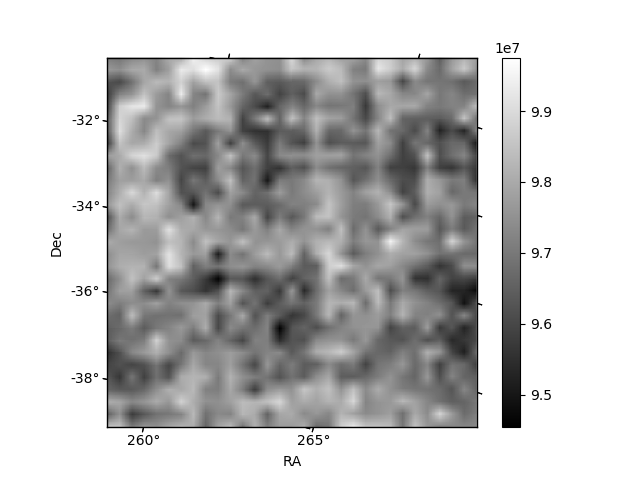
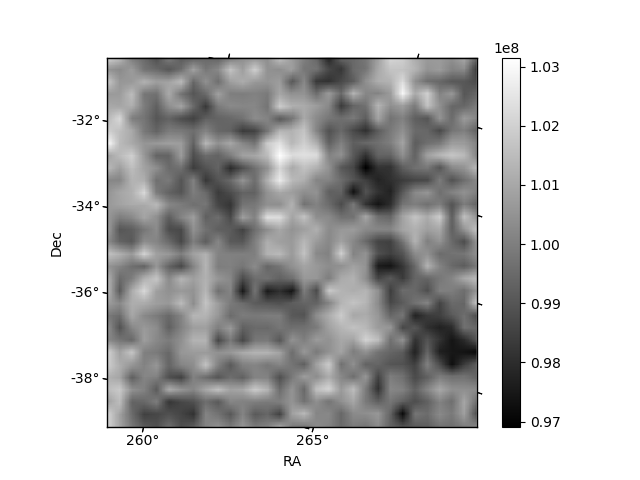
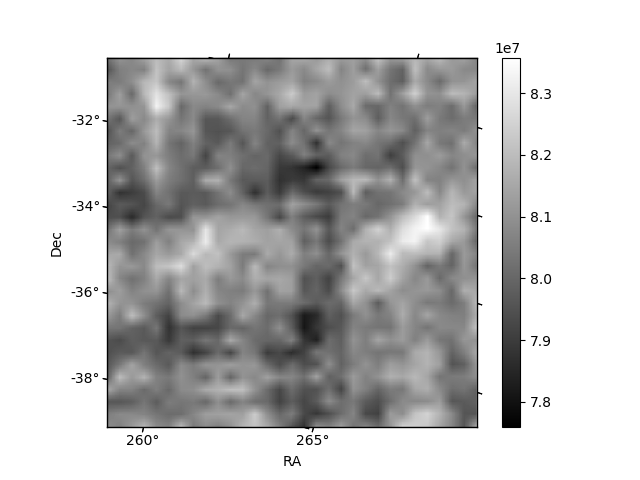
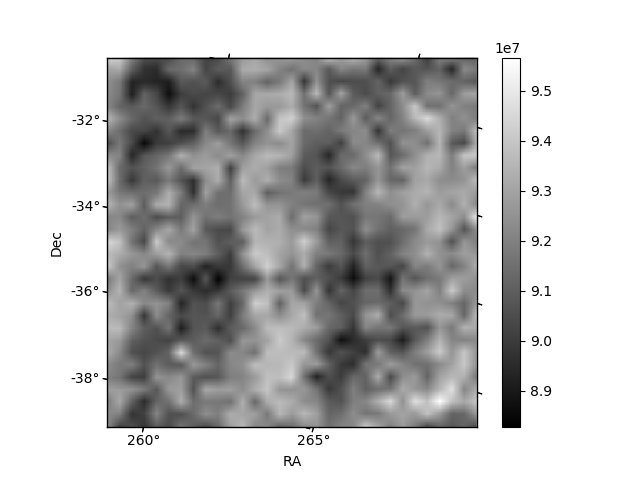
Histogram calculated using DETX and DETY for each event in the final _common_clean file
| Quadrant A | 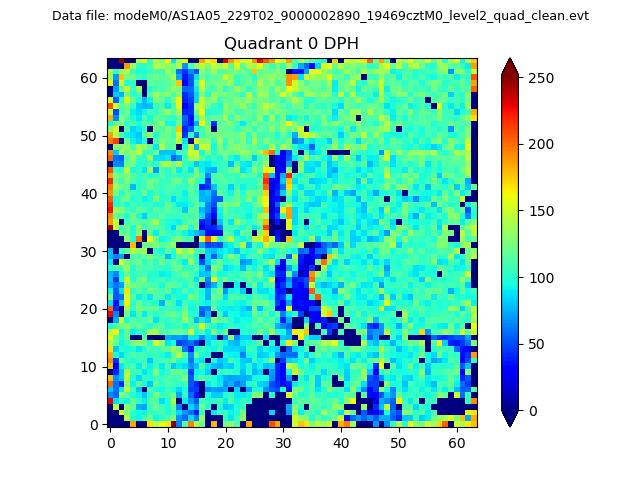 |
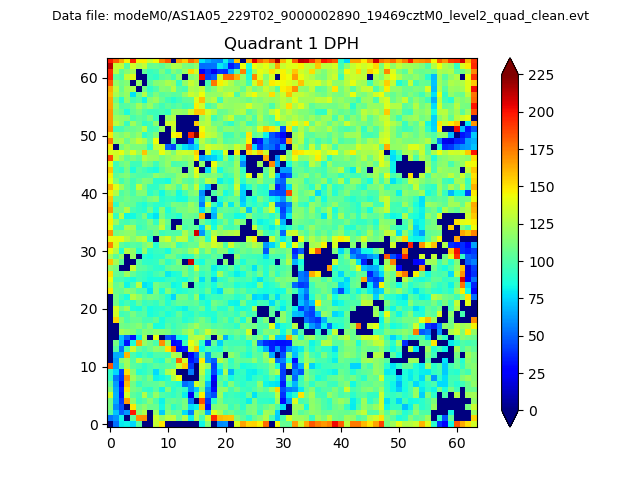 |
Quadrant B |
|---|---|---|---|
| Quadrant D | 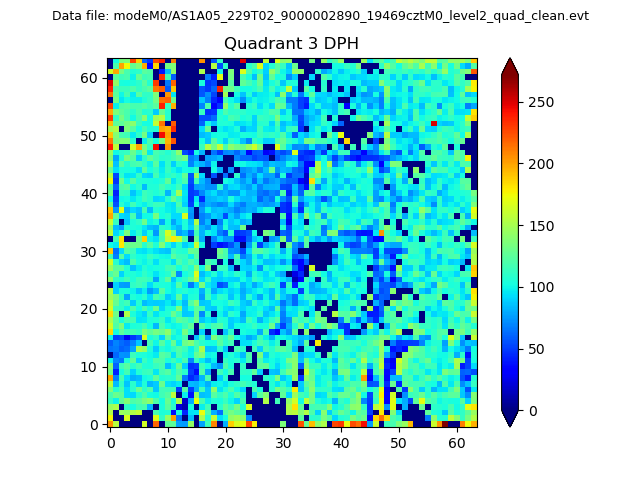 |
 |
Quadrant C |
| Plot type | Count rate plots | Images |
|---|---|---|
| Comparison with Poisson distribution Blue bars denote a histogram of data divided into 1 sec bins. Red curve is a Poisson curve with rate = median count rate of data. |
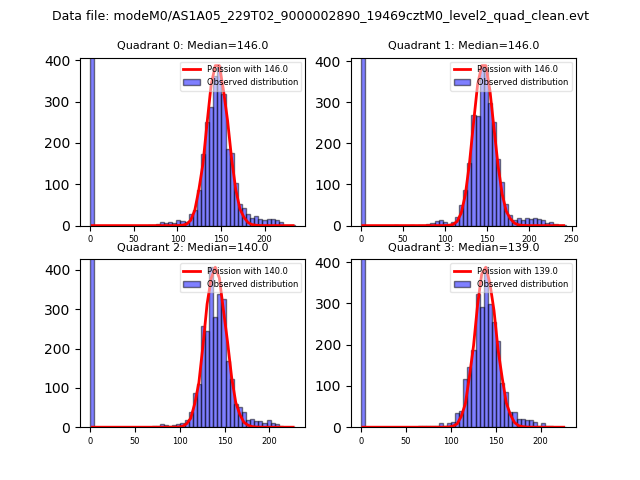 |
 |
| Quadrant-wise count rates Data is divided into 100 sec bins |
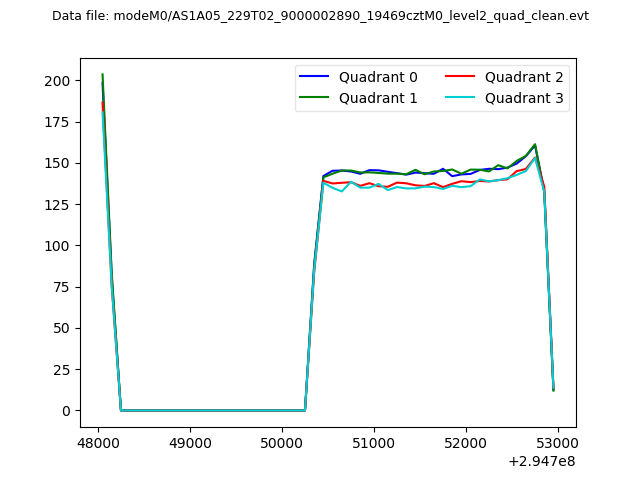 |
|
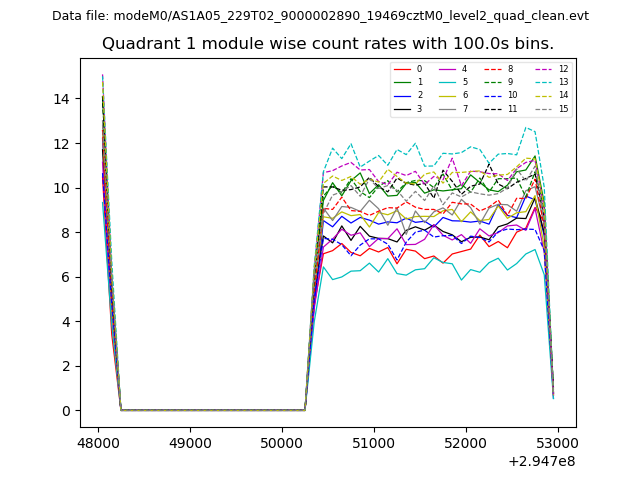
| Module-wise count rates for Quadrant A Data is divided into 100 sec bins |
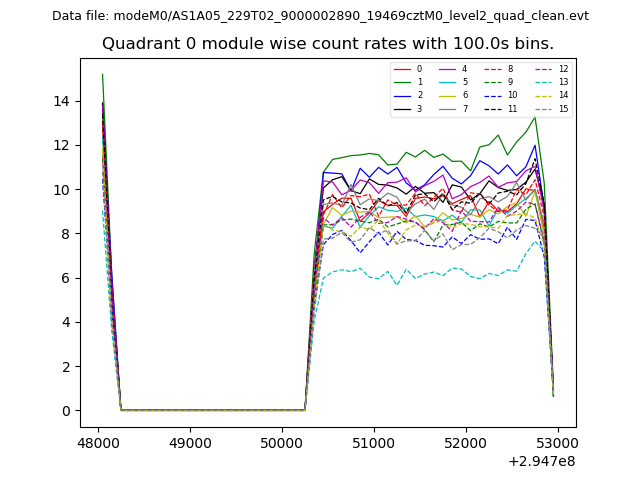 |
 |
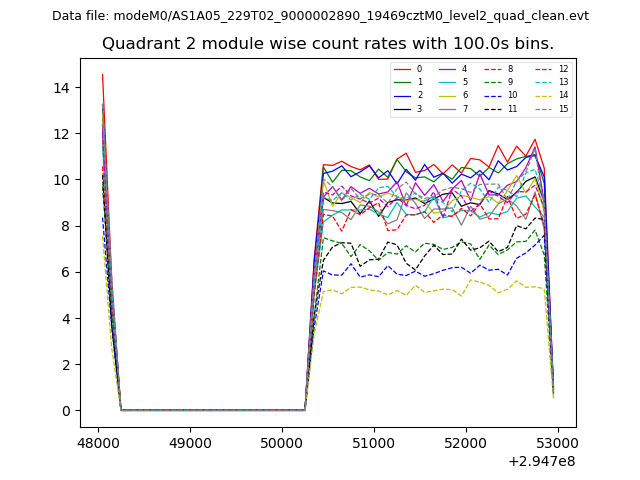
| Module-wise count rates for Quadrant B Data is divided into 100 sec bins |
 |
 |
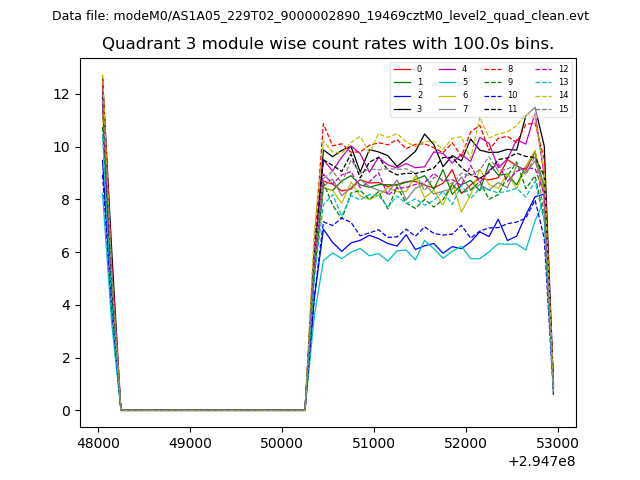
| Module-wise count rates for Quadrant C Data is divided into 100 sec bins |
 |
 |
| Module-wise count rates for Quadrant D Data is divided into 100 sec bins |
 |
 |
| Parameter | Plot |
|---|---|
| CZT HV Monitor | 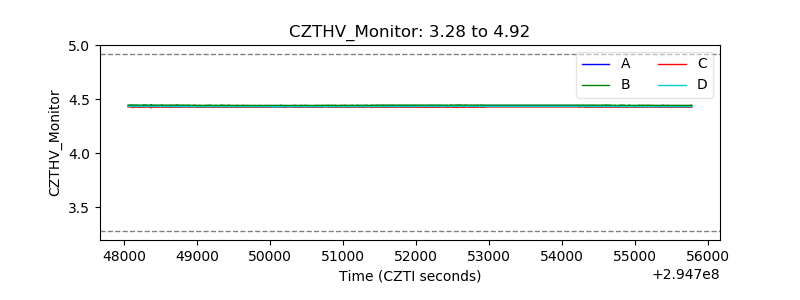 |
| D_VDD | 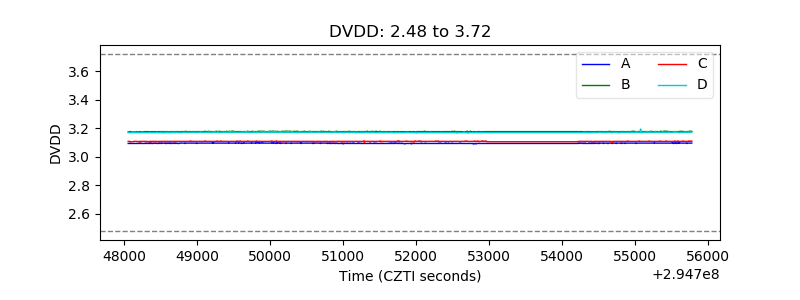 |
| Temperature 1 | 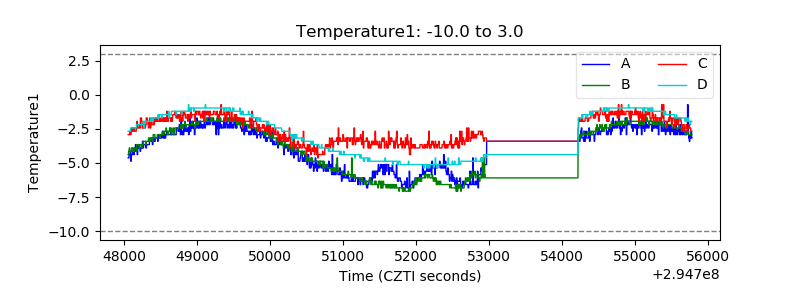 |
| Veto HV Monitor | 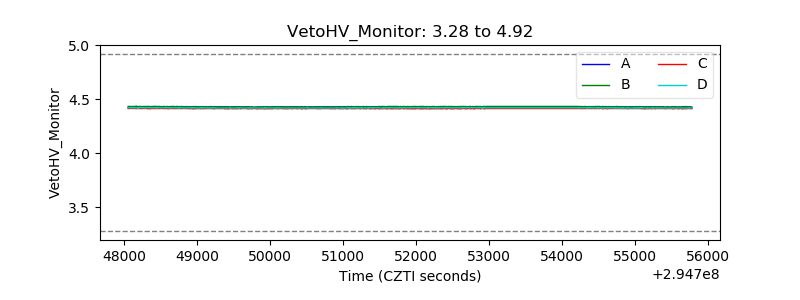 |
| Veto LLD | 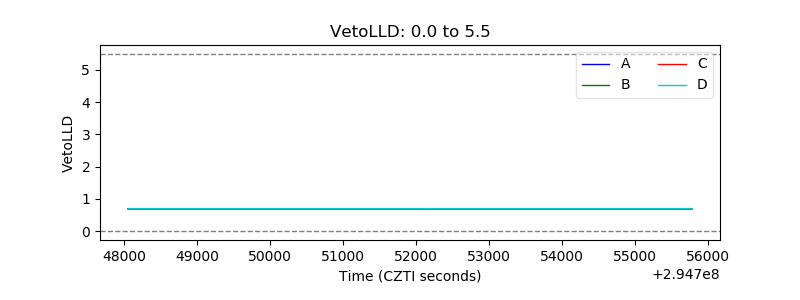 |
| Alpha Counter | 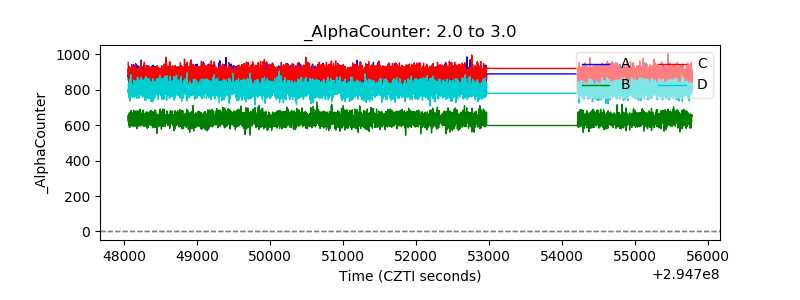 |
| _CPM_Rate | 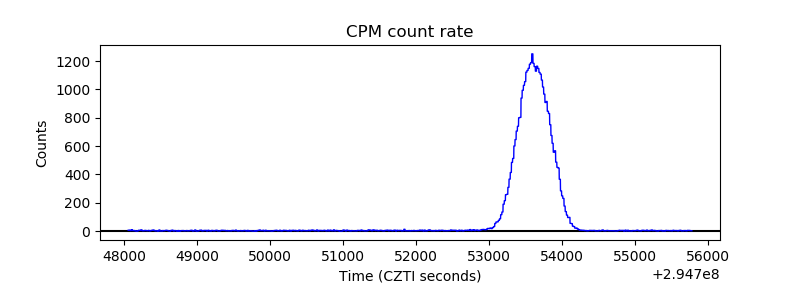 |
| CZT Counter | 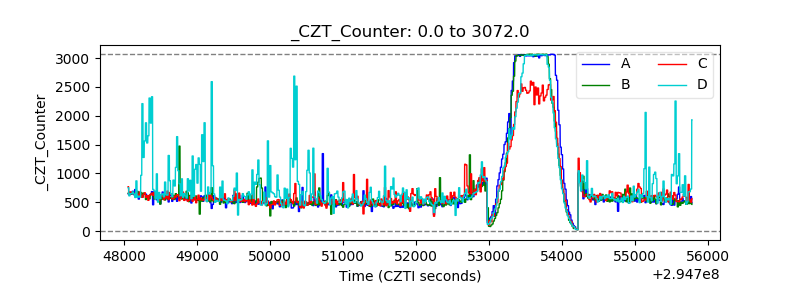 |
| +2.5 Volts monitor |  |
| +5 Volts monitor |  |
| _ROLL_ROT | 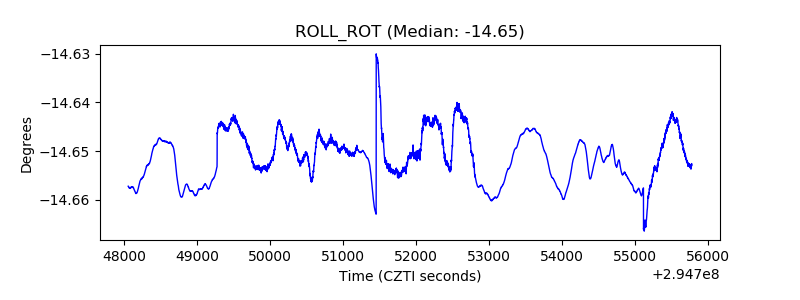 |
| _Roll_DEC | 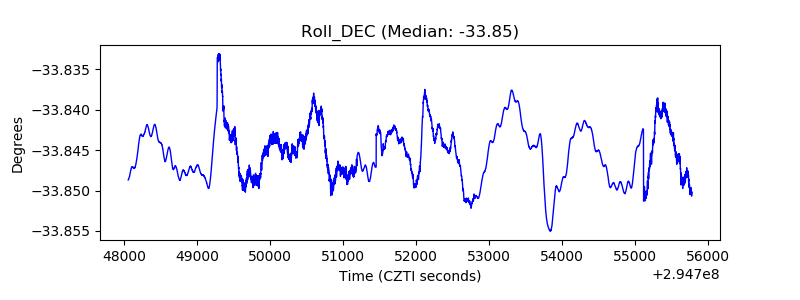 |
| _Roll_RA | 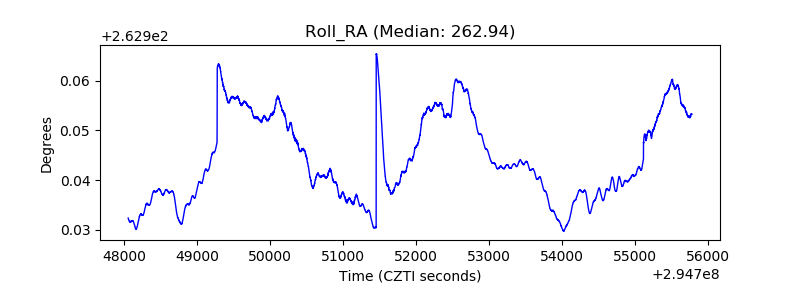 |
| Veto Counter | 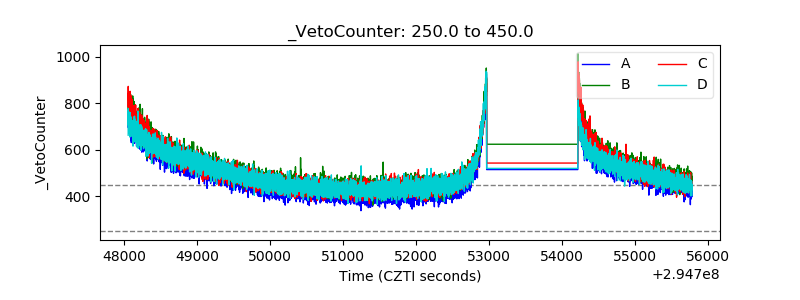 |