| Param | Original file | Final file |
|---|---|---|
| Filename | modeM0/AS1A05_229T02_9000002890_19470cztM0_level2.evt | modeM0/AS1A05_229T02_9000002890_19470cztM0_level2_quad_clean.evt |
| Size (bytes) | 590,304,960 | 71,000,640 |
| Size | 563.0 MB | 67.7 MB |
| Events in quadrant A | 3,428,863 | 440,629 |
| Events in quadrant B | 3,551,549 | 442,510 |
| Events in quadrant C | 4,113,565 | 420,300 |
| Events in quadrant D | 6,332,261 | 382,151 |
| Mode M0 | |||
|---|---|---|---|
| Quadrant | BADHDUFLAG | Total packets | Discarded packets |
| A | 0 | 14089 | 2 |
| B | 0 | 14533 | 3 |
| C | 0 | 16763 | 2 |
| D | 0 | 23283 | 2 |
| Mode SS | |||
|---|---|---|---|
| Quadrant | BADHDUFLAG | Total packets | Discarded packets |
| A | 0 | 134 | 0 |
| B | 0 | 134 | 0 |
| C | 0 | 134 | 0 |
| D | 0 | 134 | 0 |
| Mode M9 | |||
|---|---|---|---|
| Quadrant | BADHDUFLAG | Total packets | Discarded packets |
| A | 0 | 18 | 0 |
| B | 0 | 19 | 0 |
| C | 0 | 19 | 0 |
| D | 0 | 19 | 0 |
| Quadrant | Total seconds | Saturated seconds | Saturation percentage |
|---|---|---|---|
| A | 6661 | 94 | 1.411200% |
| B | 6660 | 116 | 1.741742% |
| C | 6660 | 150 | 2.252252% |
| D | 6660 | 1119 | 16.801802% |
Noise dominated data is calculated using 1-second bins in cleaned event files. If a bin has >2000 counts, and if more than 50% of those come from <1% of pixels, then it is considered to be noise-dominated and hence unusable.
| Quadrant | # 1 sec bins | Bins with >0 counts | Bins with >2000 counts | High rate bins dominated by noise | Noise dominated (total time) | Noise dominated (detector-on time) | Marked lightcurve |
|---|---|---|---|---|---|---|---|
| A | 7771 | 6661 | 0 | 0 | 0.00% | 0.00% | 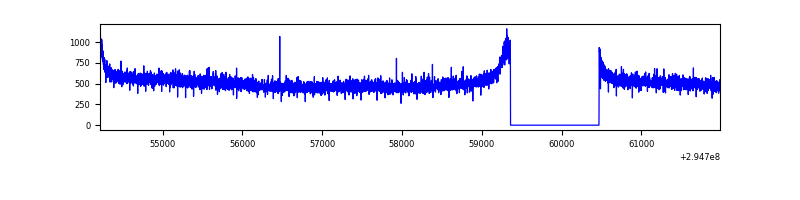 |
| B | 7770 | 6660 | 10 | 10 | 0.13% | 0.15% | 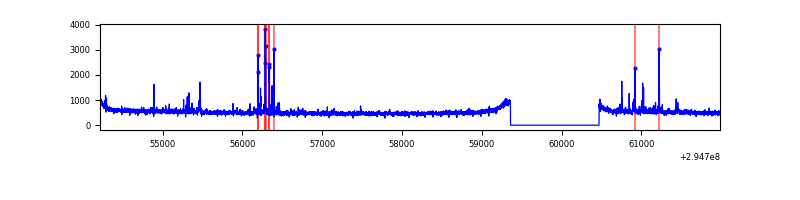 |
| C | 7770 | 6660 | 2 | 2 | 0.03% | 0.03% | 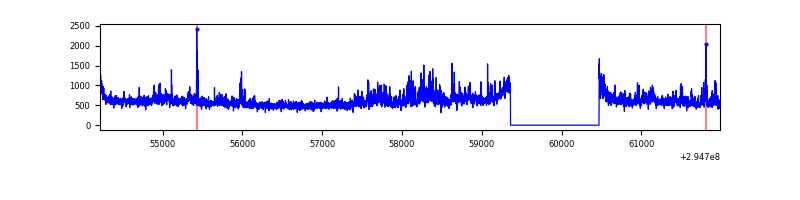 |
| D | 7769 | 6659 | 895 | 895 | 11.52% | 13.44% | 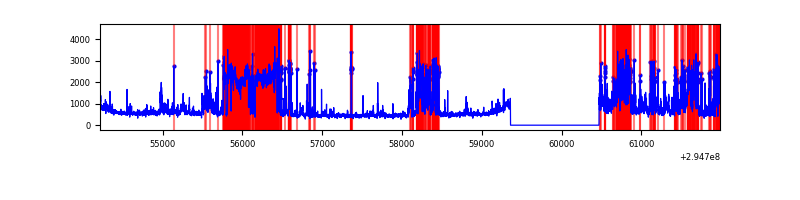 |
Top three noisy pixels from each quadrant. If the there are fewer than three noisy pixels in the level2.evt file, extra rows are filled as -1
| Pixel properties | Quadrant properties | ||||||
|---|---|---|---|---|---|---|---|
| Quadrant | DetID | PixID | Counts | Sigma | Mean | Median | Sigma |
| A | 15 | 191 | 26814 | 146.17 | 881 | 865 | 177.5 |
| A | 0 | 226 | 7812 | 39.13 | 881 | 865 | 177.5 |
| A | 13 | 254 | 7491 | 37.32 | 881 | 865 | 177.5 |
| B | 7 | 220 | 57583 | 341.61 | 871 | 850 | 166.1 |
| B | 0 | 230 | 23011 | 133.44 | 871 | 850 | 166.1 |
| B | 0 | 190 | 19847 | 114.39 | 871 | 850 | 166.1 |
| C | 3 | 233 | 482577 | 2504.64 | 831 | 836 | 192.3 |
| C | 9 | 221 | 247895 | 1284.49 | 831 | 836 | 192.3 |
| C | 14 | 238 | 129047 | 666.59 | 831 | 836 | 192.3 |
| D | 7 | 238 | 2877984 | 15328.11 | 773 | 753 | 187.7 |
| D | 12 | 225 | 267227 | 1419.61 | 773 | 753 | 187.7 |
| D | 1 | 52 | 148003 | 784.46 | 773 | 753 | 187.7 |
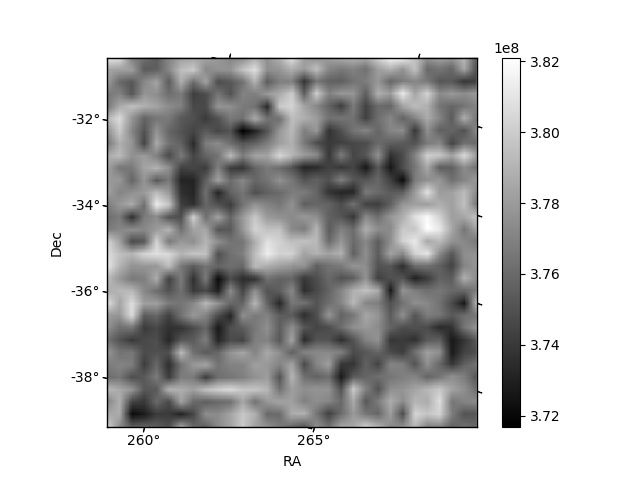
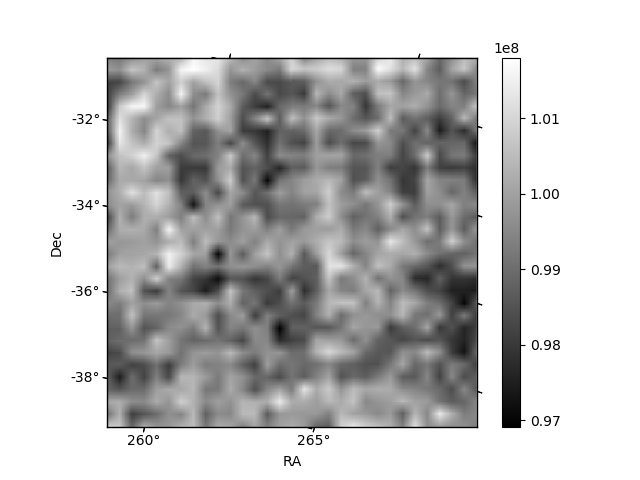
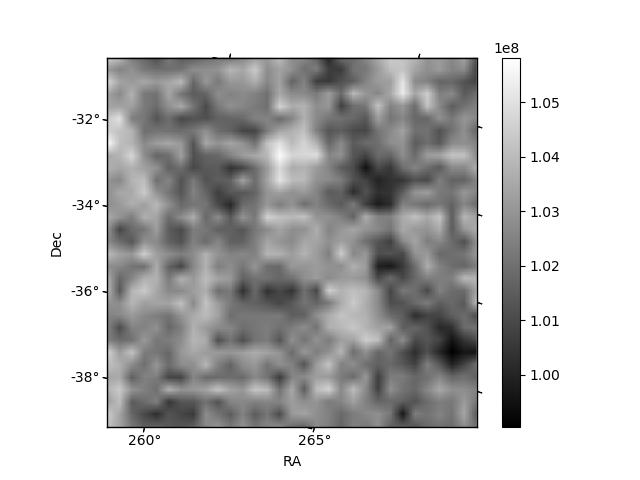
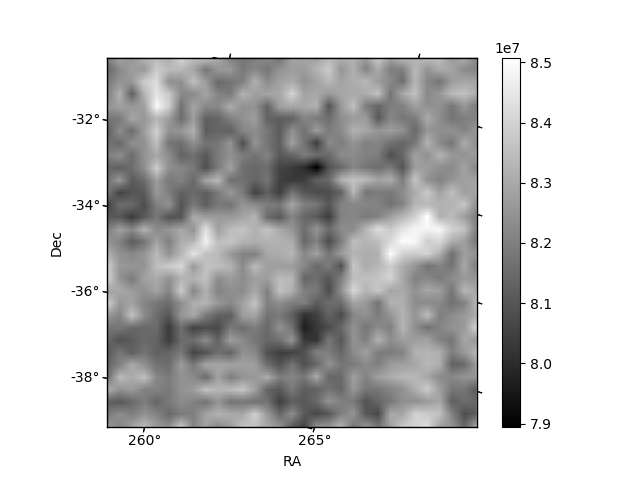
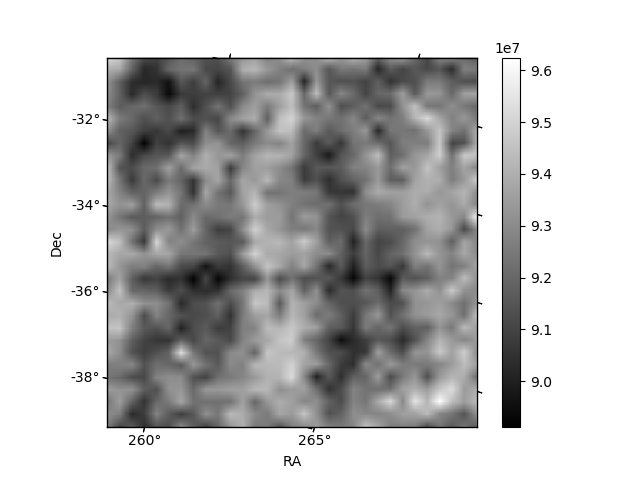
Histogram calculated using DETX and DETY for each event in the final _common_clean file
| Quadrant A | 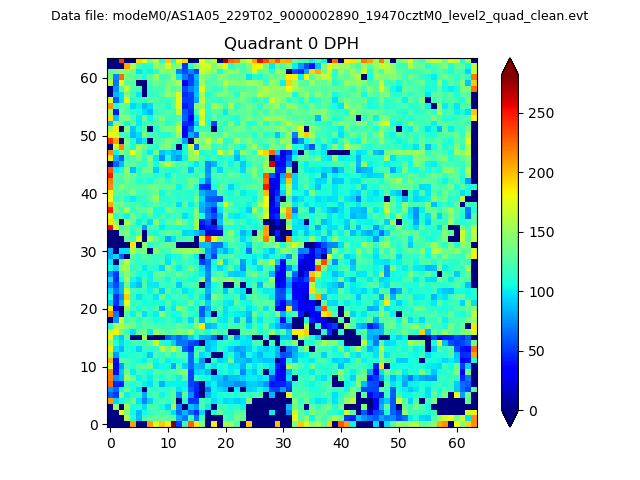 |
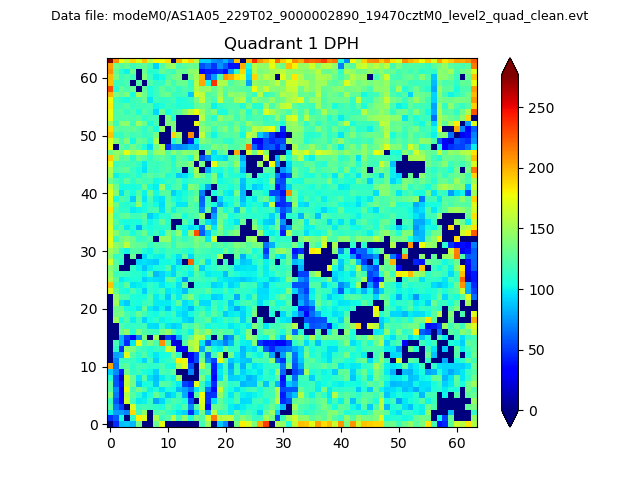 |
Quadrant B |
|---|---|---|---|
| Quadrant D | 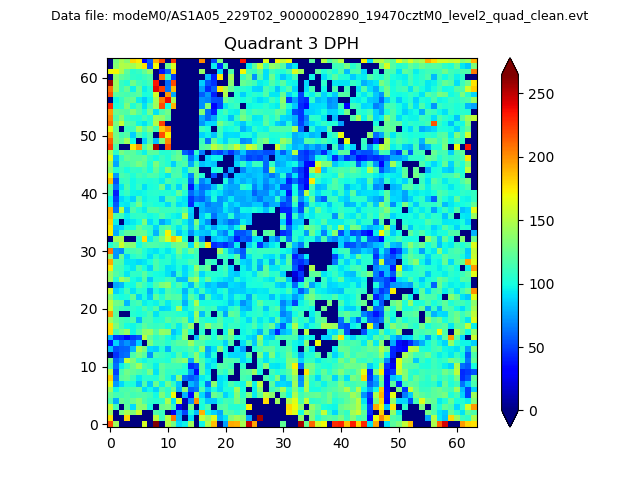 |
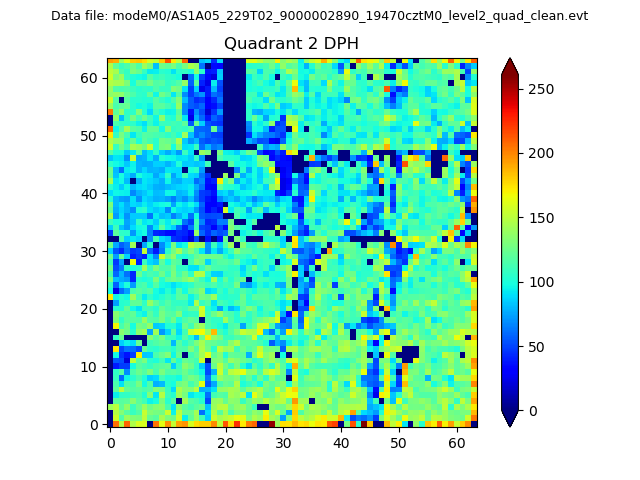 |
Quadrant C |
| Plot type | Count rate plots | Images |
|---|---|---|
| Comparison with Poisson distribution Blue bars denote a histogram of data divided into 1 sec bins. Red curve is a Poisson curve with rate = median count rate of data. |
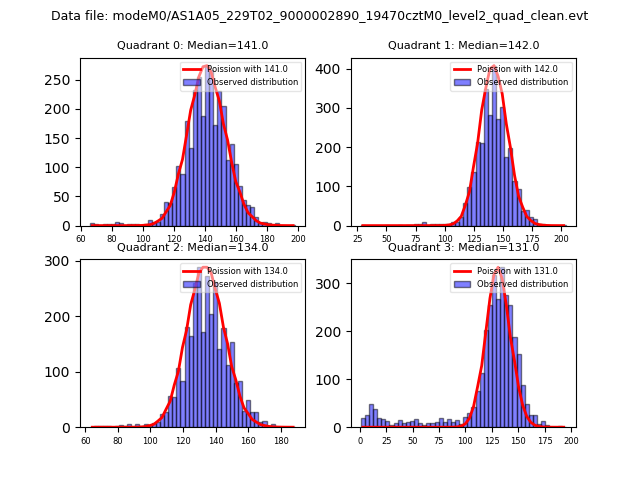 |
 |
| Quadrant-wise count rates Data is divided into 100 sec bins |
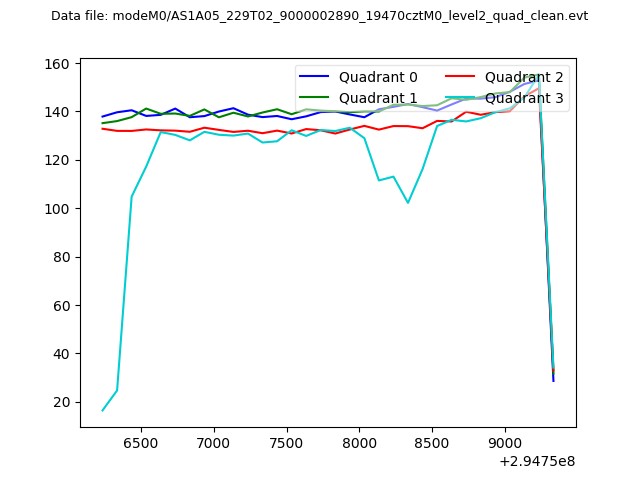 |
|
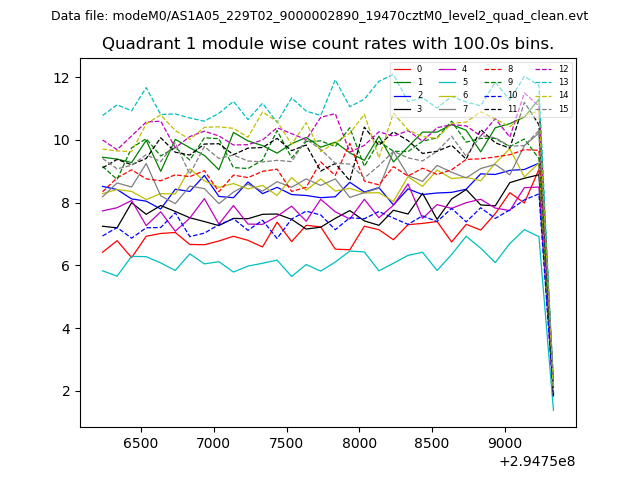
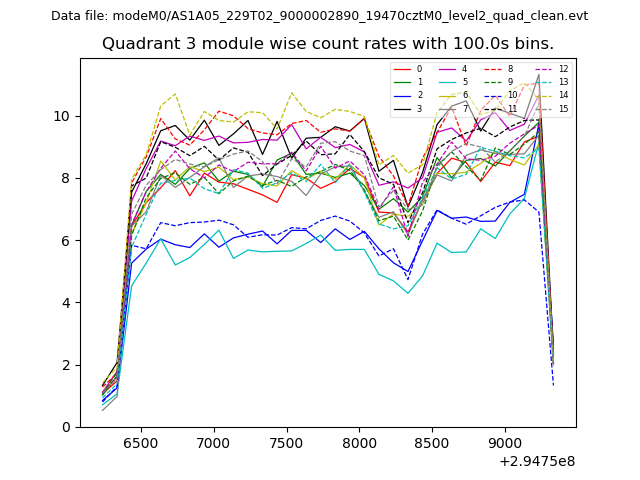
| Module-wise count rates for Quadrant A Data is divided into 100 sec bins |
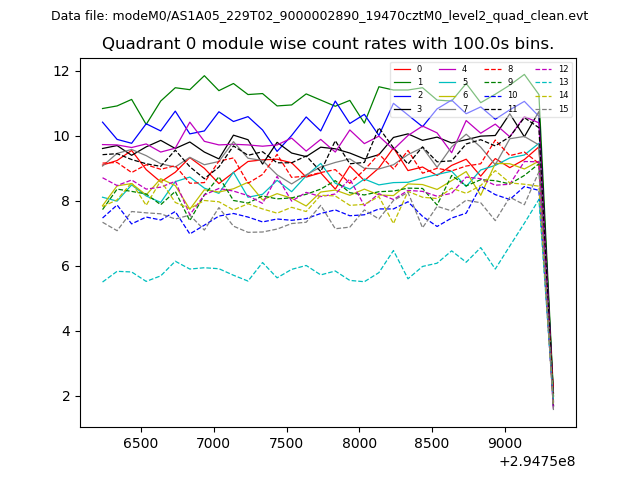 |
 |
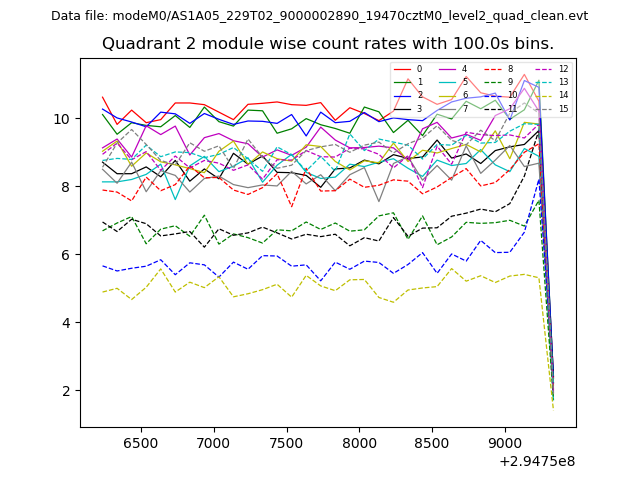
| Module-wise count rates for Quadrant B Data is divided into 100 sec bins |
 |
 |
| Module-wise count rates for Quadrant C Data is divided into 100 sec bins |
 |
 |
| Module-wise count rates for Quadrant D Data is divided into 100 sec bins |
 |
 |
| Parameter | Plot |
|---|---|
| CZT HV Monitor | 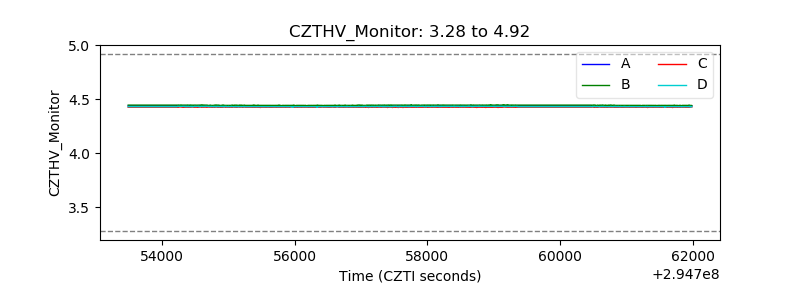 |
| D_VDD | 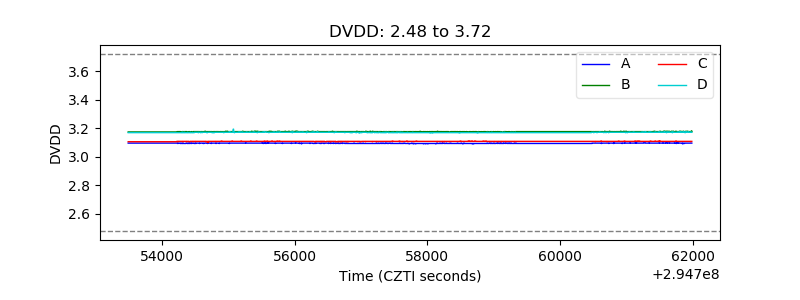 |
| Temperature 1 | 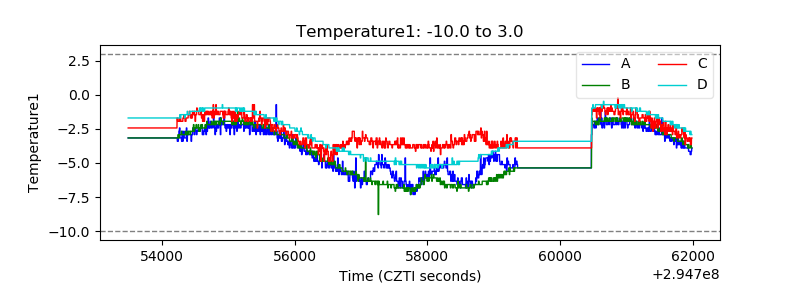 |
| Veto HV Monitor | 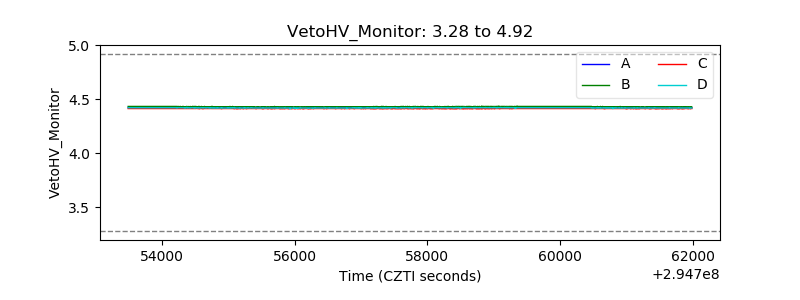 |
| Veto LLD | 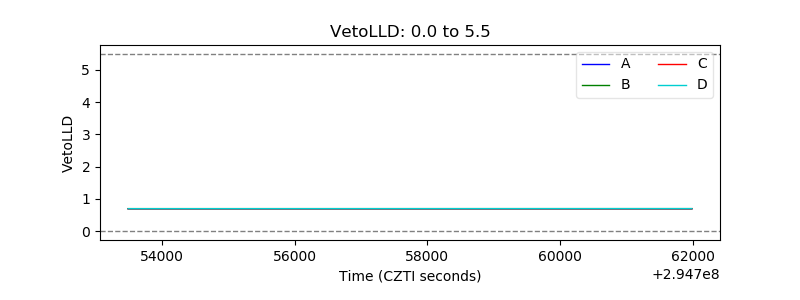 |
| Alpha Counter | 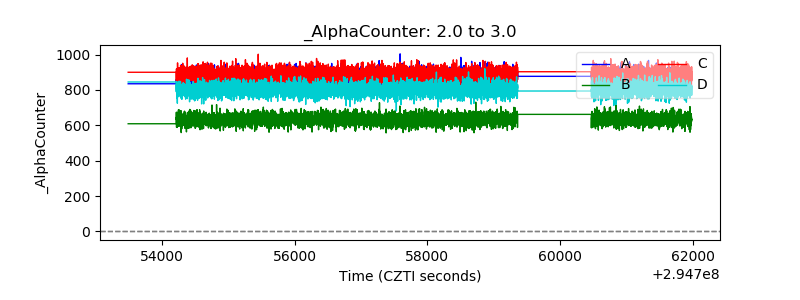 |
| _CPM_Rate | 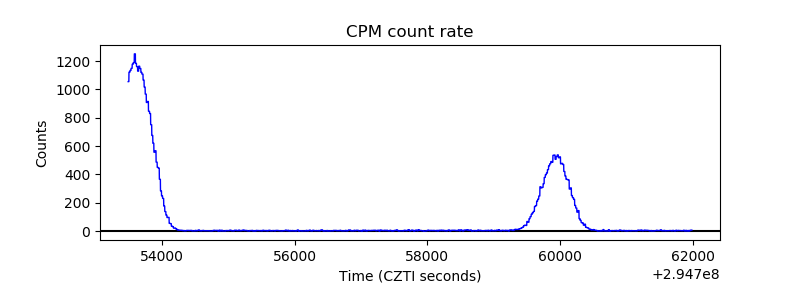 |
| CZT Counter | 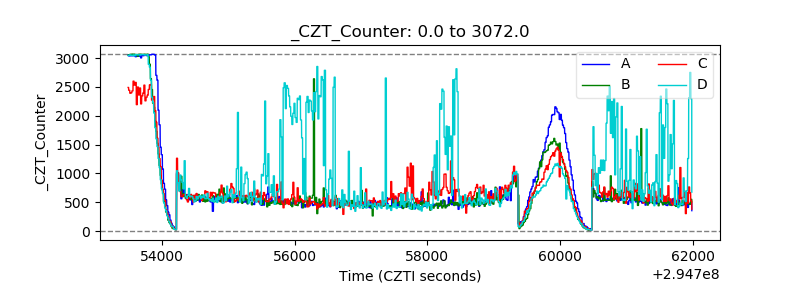 |
| +2.5 Volts monitor | 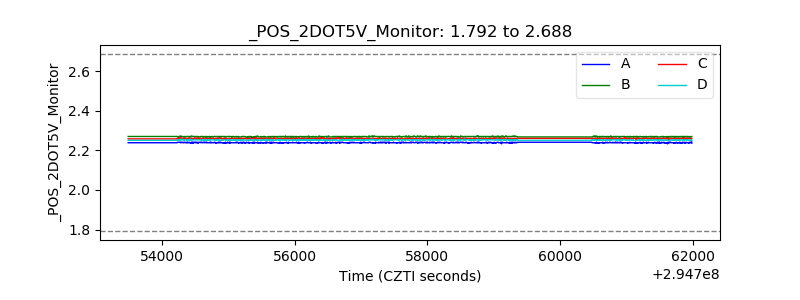 |
| +5 Volts monitor |  |
| _ROLL_ROT | 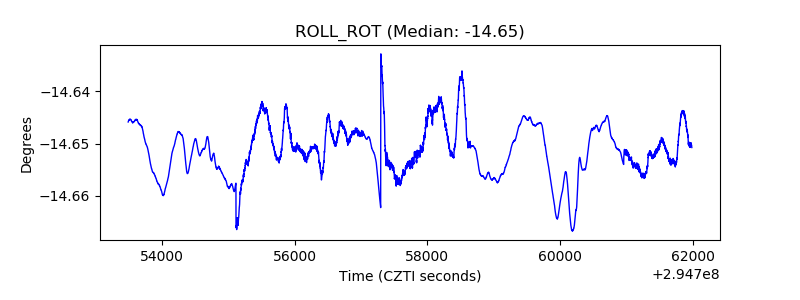 |
| _Roll_DEC | 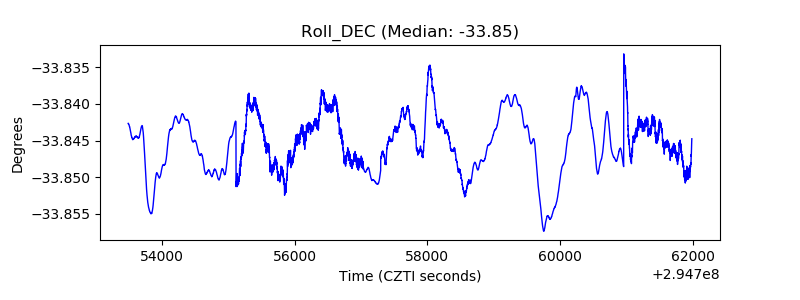 |
| _Roll_RA | 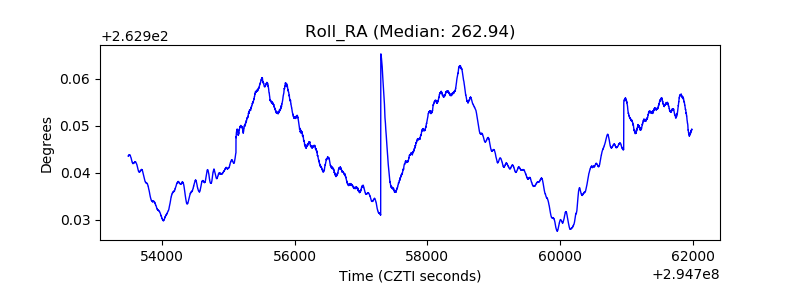 |
| Veto Counter | 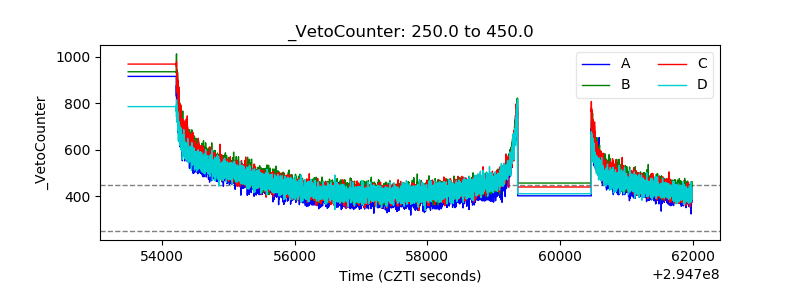 |