| Param | Original file | Final file |
|---|---|---|
| Filename | modeM0/AS1A05_229T02_9000002890_19473cztM0_level2.evt | modeM0/AS1A05_229T02_9000002890_19473cztM0_level2_quad_clean.evt |
| Size (bytes) | 576,708,480 | 94,821,120 |
| Size | 550.0 MB | 90.4 MB |
| Events in quadrant A | 3,625,793 | 596,440 |
| Events in quadrant B | 3,787,485 | 602,474 |
| Events in quadrant C | 5,089,976 | 577,276 |
| Events in quadrant D | 4,451,090 | 570,605 |
| Mode M0 | |||
|---|---|---|---|
| Quadrant | BADHDUFLAG | Total packets | Discarded packets |
| A | 0 | 15682 | 2 |
| B | 0 | 16055 | 2 |
| C | 0 | 20248 | 2 |
| D | 0 | 18425 | 4 |
| Mode SS | |||
|---|---|---|---|
| Quadrant | BADHDUFLAG | Total packets | Discarded packets |
| A | 0 | 156 | 0 |
| B | 0 | 156 | 0 |
| C | 0 | 156 | 0 |
| D | 0 | 156 | 0 |
| Mode M9 | |||
|---|---|---|---|
| Quadrant | BADHDUFLAG | Total packets | Discarded packets |
| A | 0 | 7 | 0 |
| B | 0 | 7 | 0 |
| C | 0 | 7 | 0 |
| D | 0 | 7 | 0 |
| Quadrant | Total seconds | Saturated seconds | Saturation percentage |
|---|---|---|---|
| A | 7537 | 79 | 1.048162% |
| B | 7538 | 133 | 1.764394% |
| C | 7538 | 235 | 3.117538% |
| D | 7537 | 237 | 3.144487% |
Noise dominated data is calculated using 1-second bins in cleaned event files. If a bin has >2000 counts, and if more than 50% of those come from <1% of pixels, then it is considered to be noise-dominated and hence unusable.
| Quadrant | # 1 sec bins | Bins with >0 counts | Bins with >2000 counts | High rate bins dominated by noise | Noise dominated (total time) | Noise dominated (detector-on time) | Marked lightcurve |
|---|---|---|---|---|---|---|---|
| A | 8252 | 7539 | 9 | 9 | 0.11% | 0.12% | 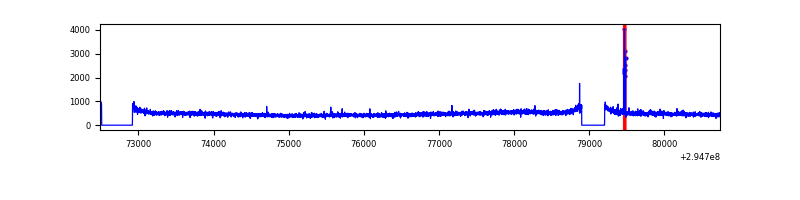 |
| B | 8253 | 7540 | 28 | 28 | 0.34% | 0.37% | 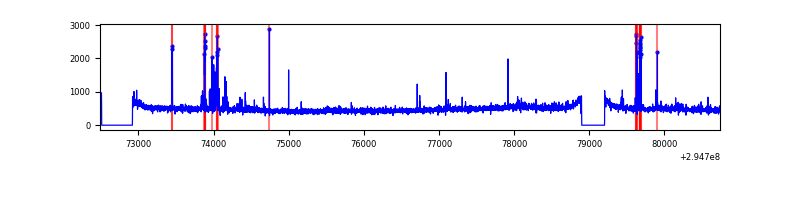 |
| C | 8253 | 7538 | 5 | 5 | 0.06% | 0.07% | 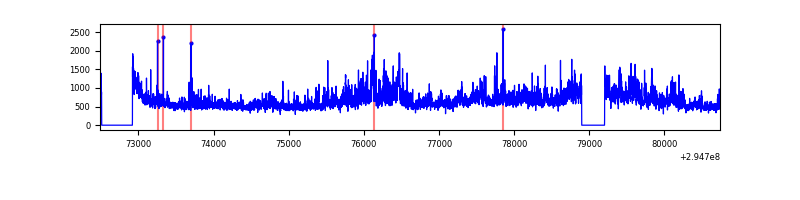 |
| D | 8252 | 7538 | 150 | 150 | 1.82% | 1.99% | 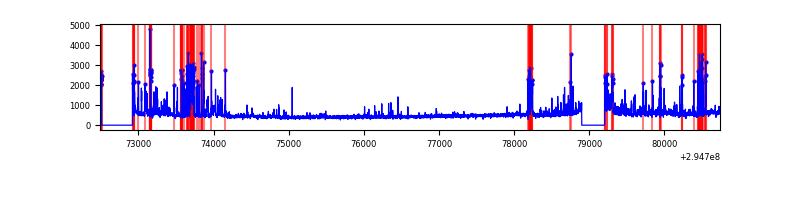 |
Top three noisy pixels from each quadrant. If the there are fewer than three noisy pixels in the level2.evt file, extra rows are filled as -1
| Pixel properties | Quadrant properties | ||||||
|---|---|---|---|---|---|---|---|
| Quadrant | DetID | PixID | Counts | Sigma | Mean | Median | Sigma |
| A | 4 | 2 | 35064 | 183.28 | 920 | 900 | 186.4 |
| A | 11 | 29 | 24790 | 128.16 | 920 | 900 | 186.4 |
| A | 3 | 1 | 17802 | 90.67 | 920 | 900 | 186.4 |
| B | 7 | 220 | 108377 | 608.15 | 916 | 891 | 176.7 |
| B | 0 | 197 | 24822 | 135.4 | 916 | 891 | 176.7 |
| B | 3 | 64 | 23234 | 126.41 | 916 | 891 | 176.7 |
| C | 3 | 233 | 1114353 | 5396.74 | 875 | 878 | 206.3 |
| C | 9 | 221 | 381116 | 1842.92 | 875 | 878 | 206.3 |
| C | 14 | 238 | 135741 | 653.65 | 875 | 878 | 206.3 |
| D | 1 | 52 | 442395 | 2058.0 | 880 | 855 | 214.5 |
| D | 12 | 218 | 266110 | 1236.35 | 880 | 855 | 214.5 |
| D | 7 | 238 | 212412 | 986.06 | 880 | 855 | 214.5 |
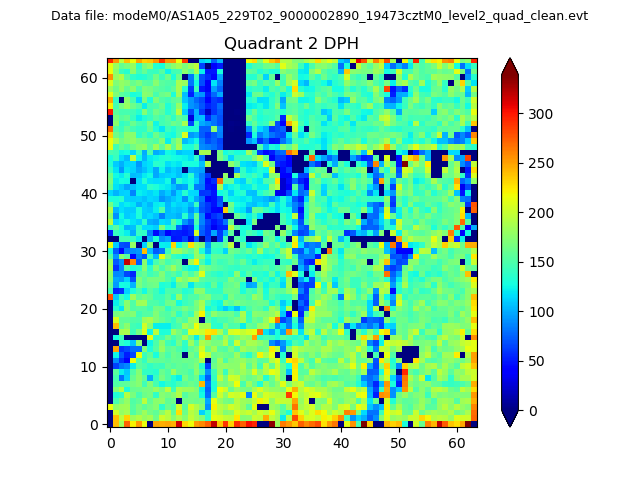
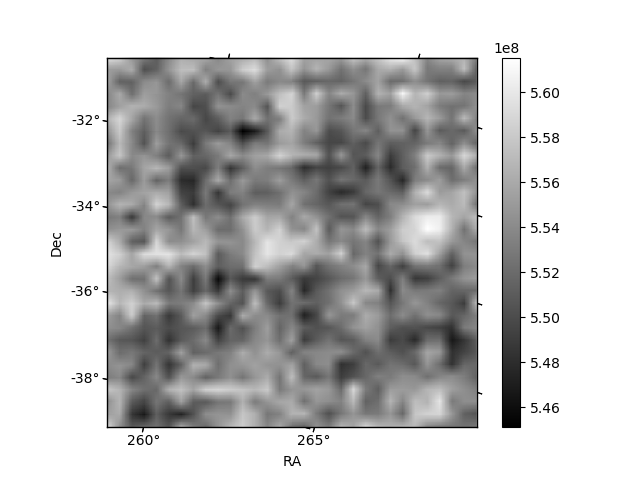
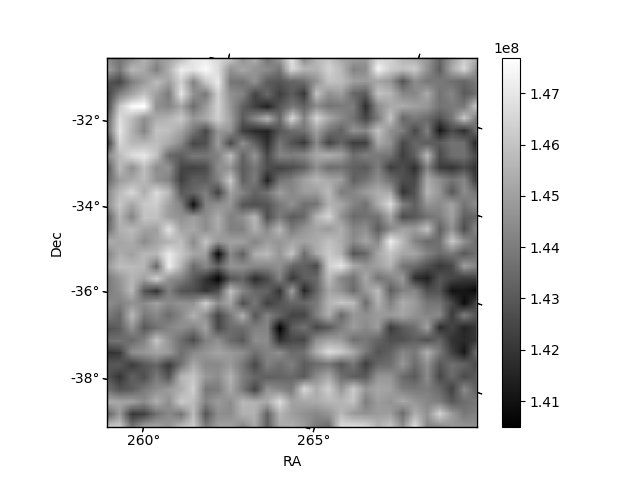
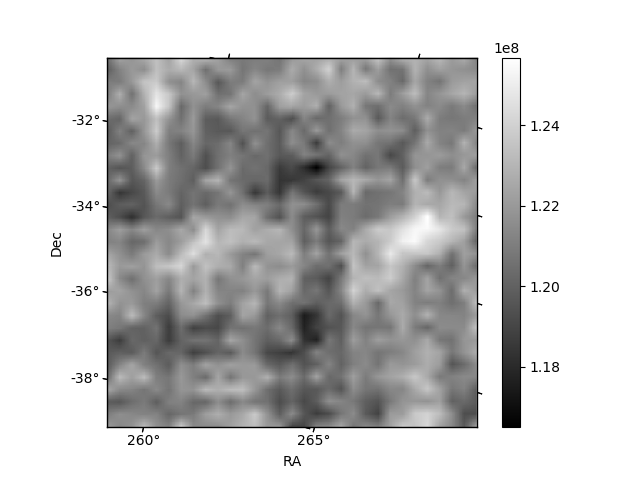
Histogram calculated using DETX and DETY for each event in the final _common_clean file
| Quadrant A | 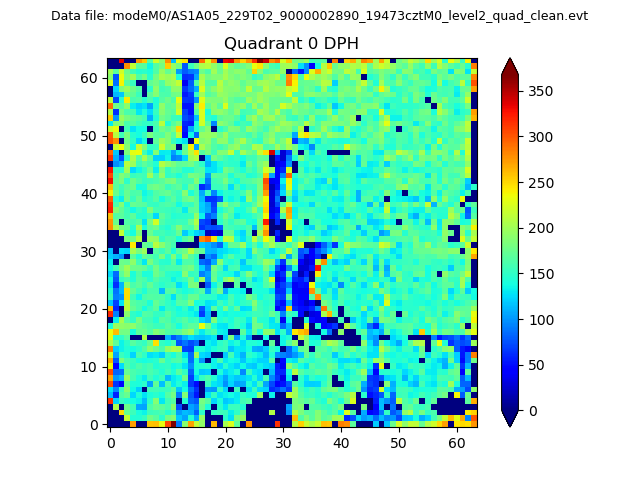 |
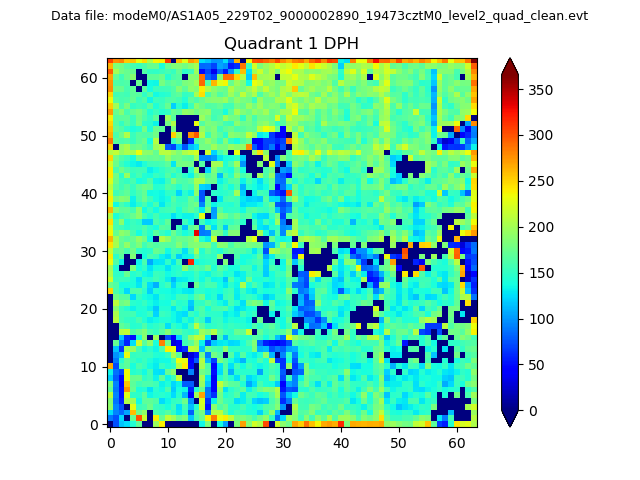 |
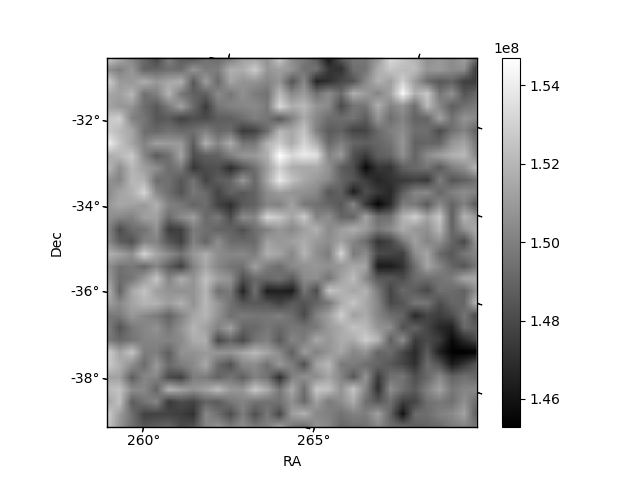
Quadrant B |
|---|---|---|---|
| Quadrant D | 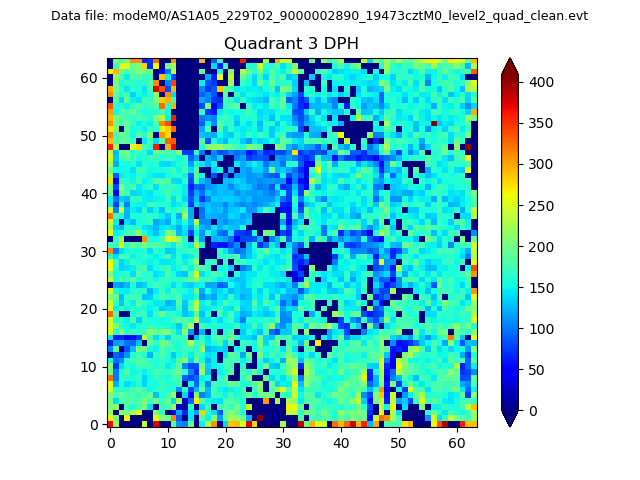 |
 |
Quadrant C |
| Plot type | Count rate plots | Images |
|---|---|---|
| Comparison with Poisson distribution Blue bars denote a histogram of data divided into 1 sec bins. Red curve is a Poisson curve with rate = median count rate of data. |
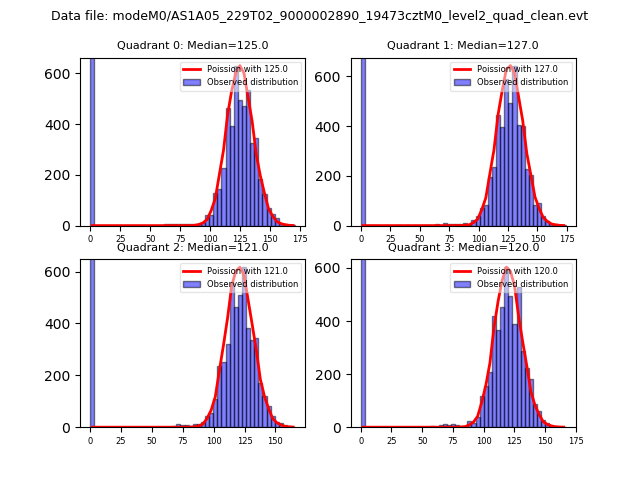 |
 |
| Quadrant-wise count rates Data is divided into 100 sec bins |
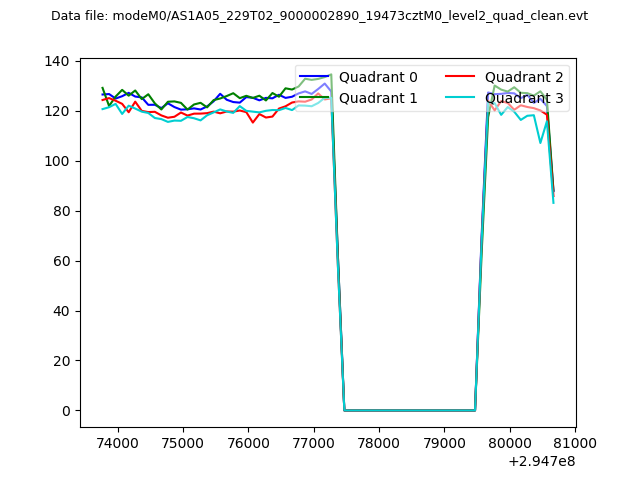 |
|
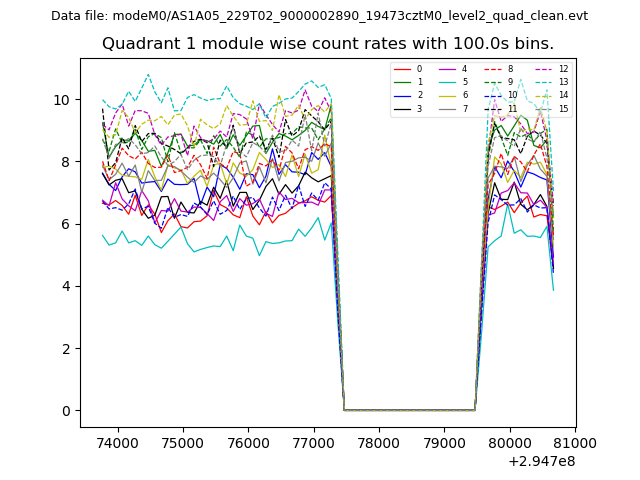
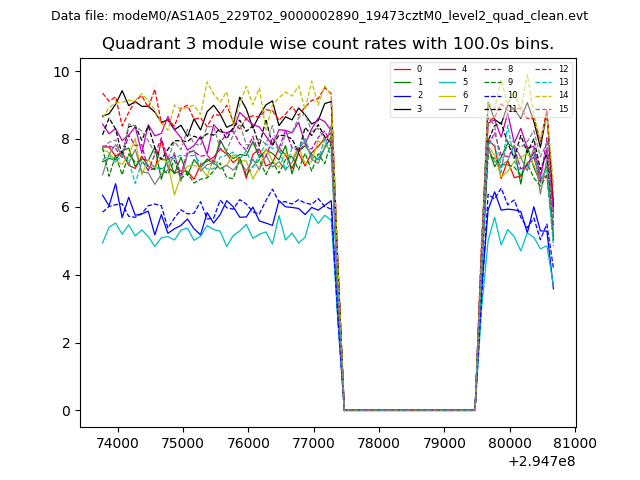
| Module-wise count rates for Quadrant A Data is divided into 100 sec bins |
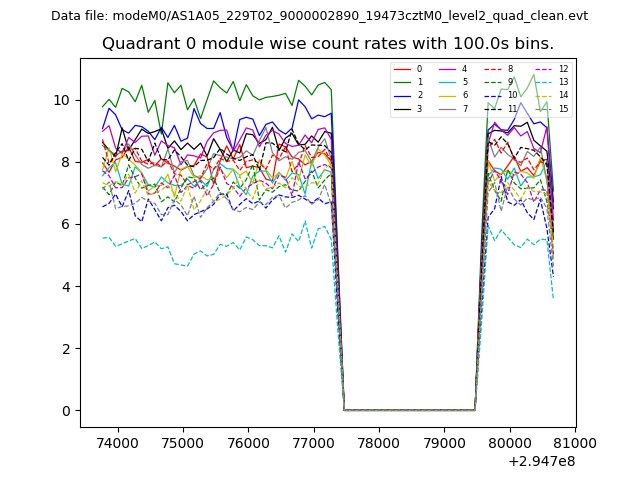 |
 |
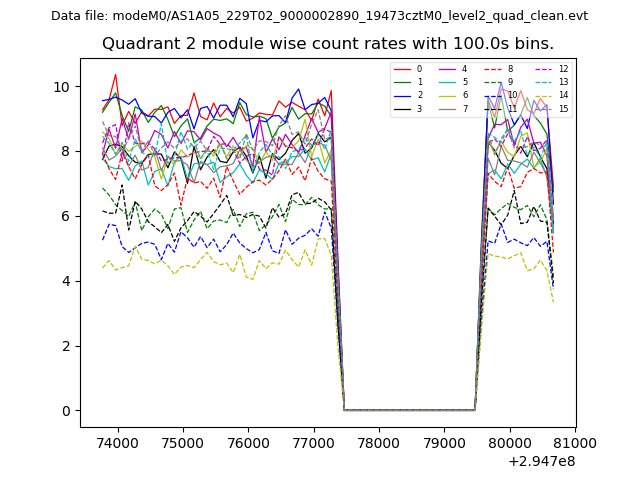
| Module-wise count rates for Quadrant B Data is divided into 100 sec bins |
 |
 |
| Module-wise count rates for Quadrant C Data is divided into 100 sec bins |
 |
 |
| Module-wise count rates for Quadrant D Data is divided into 100 sec bins |
 |
 |
| Parameter | Plot |
|---|---|
| CZT HV Monitor | 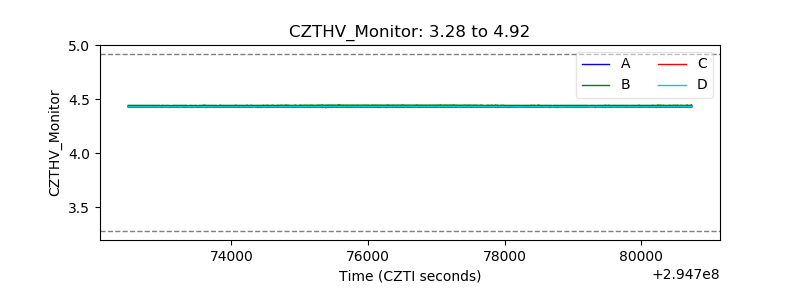 |
| D_VDD | 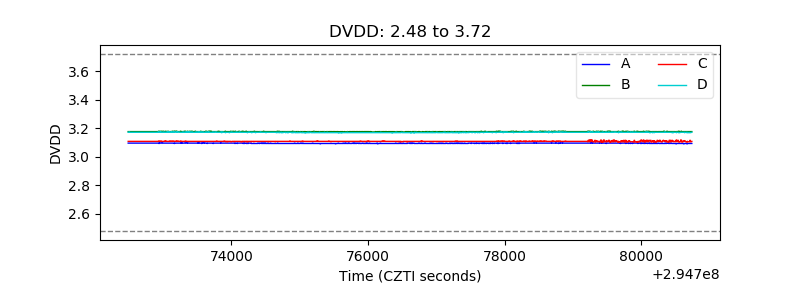 |
| Temperature 1 | 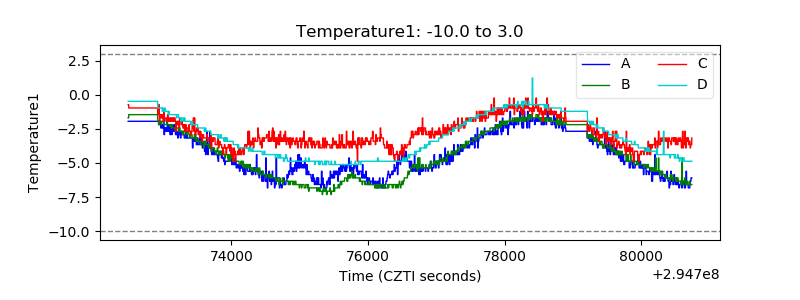 |
| Veto HV Monitor | 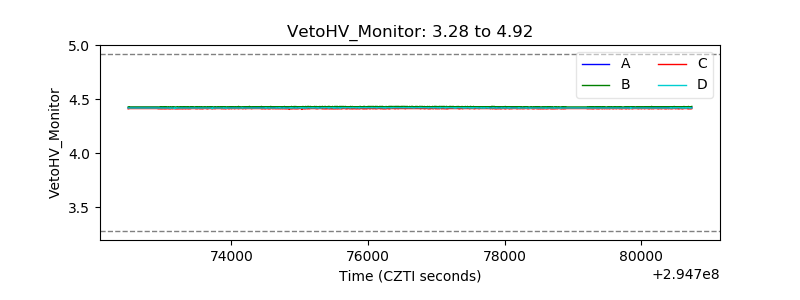 |
| Veto LLD | 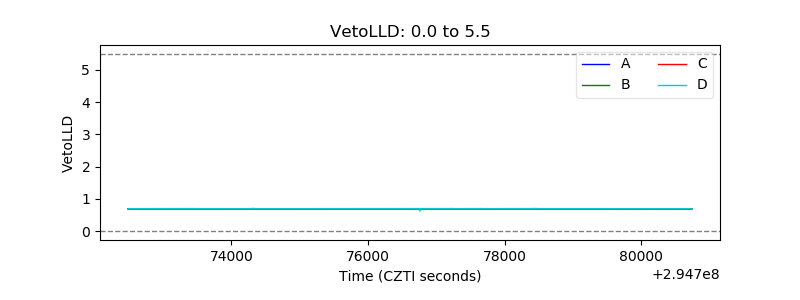 |
| Alpha Counter | 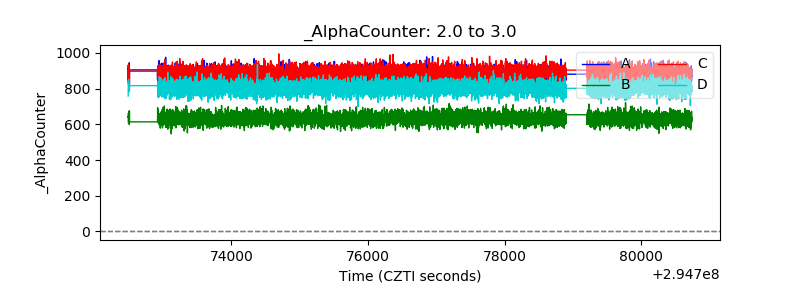 |
| _CPM_Rate | 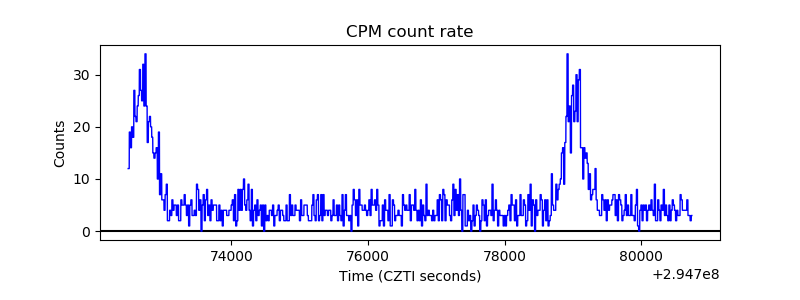 |
| CZT Counter | 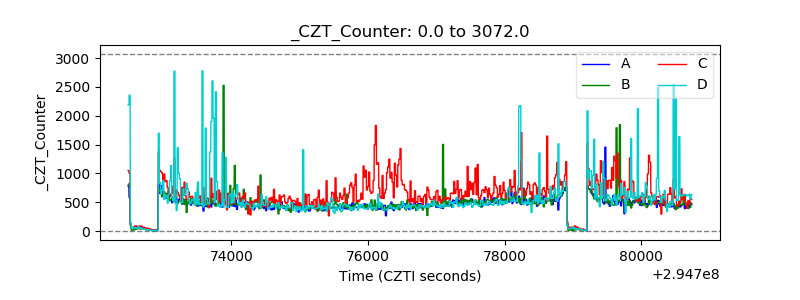 |
| +2.5 Volts monitor |  |
| +5 Volts monitor |  |
| _ROLL_ROT | 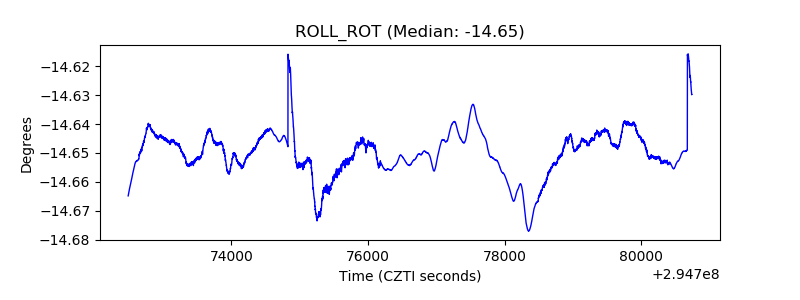 |
| _Roll_DEC | 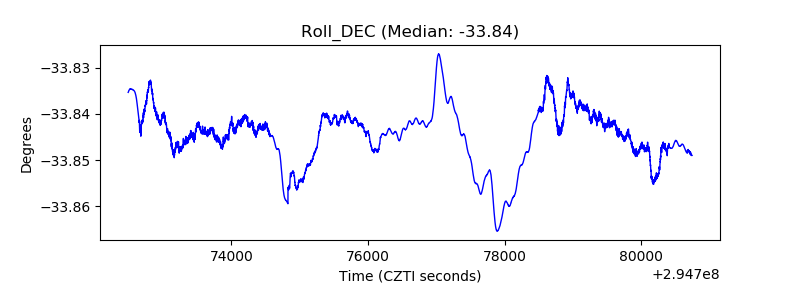 |
| _Roll_RA | 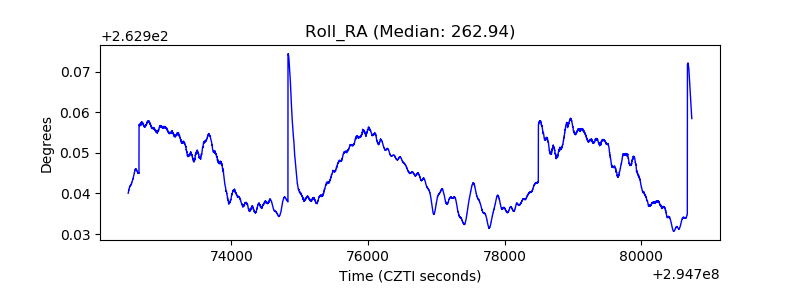 |
| Veto Counter | 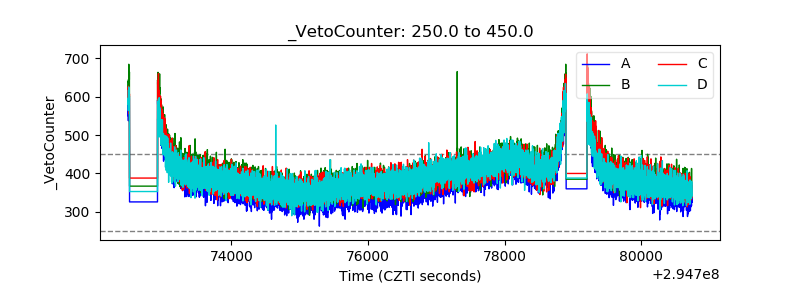 |