| Param | Original file | Final file |
|---|---|---|
| Filename | modeM0/AS1A05_229T02_9000002890_19480cztM0_level2.evt | modeM0/AS1A05_229T02_9000002890_19480cztM0_level2_quad_clean.evt |
| Size (bytes) | 2,776,864,320 | 430,427,520 |
| Size | 2.6 GB | 410.5 MB |
| Events in quadrant A | 16,477,777 | 2,746,003 |
| Events in quadrant B | 17,785,326 | 2,777,790 |
| Events in quadrant C | 19,319,406 | 2,680,766 |
| Events in quadrant D | 28,207,527 | 2,479,079 |
| Mode M0 | |||
|---|---|---|---|
| Quadrant | BADHDUFLAG | Total packets | Discarded packets |
| A | 0 | 70972 | 7 |
| B | 0 | 74846 | 7 |
| C | 0 | 78588 | 9 |
| D | 0 | 107066 | 7 |
| Mode SS | |||
|---|---|---|---|
| Quadrant | BADHDUFLAG | Total packets | Discarded packets |
| A | 0 | 694 | 0 |
| B | 0 | 694 | 0 |
| C | 0 | 694 | 0 |
| D | 0 | 694 | 0 |
| Mode M9 | |||
|---|---|---|---|
| Quadrant | BADHDUFLAG | Total packets | Discarded packets |
| A | 0 | 50 | 0 |
| B | 0 | 51 | 0 |
| C | 0 | 51 | 0 |
| D | 0 | 51 | 0 |
| Quadrant | Total seconds | Saturated seconds | Saturation percentage |
|---|---|---|---|
| A | 34259 | 161 | 0.469950% |
| B | 34259 | 438 | 1.278496% |
| C | 34258 | 443 | 1.293129% |
| D | 34258 | 3202 | 9.346722% |
Noise dominated data is calculated using 1-second bins in cleaned event files. If a bin has >2000 counts, and if more than 50% of those come from <1% of pixels, then it is considered to be noise-dominated and hence unusable.
| Quadrant | # 1 sec bins | Bins with >0 counts | Bins with >2000 counts | High rate bins dominated by noise | Noise dominated (total time) | Noise dominated (detector-on time) | Marked lightcurve |
|---|---|---|---|---|---|---|---|
| A | 39159 | 34262 | 36 | 36 | 0.09% | 0.11% | 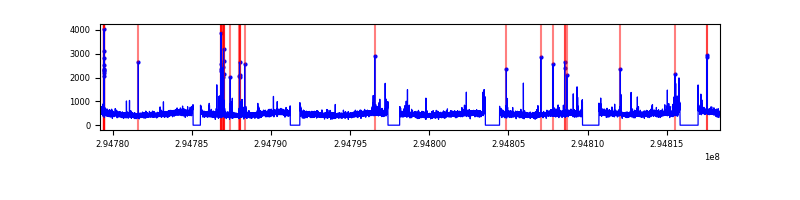 |
| B | 39159 | 34264 | 145 | 145 | 0.37% | 0.42% | 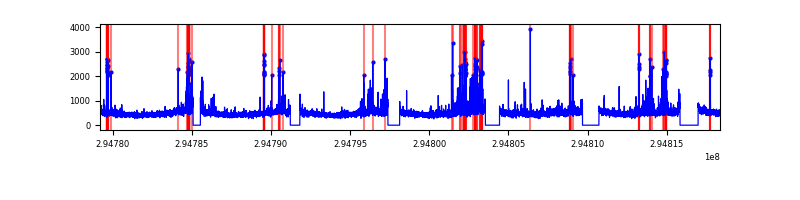 |
| C | 39158 | 34261 | 15 | 15 | 0.04% | 0.04% | 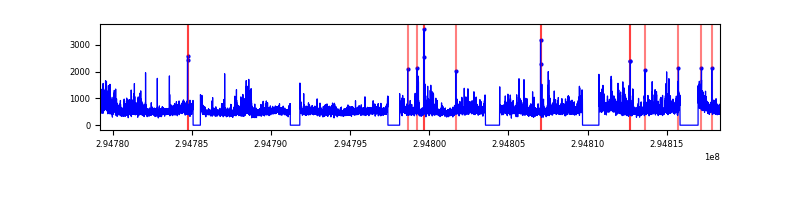 |
| D | 39158 | 34261 | 2821 | 2821 | 7.20% | 8.23% | 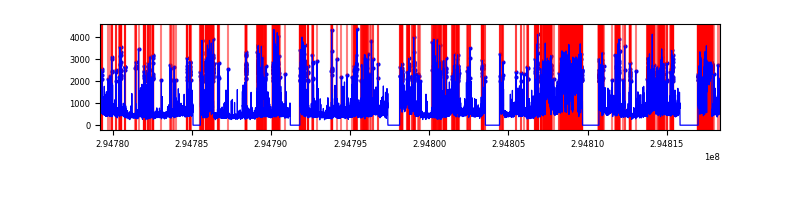 |
Top three noisy pixels from each quadrant. If the there are fewer than three noisy pixels in the level2.evt file, extra rows are filled as -1
| Pixel properties | Quadrant properties | ||||||
|---|---|---|---|---|---|---|---|
| Quadrant | DetID | PixID | Counts | Sigma | Mean | Median | Sigma |
| A | 4 | 2 | 167971 | 195.55 | 4172 | 4083 | 838.1 |
| A | 5 | 16 | 130733 | 151.12 | 4172 | 4083 | 838.1 |
| A | 11 | 29 | 59126 | 65.68 | 4172 | 4083 | 838.1 |
| B | 3 | 112 | 543180 | 687.22 | 4143 | 4040 | 784.5 |
| B | 7 | 220 | 484265 | 612.12 | 4143 | 4040 | 784.5 |
| B | 0 | 198 | 113779 | 139.88 | 4143 | 4040 | 784.5 |
| C | 9 | 221 | 1850127 | 1981.24 | 4020 | 4052 | 931.8 |
| C | 3 | 233 | 1151304 | 1231.25 | 4020 | 4052 | 931.8 |
| C | 14 | 238 | 623495 | 664.8 | 4020 | 4052 | 931.8 |
| D | 7 | 238 | 5806975 | 6096.4 | 3912 | 3802 | 951.9 |
| D | 1 | 52 | 3851724 | 4042.35 | 3912 | 3802 | 951.9 |
| D | 7 | 223 | 1316539 | 1379.07 | 3912 | 3802 | 951.9 |
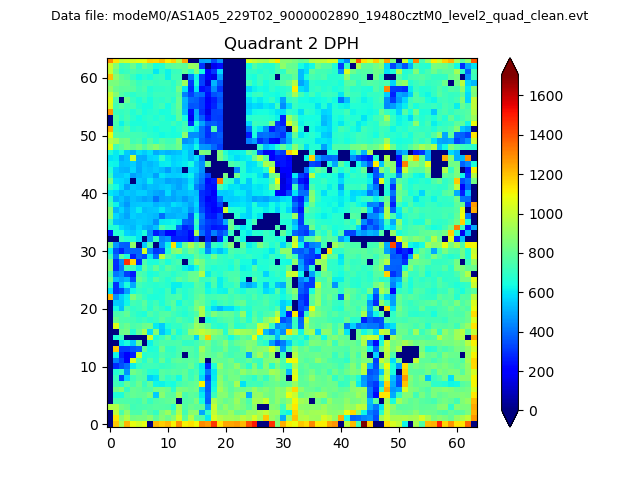
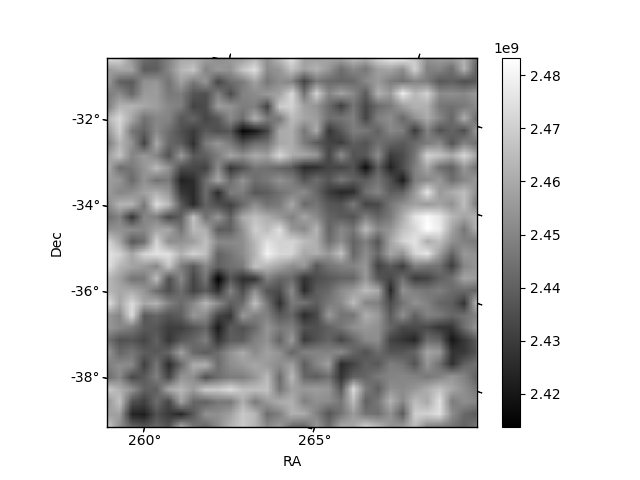
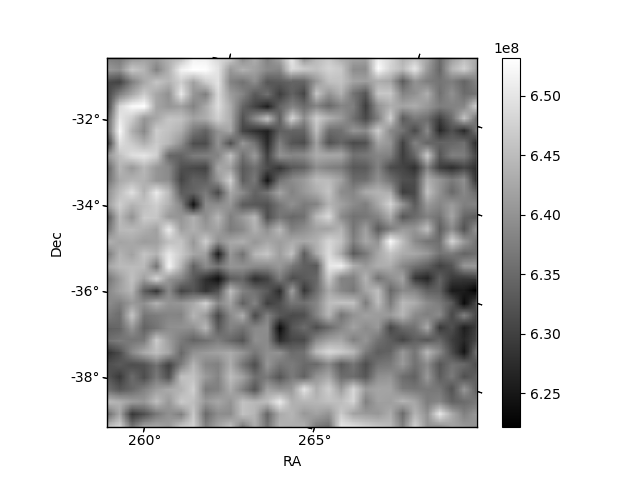
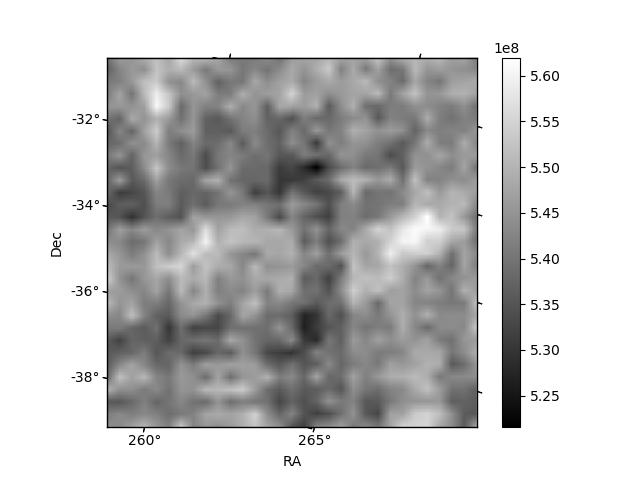
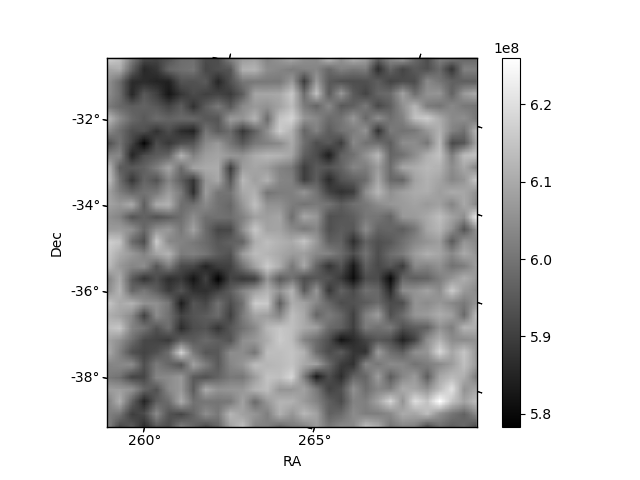
Histogram calculated using DETX and DETY for each event in the final _common_clean file
| Quadrant A | 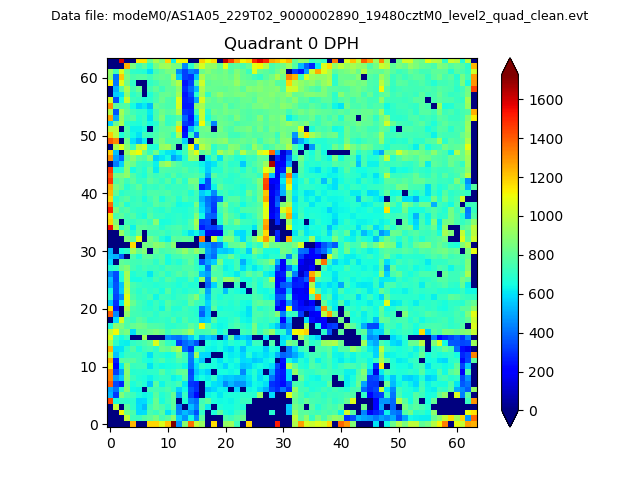 |
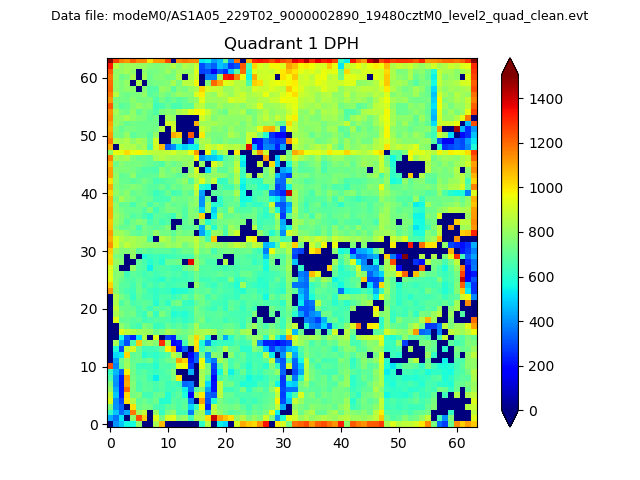 |
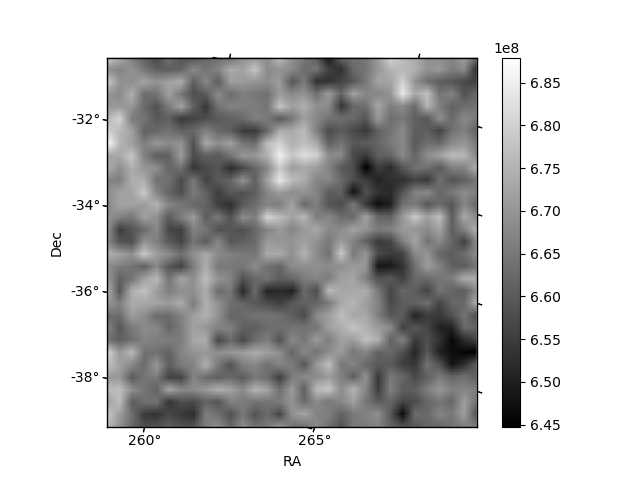
Quadrant B |
|---|---|---|---|
| Quadrant D | 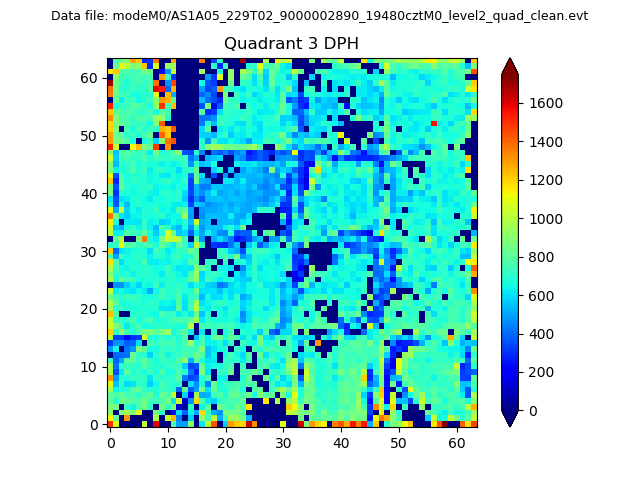 |
 |
Quadrant C |
| Plot type | Count rate plots | Images |
|---|---|---|
| Comparison with Poisson distribution Blue bars denote a histogram of data divided into 1 sec bins. Red curve is a Poisson curve with rate = median count rate of data. |
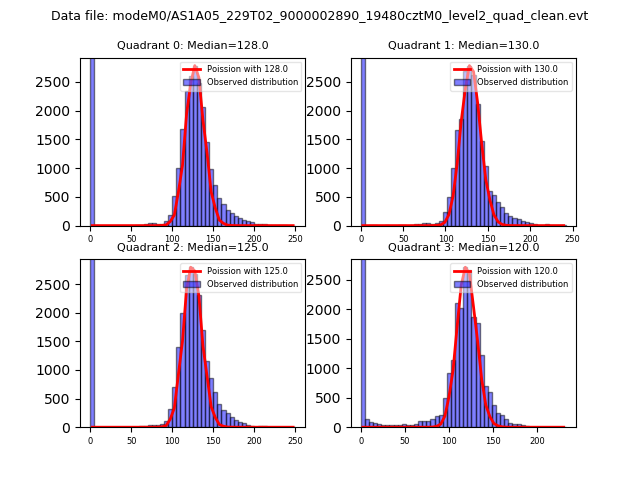 |
 |
| Quadrant-wise count rates Data is divided into 100 sec bins |
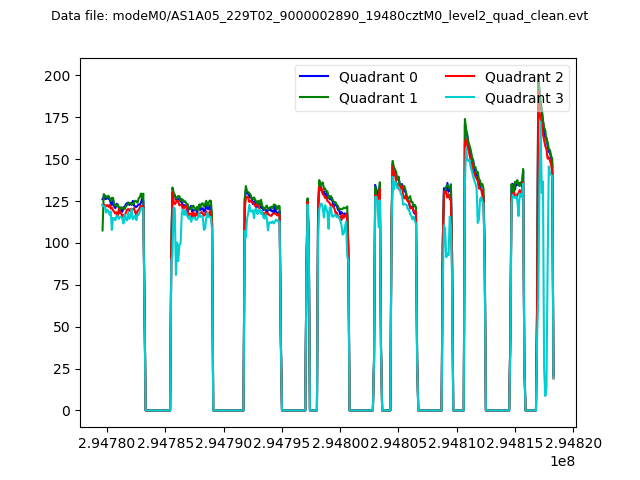 |
|
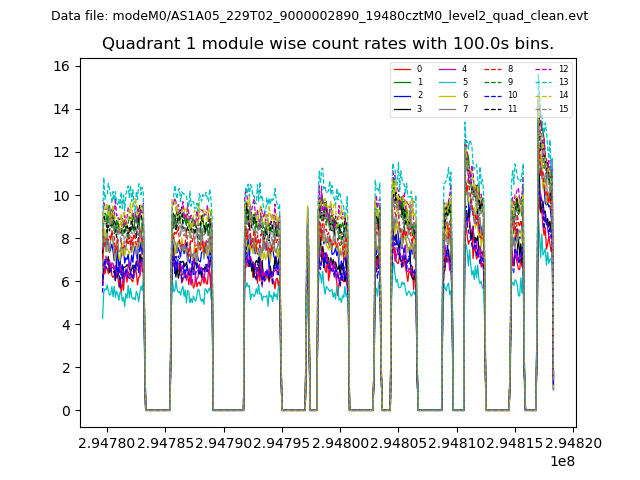
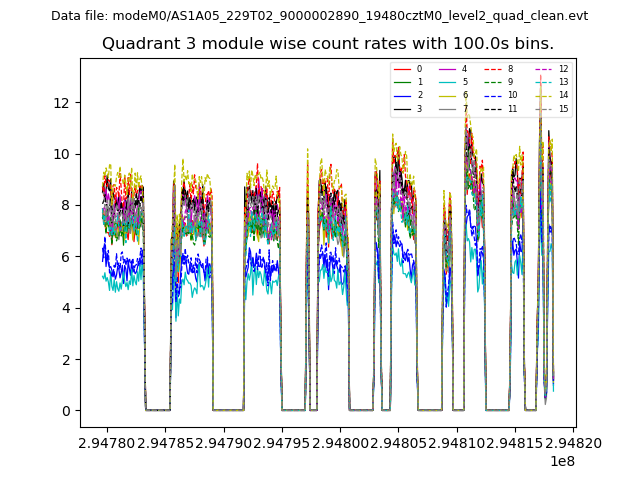
| Module-wise count rates for Quadrant A Data is divided into 100 sec bins |
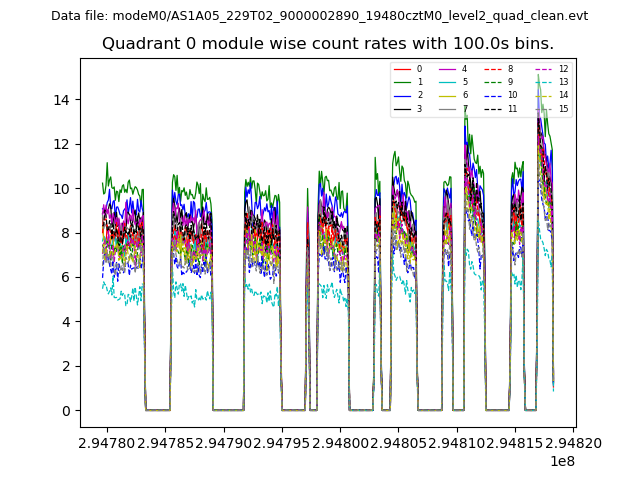 |
 |
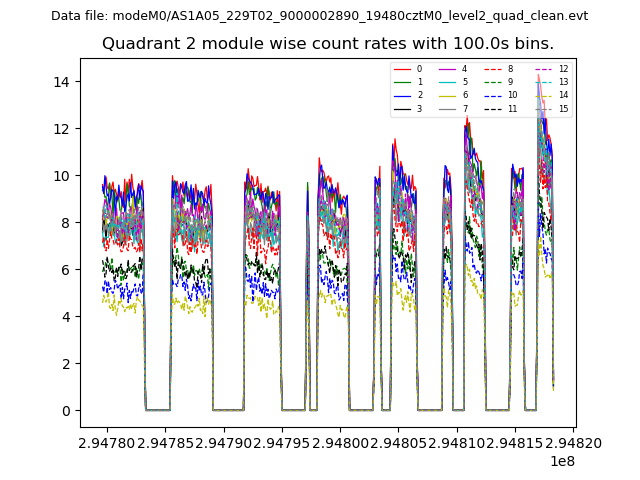
| Module-wise count rates for Quadrant B Data is divided into 100 sec bins |
 |
 |
| Module-wise count rates for Quadrant C Data is divided into 100 sec bins |
 |
 |
| Module-wise count rates for Quadrant D Data is divided into 100 sec bins |
 |
 |
| Parameter | Plot |
|---|---|
| CZT HV Monitor | 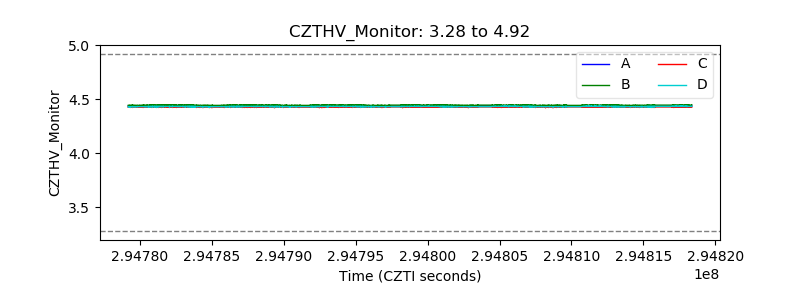 |
| D_VDD |  |
| Temperature 1 |  |
| Veto HV Monitor | 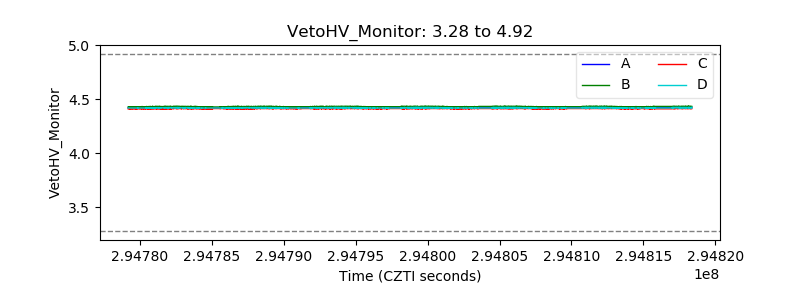 |
| Veto LLD | 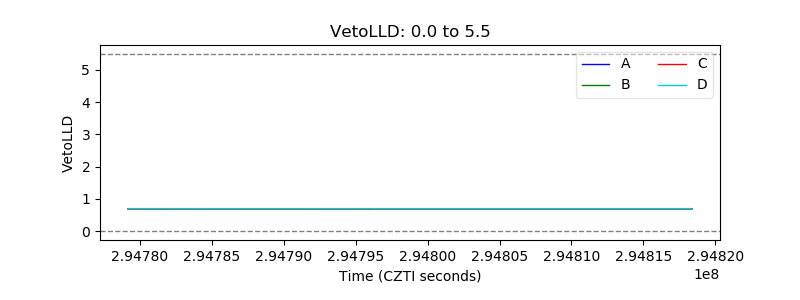 |
| Alpha Counter |  |
| _CPM_Rate | 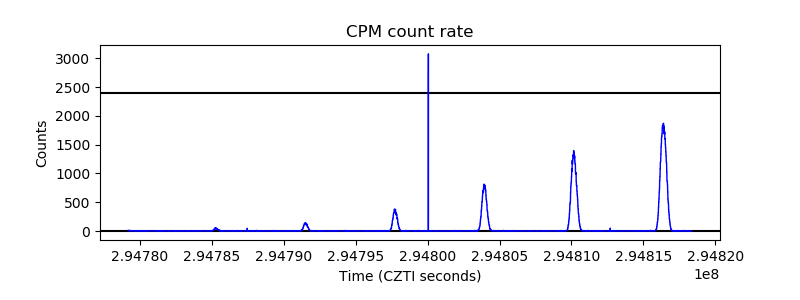 |
| CZT Counter | 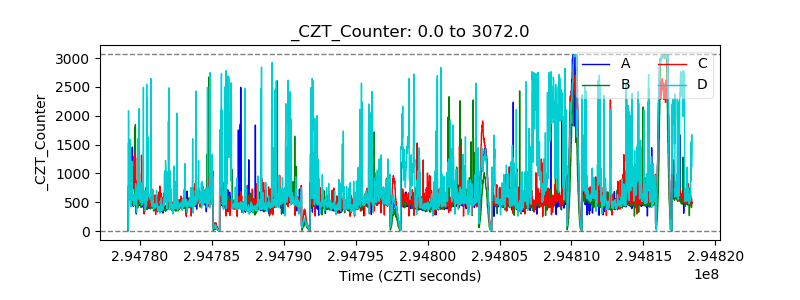 |
| +2.5 Volts monitor |  |
| +5 Volts monitor | 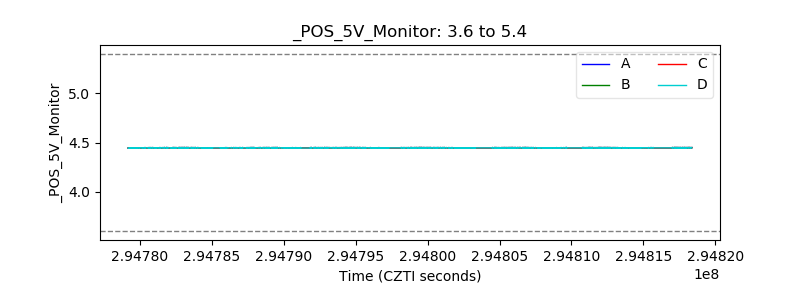 |
| _ROLL_ROT | 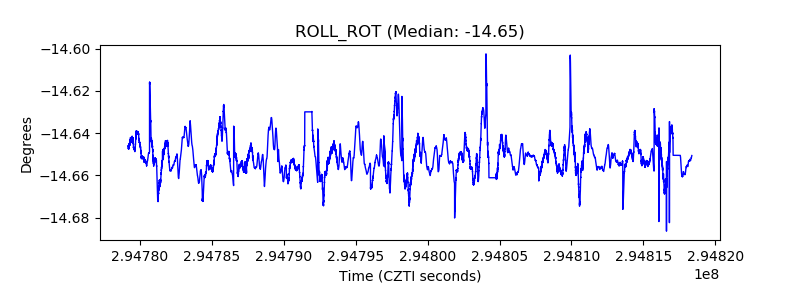 |
| _Roll_DEC | 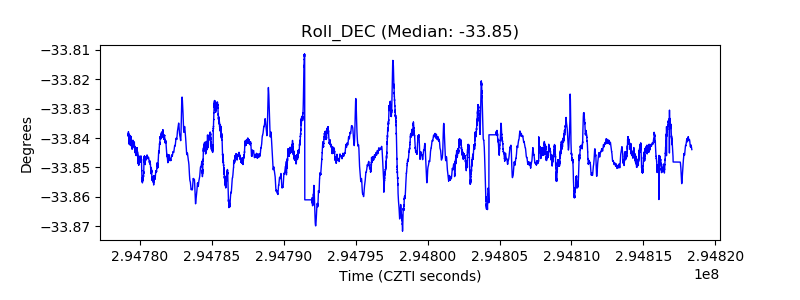 |
| _Roll_RA | 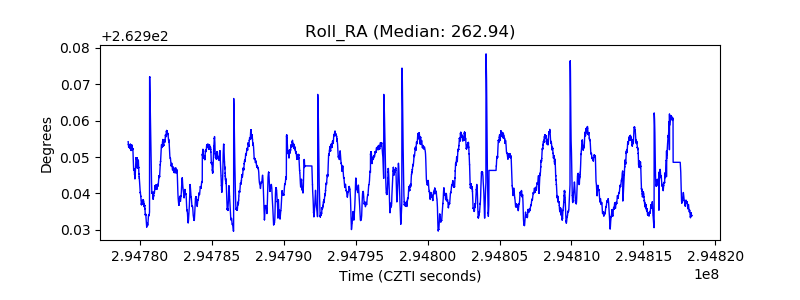 |
| Veto Counter | 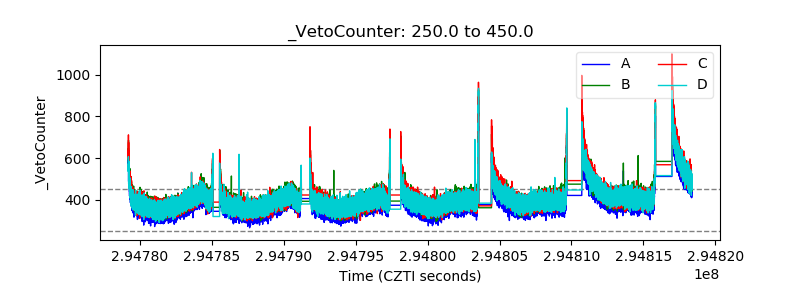 |