| Param | Original file | Final file |
|---|---|---|
| Filename | modeM0/AS1A05_229T02_9000002890_19483cztM0_level2.evt | modeM0/AS1A05_229T02_9000002890_19483cztM0_level2_quad_clean.evt |
| Size (bytes) | 539,530,560 | 72,524,160 |
| Size | 514.5 MB | 69.2 MB |
| Events in quadrant A | 3,505,114 | 450,462 |
| Events in quadrant B | 3,824,680 | 451,940 |
| Events in quadrant C | 3,781,246 | 430,767 |
| Events in quadrant D | 4,793,612 | 414,823 |
| Mode M0 | |||
|---|---|---|---|
| Quadrant | BADHDUFLAG | Total packets | Discarded packets |
| A | 0 | 14242 | 2 |
| B | 0 | 15327 | 2 |
| C | 0 | 15391 | 2 |
| D | 0 | 18392 | 2 |
| Mode SS | |||
|---|---|---|---|
| Quadrant | BADHDUFLAG | Total packets | Discarded packets |
| A | 0 | 132 | 0 |
| B | 0 | 132 | 0 |
| C | 0 | 132 | 0 |
| D | 0 | 132 | 0 |
| Mode M9 | |||
|---|---|---|---|
| Quadrant | BADHDUFLAG | Total packets | Discarded packets |
| A | 0 | 14 | 0 |
| B | 0 | 15 | 0 |
| C | 0 | 15 | 0 |
| D | 0 | 15 | 0 |
| Quadrant | Total seconds | Saturated seconds | Saturation percentage |
|---|---|---|---|
| A | 6414 | 108 | 1.683817% |
| B | 6414 | 174 | 2.712816% |
| C | 6414 | 136 | 2.120362% |
| D | 6414 | 355 | 5.534768% |
Noise dominated data is calculated using 1-second bins in cleaned event files. If a bin has >2000 counts, and if more than 50% of those come from <1% of pixels, then it is considered to be noise-dominated and hence unusable.
| Quadrant | # 1 sec bins | Bins with >0 counts | Bins with >2000 counts | High rate bins dominated by noise | Noise dominated (total time) | Noise dominated (detector-on time) | Marked lightcurve |
|---|---|---|---|---|---|---|---|
| A | 7714 | 6414 | 9 | 9 | 0.12% | 0.14% | 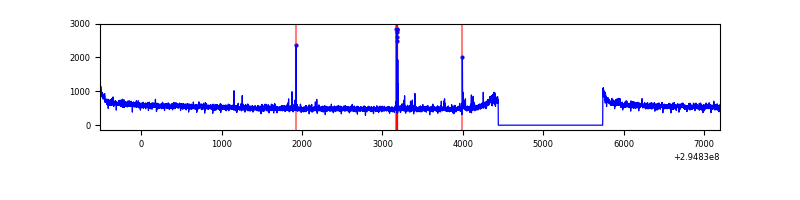 |
| B | 7714 | 6414 | 54 | 54 | 0.70% | 0.84% | 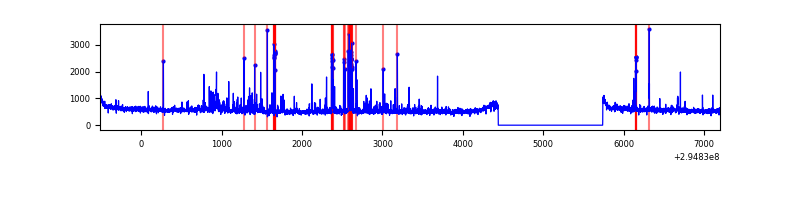 |
| C | 7714 | 6414 | 0 | 0 | 0.00% | 0.00% | 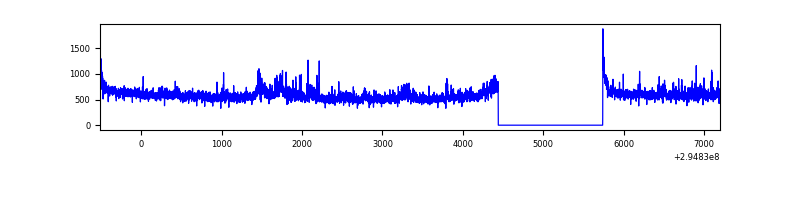 |
| D | 7714 | 6414 | 244 | 244 | 3.16% | 3.80% | 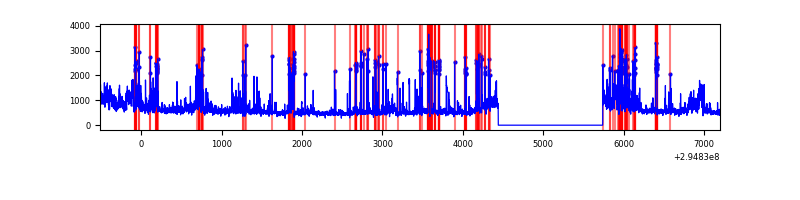 |
Top three noisy pixels from each quadrant. If the there are fewer than three noisy pixels in the level2.evt file, extra rows are filled as -1
| Pixel properties | Quadrant properties | ||||||
|---|---|---|---|---|---|---|---|
| Quadrant | DetID | PixID | Counts | Sigma | Mean | Median | Sigma |
| A | 5 | 16 | 40597 | 224.25 | 894 | 878 | 177.1 |
| A | 11 | 29 | 12229 | 64.09 | 894 | 878 | 177.1 |
| A | 0 | 226 | 7994 | 40.18 | 894 | 878 | 177.1 |
| B | 3 | 112 | 184616 | 1122.62 | 876 | 857 | 163.7 |
| B | 7 | 220 | 115612 | 701.06 | 876 | 857 | 163.7 |
| B | 0 | 190 | 21122 | 123.8 | 876 | 857 | 163.7 |
| C | 3 | 233 | 243331 | 1253.38 | 842 | 852 | 193.5 |
| C | 14 | 238 | 135046 | 693.65 | 842 | 852 | 193.5 |
| C | 9 | 221 | 115410 | 592.15 | 842 | 852 | 193.5 |
| D | 7 | 238 | 520921 | 2518.77 | 854 | 832 | 206.5 |
| D | 5 | 222 | 445259 | 2152.34 | 854 | 832 | 206.5 |
| D | 1 | 52 | 289693 | 1398.94 | 854 | 832 | 206.5 |
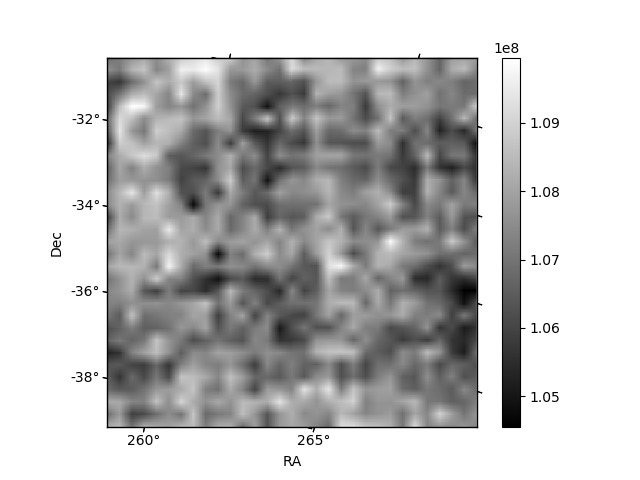
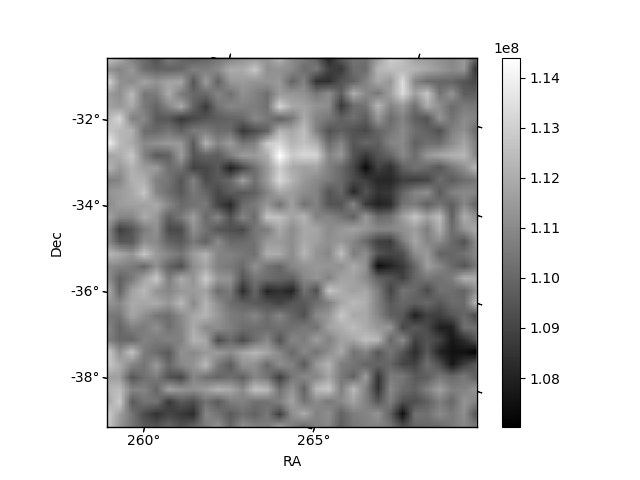
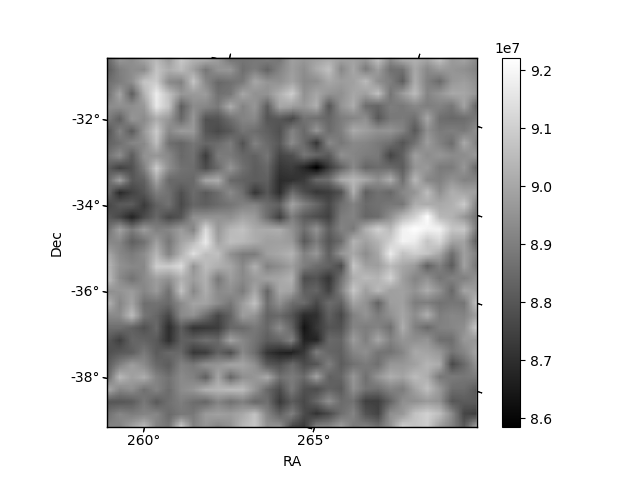
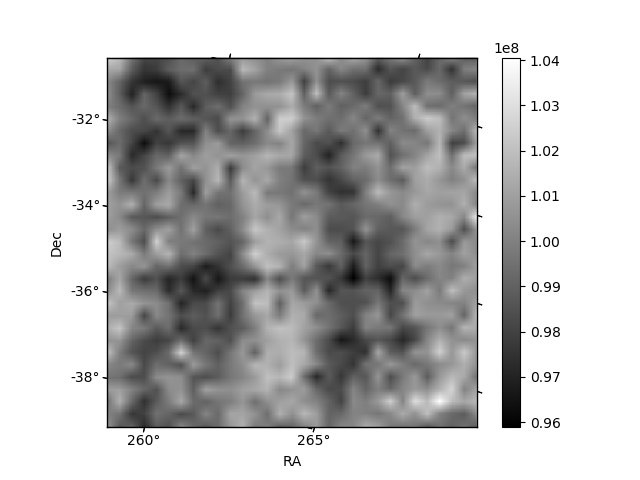
Histogram calculated using DETX and DETY for each event in the final _common_clean file
| Quadrant A | 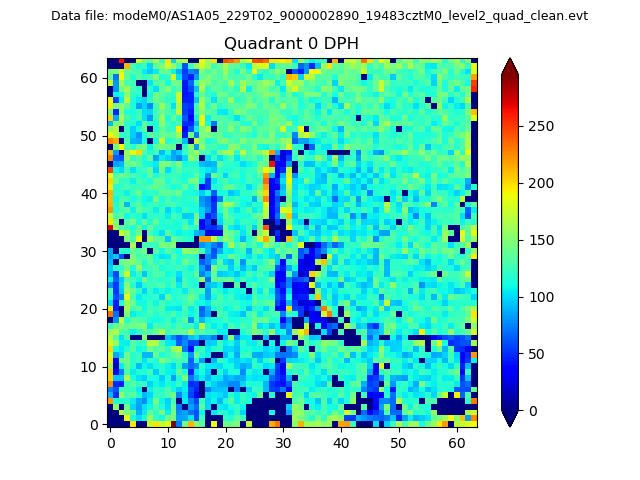 |
 |
Quadrant B |
|---|---|---|---|
| Quadrant D |  |
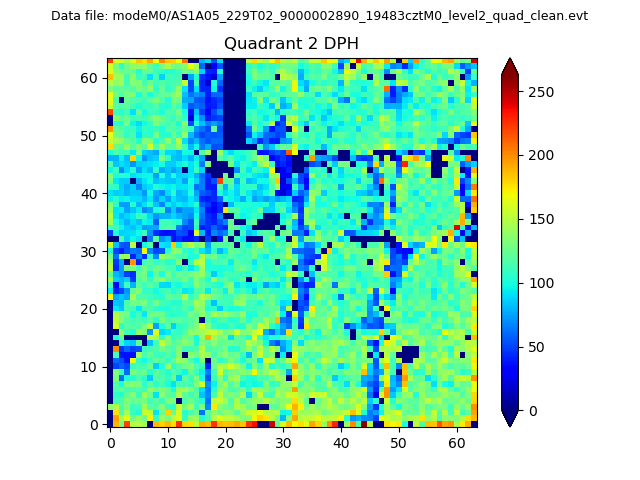 |
Quadrant C |
| Plot type | Count rate plots | Images |
|---|---|---|
| Comparison with Poisson distribution Blue bars denote a histogram of data divided into 1 sec bins. Red curve is a Poisson curve with rate = median count rate of data. |
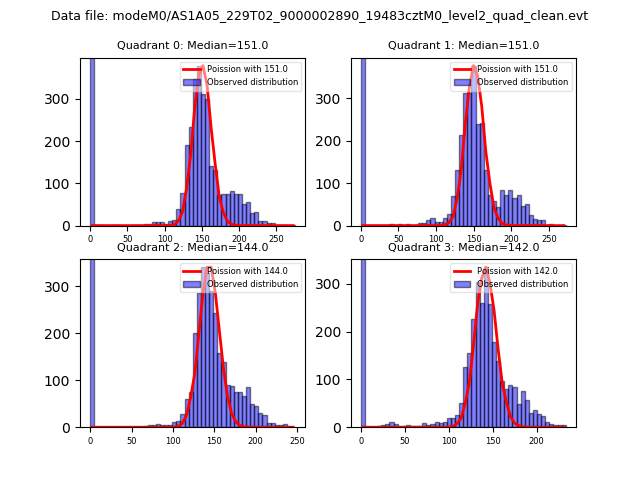 |
 |
| Quadrant-wise count rates Data is divided into 100 sec bins |
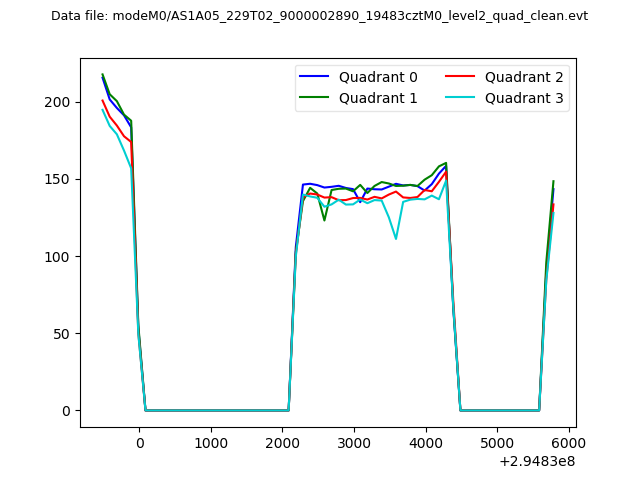 |
|
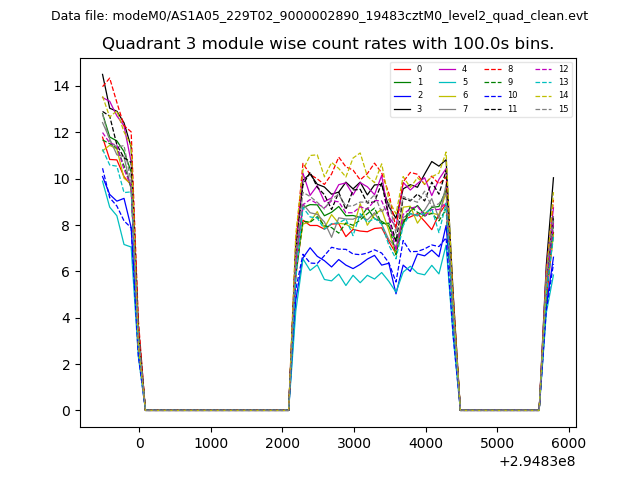
| Module-wise count rates for Quadrant A Data is divided into 100 sec bins |
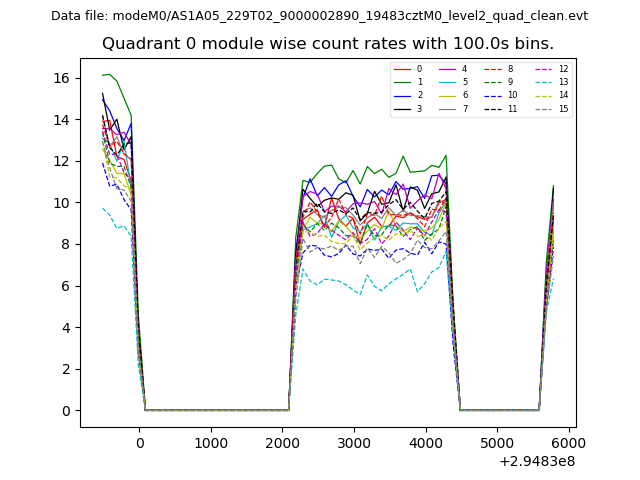 |
 |
| Module-wise count rates for Quadrant B Data is divided into 100 sec bins |
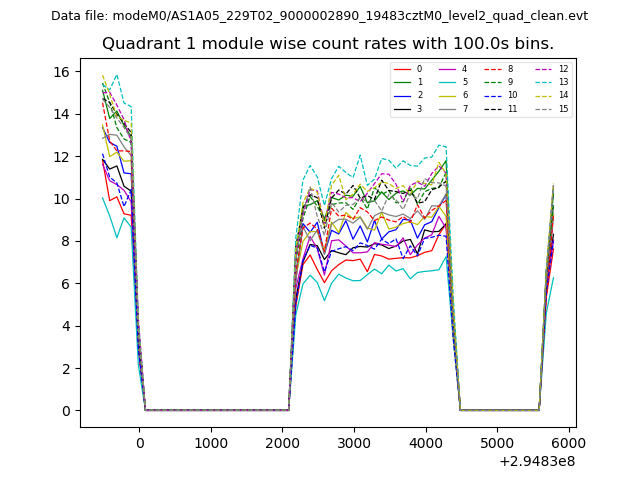 |
 |
| Module-wise count rates for Quadrant C Data is divided into 100 sec bins |
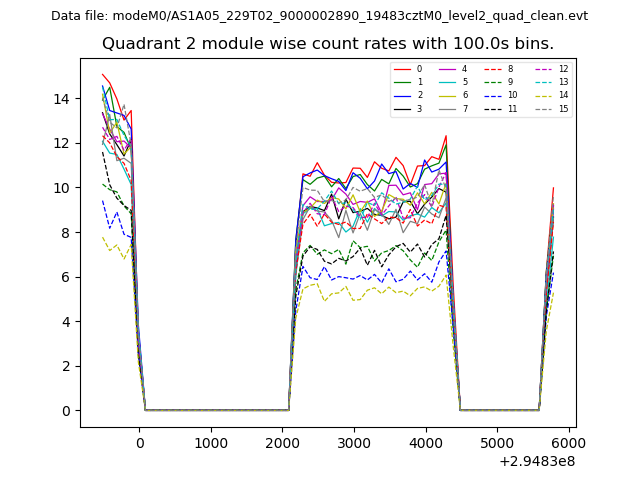 |
 |
| Module-wise count rates for Quadrant D Data is divided into 100 sec bins |
 |
 |
| Parameter | Plot |
|---|---|
| CZT HV Monitor | 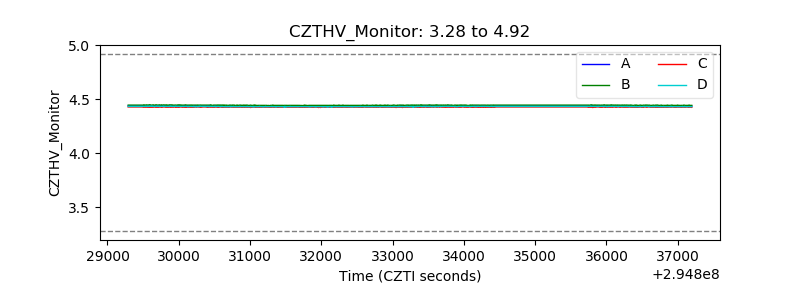 |
| D_VDD | 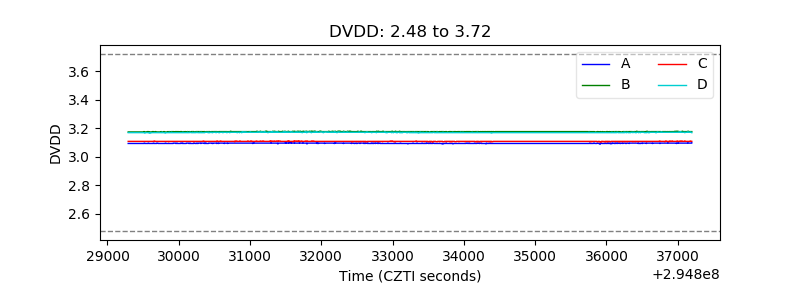 |
| Temperature 1 | 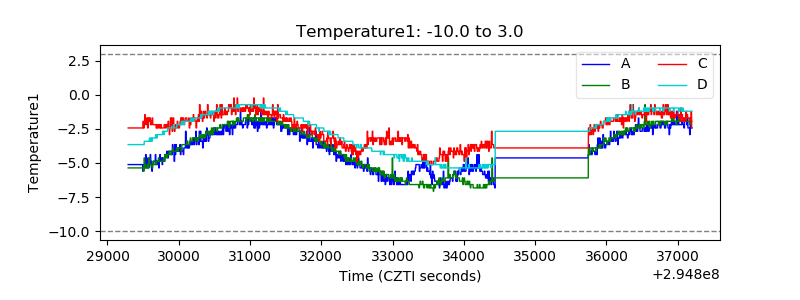 |
| Veto HV Monitor | 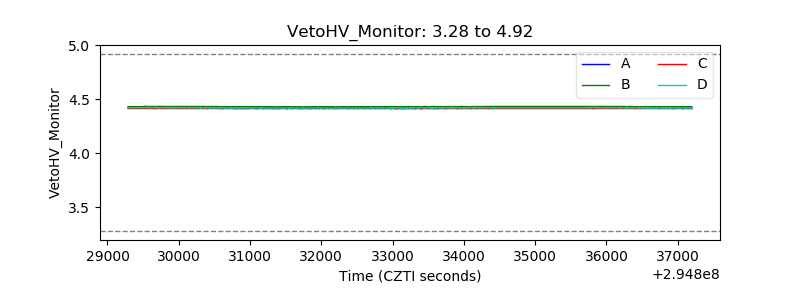 |
| Veto LLD | 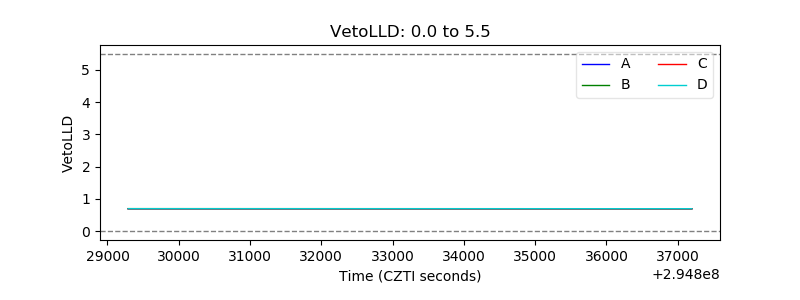 |
| Alpha Counter | 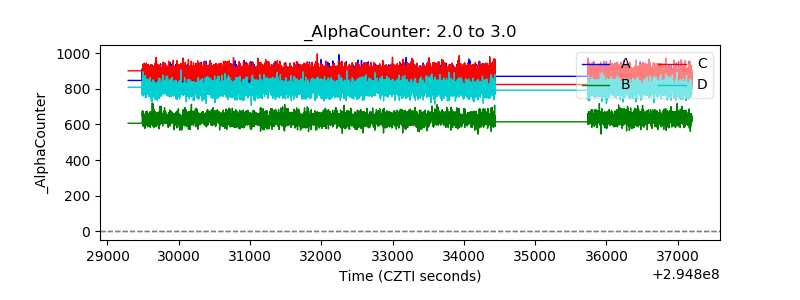 |
| _CPM_Rate | 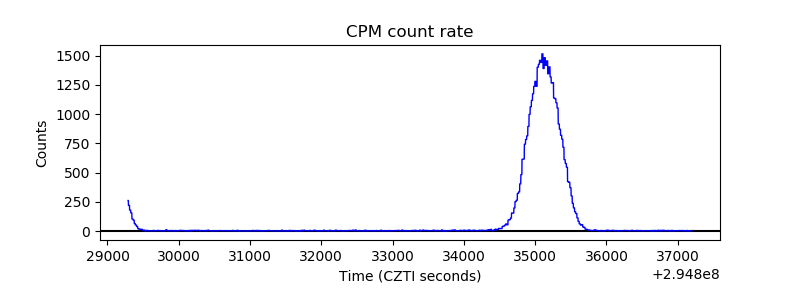 |
| CZT Counter |  |
| +2.5 Volts monitor |  |
| +5 Volts monitor |  |
| _ROLL_ROT | 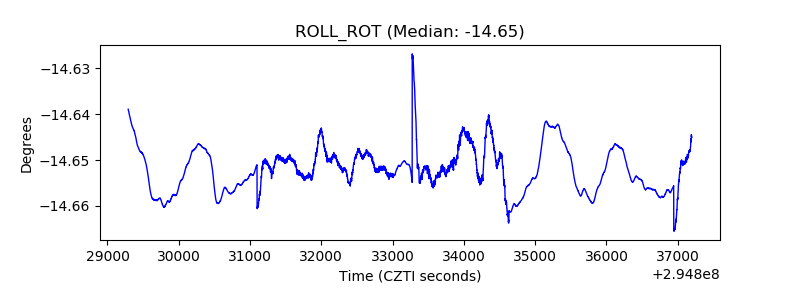 |
| _Roll_DEC | 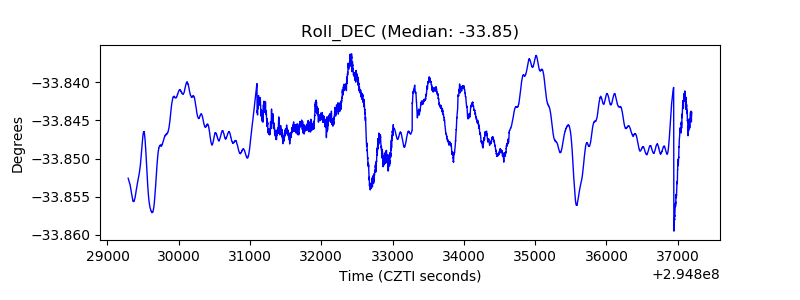 |
| _Roll_RA | 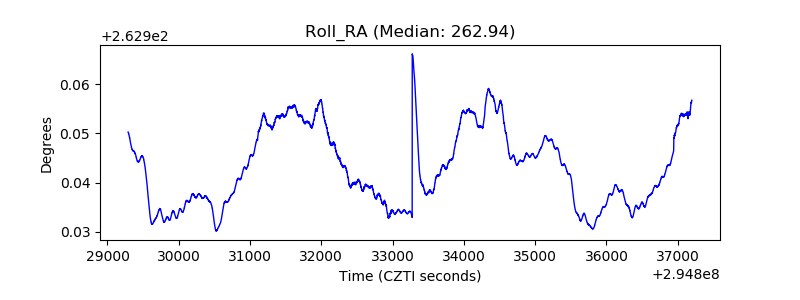 |
| Veto Counter | 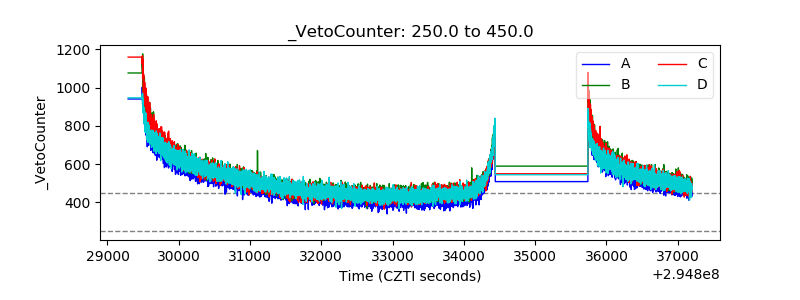 |