| Param | Original file | Final file |
|---|---|---|
| Filename | modeM0/AS1A05_229T02_9000002890_19484cztM0_level2.evt | modeM0/AS1A05_229T02_9000002890_19484cztM0_level2_quad_clean.evt |
| Size (bytes) | 581,112,000 | 68,071,680 |
| Size | 554.2 MB | 64.9 MB |
| Events in quadrant A | 3,475,166 | 414,280 |
| Events in quadrant B | 3,725,352 | 415,254 |
| Events in quadrant C | 3,800,833 | 396,758 |
| Events in quadrant D | 6,150,498 | 374,489 |
| Mode M0 | |||
|---|---|---|---|
| Quadrant | BADHDUFLAG | Total packets | Discarded packets |
| A | 0 | 14192 | 2 |
| B | 0 | 15033 | 2 |
| C | 0 | 15362 | 2 |
| D | 0 | 22706 | 2 |
| Mode SS | |||
|---|---|---|---|
| Quadrant | BADHDUFLAG | Total packets | Discarded packets |
| A | 0 | 136 | 0 |
| B | 0 | 136 | 0 |
| C | 0 | 136 | 0 |
| D | 0 | 136 | 0 |
| Mode M9 | |||
|---|---|---|---|
| Quadrant | BADHDUFLAG | Total packets | Discarded packets |
| A | 0 | 12 | 0 |
| B | 0 | 13 | 0 |
| C | 0 | 13 | 0 |
| D | 0 | 13 | 0 |
| Quadrant | Total seconds | Saturated seconds | Saturation percentage |
|---|---|---|---|
| A | 6589 | 124 | 1.881924% |
| B | 6589 | 157 | 2.382759% |
| C | 6589 | 151 | 2.291698% |
| D | 6589 | 969 | 14.706329% |
Noise dominated data is calculated using 1-second bins in cleaned event files. If a bin has >2000 counts, and if more than 50% of those come from <1% of pixels, then it is considered to be noise-dominated and hence unusable.
| Quadrant | # 1 sec bins | Bins with >0 counts | Bins with >2000 counts | High rate bins dominated by noise | Noise dominated (total time) | Noise dominated (detector-on time) | Marked lightcurve |
|---|---|---|---|---|---|---|---|
| A | 7779 | 6589 | 2 | 2 | 0.03% | 0.03% | 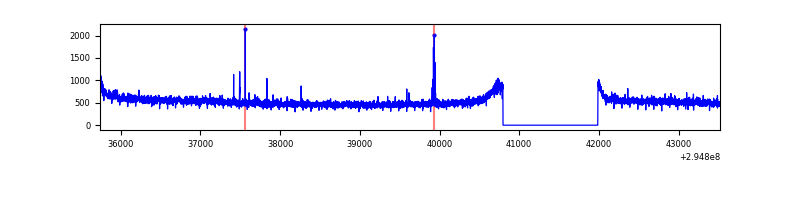 |
| B | 7779 | 6589 | 23 | 23 | 0.30% | 0.35% | 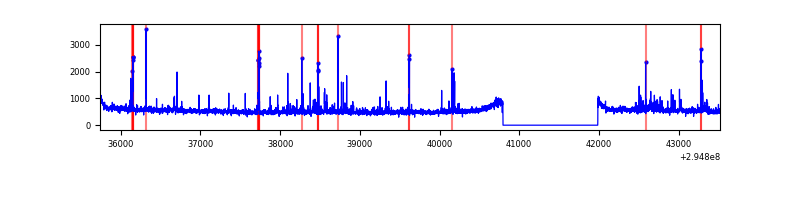 |
| C | 7779 | 6589 | 0 | 0 | 0.00% | 0.00% | 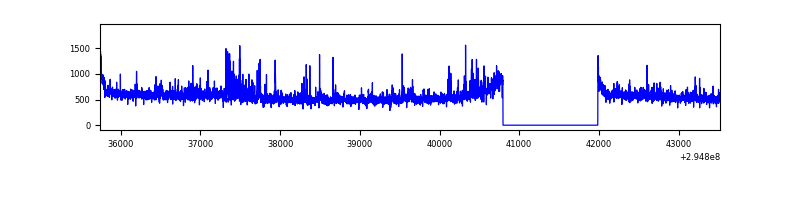 |
| D | 7779 | 6589 | 758 | 758 | 9.74% | 11.50% | 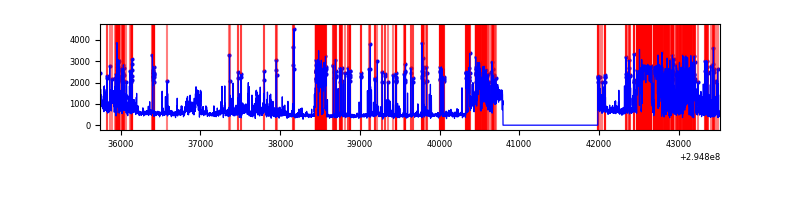 |
Top three noisy pixels from each quadrant. If the there are fewer than three noisy pixels in the level2.evt file, extra rows are filled as -1
| Pixel properties | Quadrant properties | ||||||
|---|---|---|---|---|---|---|---|
| Quadrant | DetID | PixID | Counts | Sigma | Mean | Median | Sigma |
| A | 5 | 16 | 21870 | 118.19 | 890 | 871 | 177.7 |
| A | 11 | 29 | 21565 | 116.48 | 890 | 871 | 177.7 |
| A | 0 | 226 | 7890 | 39.51 | 890 | 871 | 177.7 |
| B | 3 | 112 | 177469 | 1073.21 | 876 | 857 | 164.6 |
| B | 12 | 111 | 19140 | 111.1 | 876 | 857 | 164.6 |
| B | 0 | 197 | 17980 | 104.05 | 876 | 857 | 164.6 |
| C | 3 | 233 | 224801 | 1155.93 | 840 | 847 | 193.7 |
| C | 9 | 221 | 168379 | 864.71 | 840 | 847 | 193.7 |
| C | 14 | 238 | 133361 | 683.96 | 840 | 847 | 193.7 |
| D | 7 | 238 | 1001673 | 5095.71 | 809 | 786 | 196.4 |
| D | 7 | 223 | 858829 | 4368.46 | 809 | 786 | 196.4 |
| D | 1 | 52 | 625926 | 3182.71 | 809 | 786 | 196.4 |
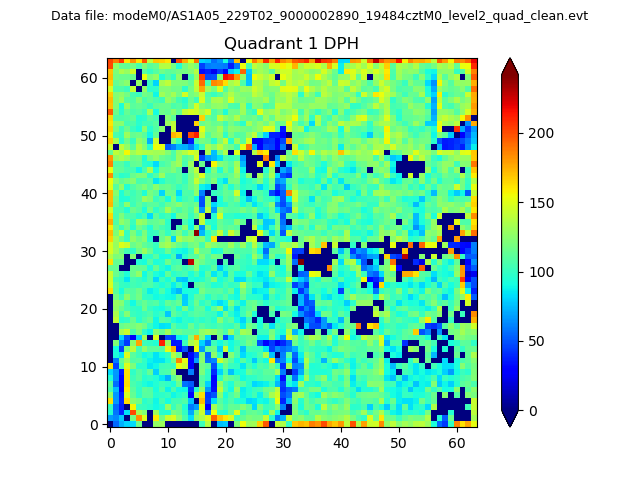
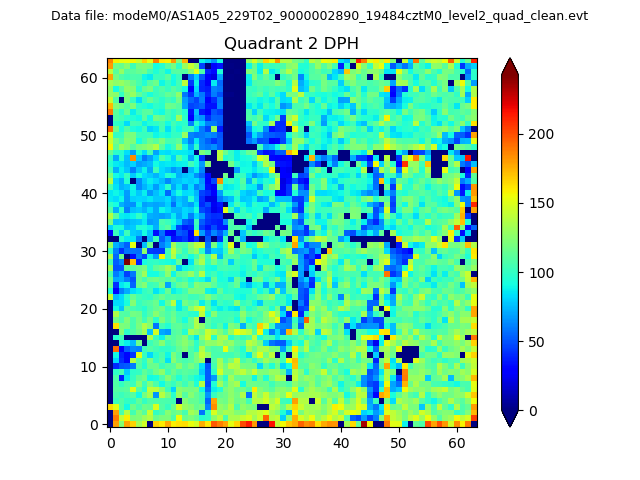
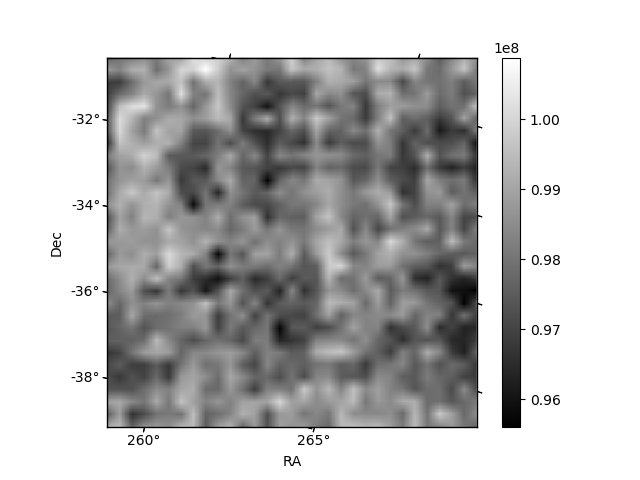
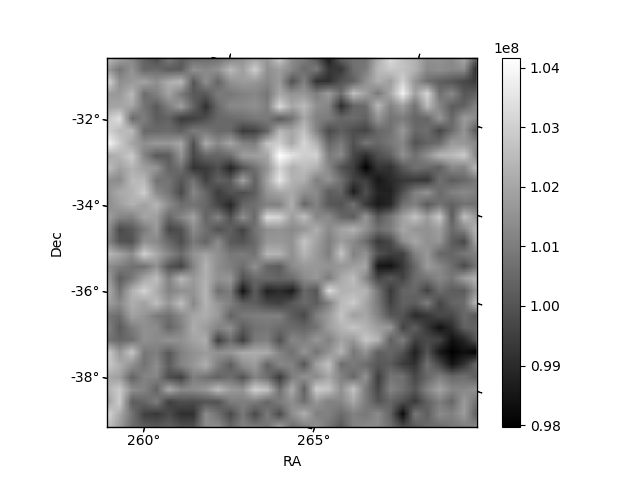
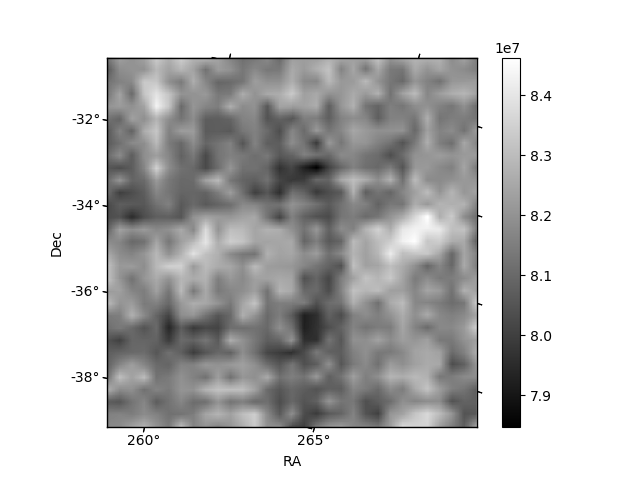
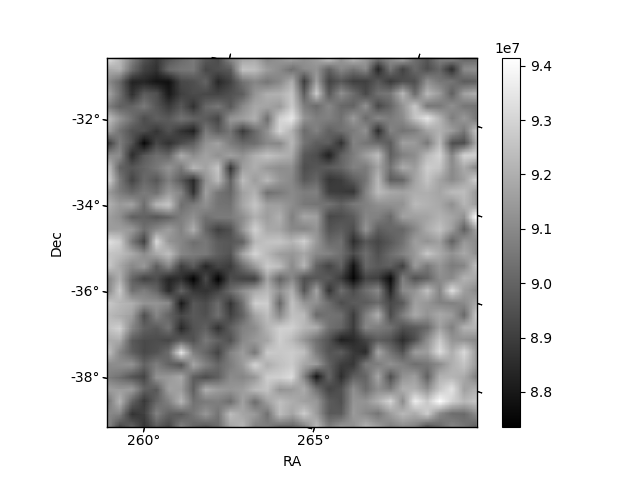
Histogram calculated using DETX and DETY for each event in the final _common_clean file
| Quadrant A |  |
 |
Quadrant B |
|---|---|---|---|
| Quadrant D |  |
 |
Quadrant C |
| Plot type | Count rate plots | Images |
|---|---|---|
| Comparison with Poisson distribution Blue bars denote a histogram of data divided into 1 sec bins. Red curve is a Poisson curve with rate = median count rate of data. |
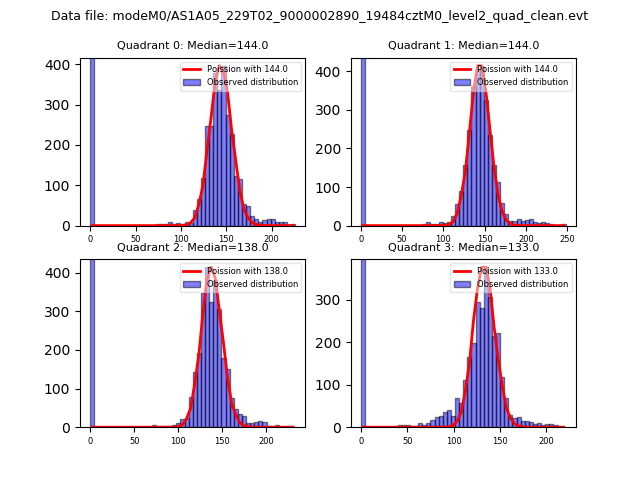 |
 |
| Quadrant-wise count rates Data is divided into 100 sec bins |
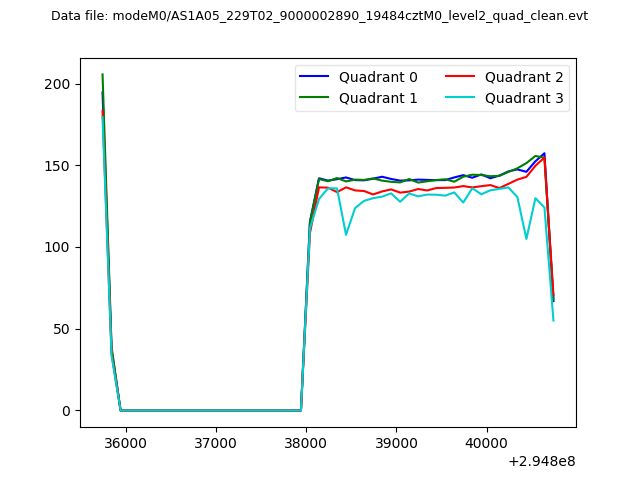 |
|
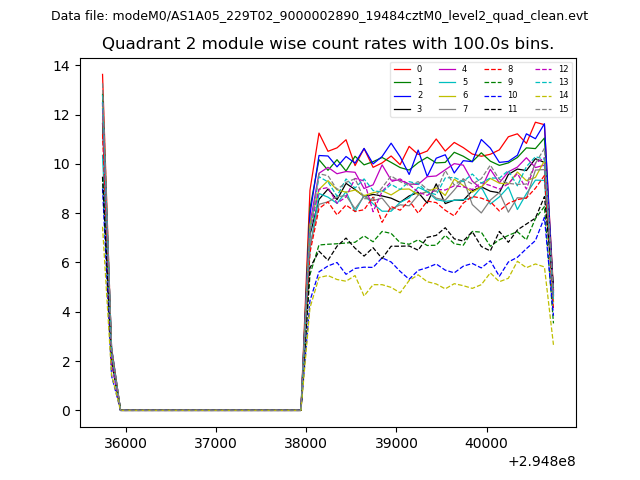
| Module-wise count rates for Quadrant A Data is divided into 100 sec bins |
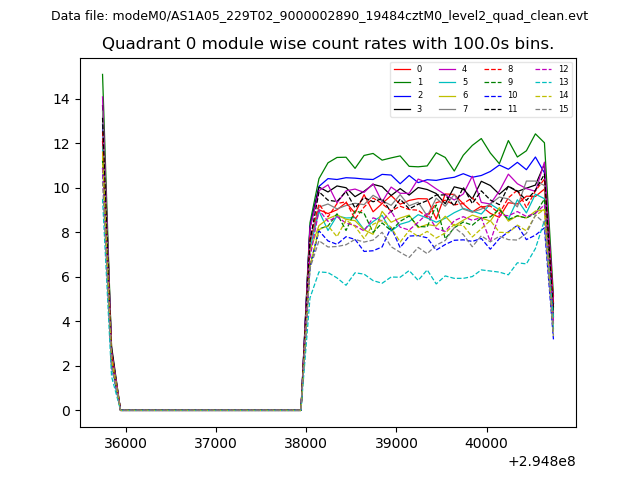 |
 |
| Module-wise count rates for Quadrant B Data is divided into 100 sec bins |
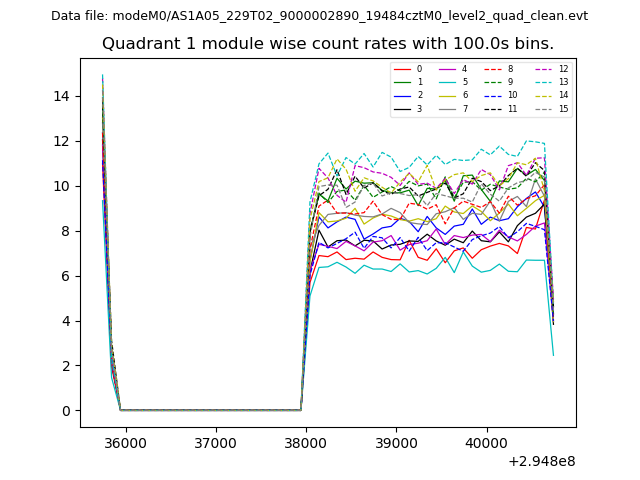 |
 |
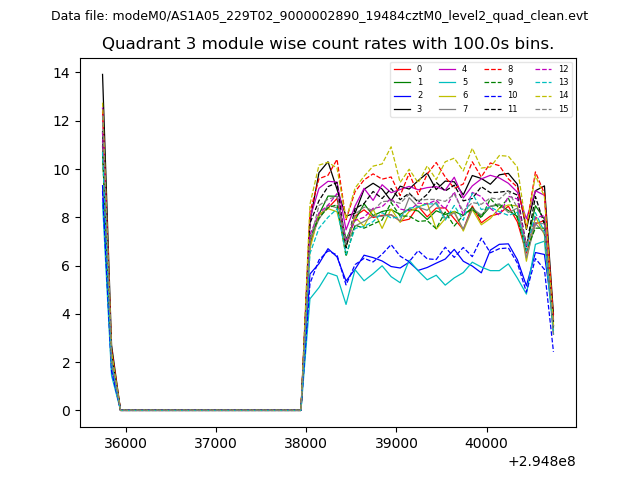
| Module-wise count rates for Quadrant C Data is divided into 100 sec bins |
 |
 |
| Module-wise count rates for Quadrant D Data is divided into 100 sec bins |
 |
 |
| Parameter | Plot |
|---|---|
| CZT HV Monitor | 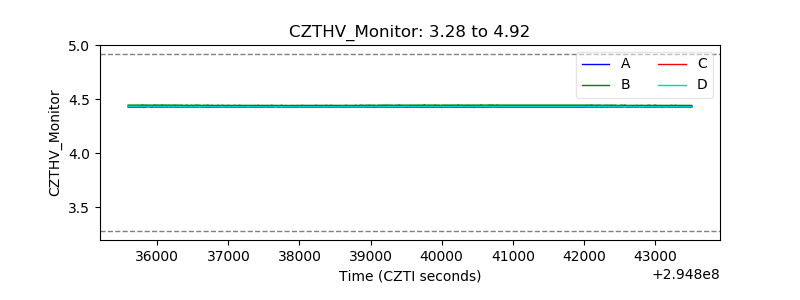 |
| D_VDD | 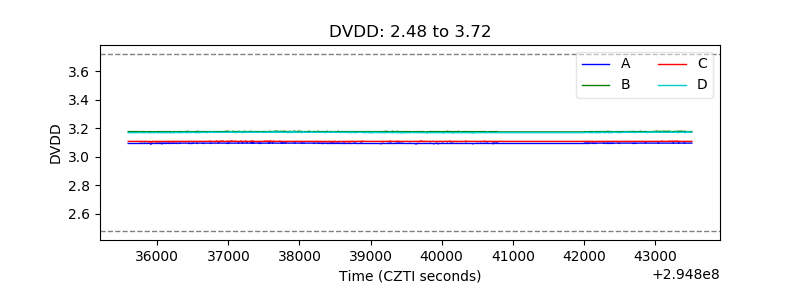 |
| Temperature 1 | 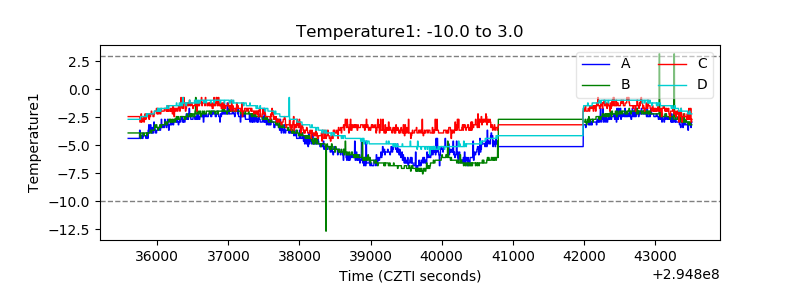 |
| Veto HV Monitor | 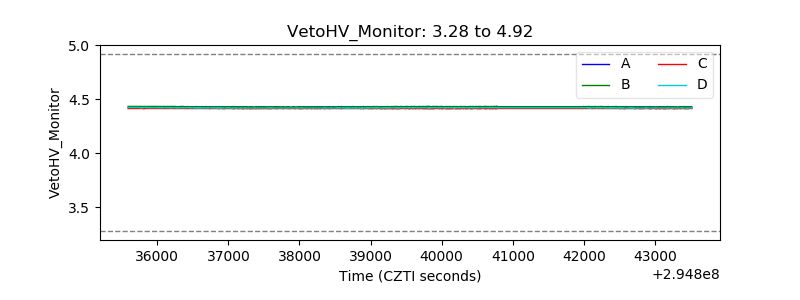 |
| Veto LLD | 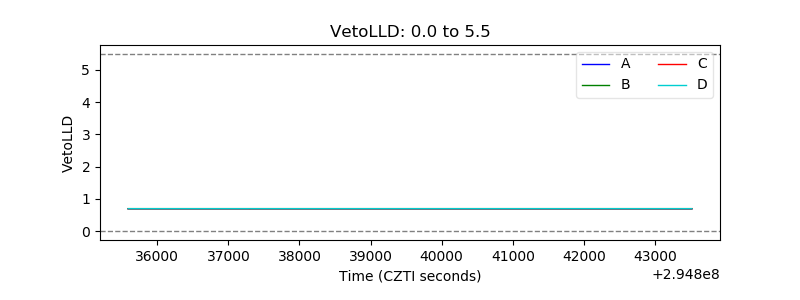 |
| Alpha Counter | 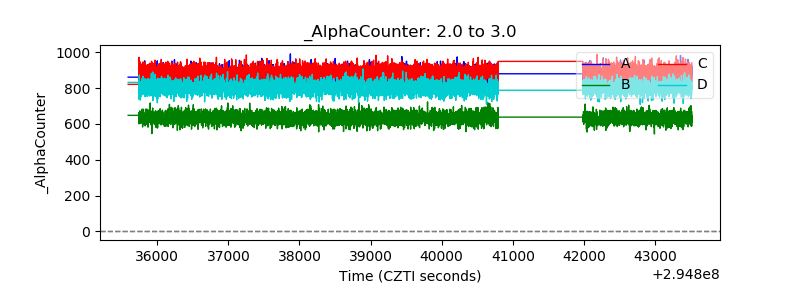 |
| _CPM_Rate | 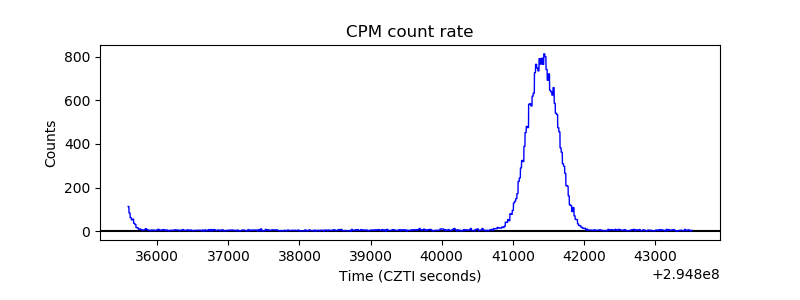 |
| CZT Counter | 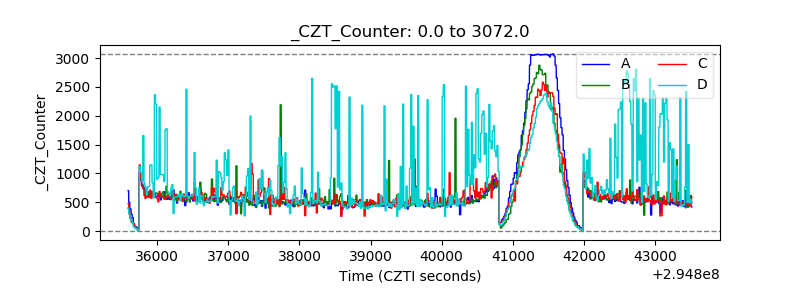 |
| +2.5 Volts monitor |  |
| +5 Volts monitor |  |
| _ROLL_ROT | 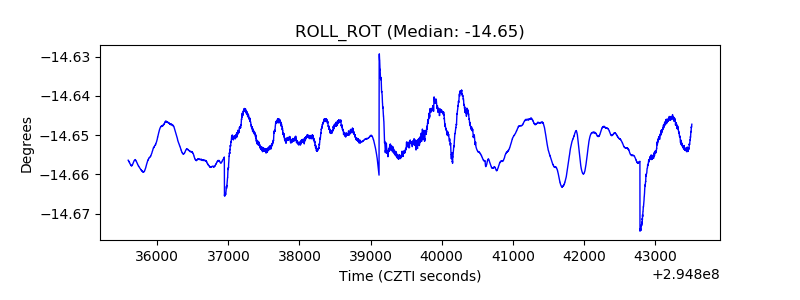 |
| _Roll_DEC | 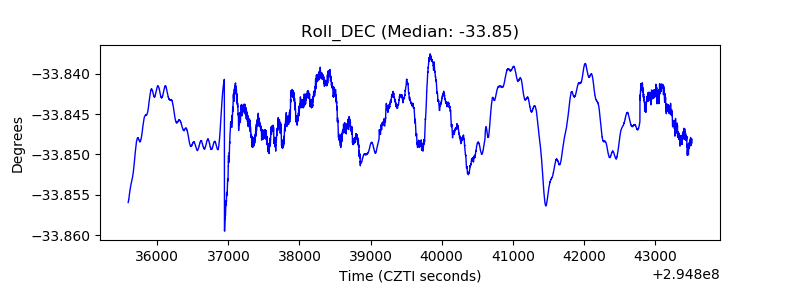 |
| _Roll_RA | 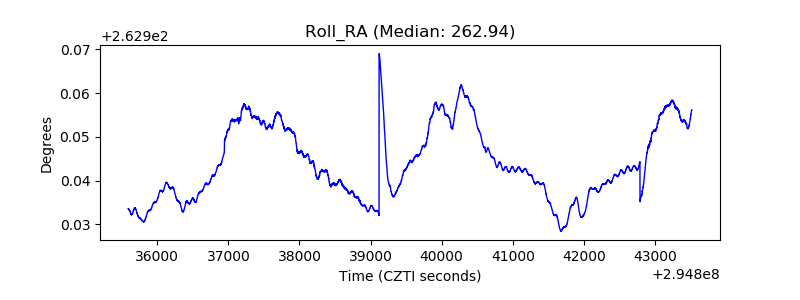 |
| Veto Counter | 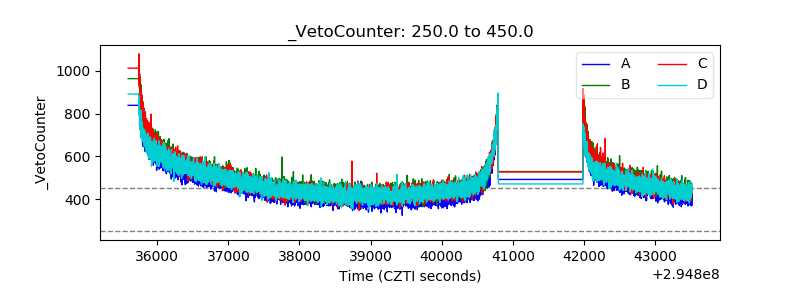 |