| Param | Original file | Final file |
|---|---|---|
| Filename | modeM0/AS1A05_229T02_9000002890_19485cztM0_level2.evt | modeM0/AS1A05_229T02_9000002890_19485cztM0_level2_quad_clean.evt |
| Size (bytes) | 569,033,280 | 75,265,920 |
| Size | 542.7 MB | 71.8 MB |
| Events in quadrant A | 3,355,455 | 463,318 |
| Events in quadrant B | 3,654,386 | 465,471 |
| Events in quadrant C | 3,684,509 | 447,897 |
| Events in quadrant D | 6,082,250 | 432,755 |
| Mode M0 | |||
|---|---|---|---|
| Quadrant | BADHDUFLAG | Total packets | Discarded packets |
| A | 0 | 14035 | 1 |
| B | 0 | 14966 | 1 |
| C | 0 | 15199 | 2 |
| D | 0 | 22650 | 1 |
| Mode SS | |||
|---|---|---|---|
| Quadrant | BADHDUFLAG | Total packets | Discarded packets |
| A | 0 | 138 | 0 |
| B | 0 | 138 | 0 |
| C | 0 | 138 | 0 |
| D | 0 | 138 | 0 |
| Mode M9 | |||
|---|---|---|---|
| Quadrant | BADHDUFLAG | Total packets | Discarded packets |
| A | 0 | 9 | 0 |
| B | 0 | 9 | 0 |
| C | 0 | 9 | 0 |
| D | 0 | 9 | 0 |
| Quadrant | Total seconds | Saturated seconds | Saturation percentage |
|---|---|---|---|
| A | 6731 | 84 | 1.247957% |
| B | 6731 | 133 | 1.975932% |
| C | 6731 | 128 | 1.901649% |
| D | 6731 | 769 | 11.424751% |
Noise dominated data is calculated using 1-second bins in cleaned event files. If a bin has >2000 counts, and if more than 50% of those come from <1% of pixels, then it is considered to be noise-dominated and hence unusable.
| Quadrant | # 1 sec bins | Bins with >0 counts | Bins with >2000 counts | High rate bins dominated by noise | Noise dominated (total time) | Noise dominated (detector-on time) | Marked lightcurve |
|---|---|---|---|---|---|---|---|
| A | 7656 | 6731 | 0 | 0 | 0.00% | 0.00% | 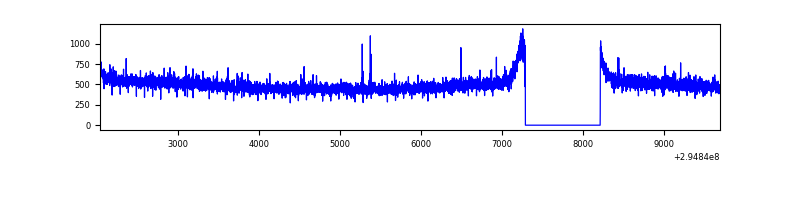 |
| B | 7655 | 6730 | 23 | 23 | 0.30% | 0.34% | 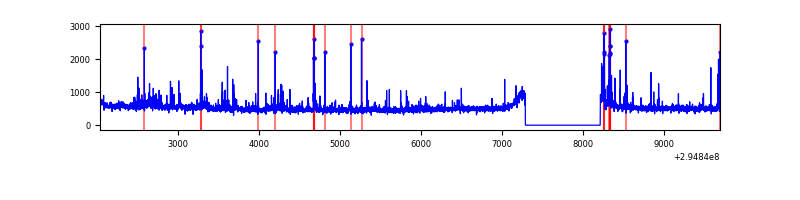 |
| C | 7656 | 6732 | 3 | 3 | 0.04% | 0.04% | 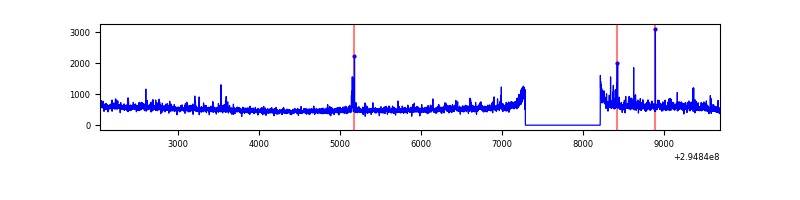 |
| D | 7656 | 6732 | 637 | 637 | 8.32% | 9.46% | 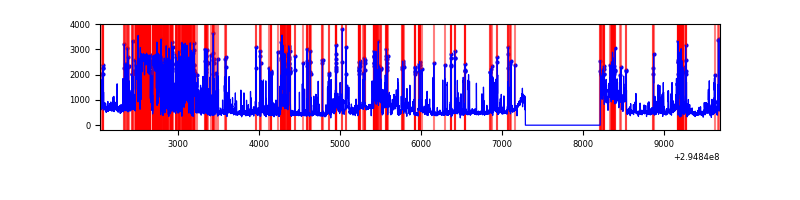 |
Top three noisy pixels from each quadrant. If the there are fewer than three noisy pixels in the level2.evt file, extra rows are filled as -1
| Pixel properties | Quadrant properties | ||||||
|---|---|---|---|---|---|---|---|
| Quadrant | DetID | PixID | Counts | Sigma | Mean | Median | Sigma |
| A | 11 | 29 | 20279 | 111.37 | 863 | 845 | 174.5 |
| A | 5 | 16 | 8691 | 44.96 | 863 | 845 | 174.5 |
| A | 0 | 226 | 7390 | 37.51 | 863 | 845 | 174.5 |
| B | 3 | 112 | 186584 | 1144.99 | 852 | 834 | 162.2 |
| B | 7 | 220 | 36156 | 217.73 | 852 | 834 | 162.2 |
| B | 3 | 64 | 32549 | 195.5 | 852 | 834 | 162.2 |
| C | 9 | 221 | 215031 | 1118.5 | 820 | 826 | 191.5 |
| C | 3 | 233 | 140090 | 727.19 | 820 | 826 | 191.5 |
| C | 14 | 238 | 128758 | 668.02 | 820 | 826 | 191.5 |
| D | 1 | 52 | 1318161 | 6820.64 | 796 | 776 | 193.1 |
| D | 7 | 238 | 929378 | 4807.75 | 796 | 776 | 193.1 |
| D | 7 | 223 | 406171 | 2098.9 | 796 | 776 | 193.1 |
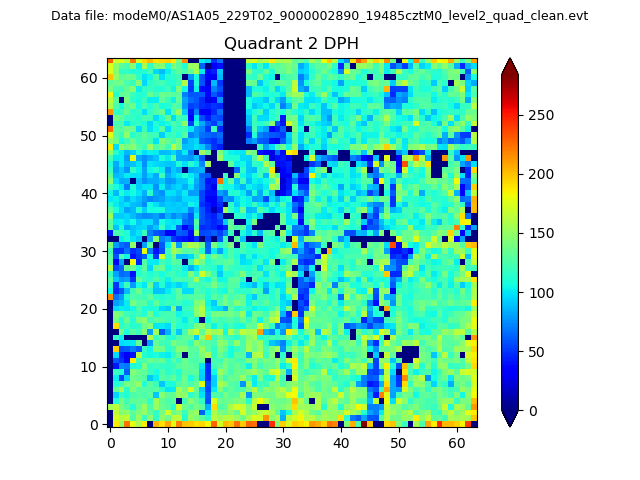
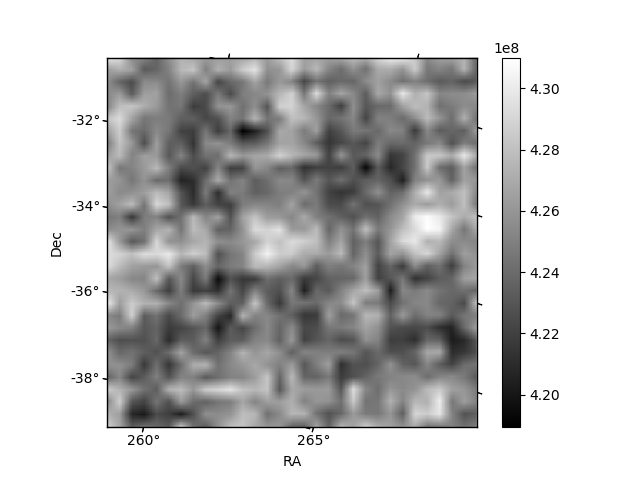
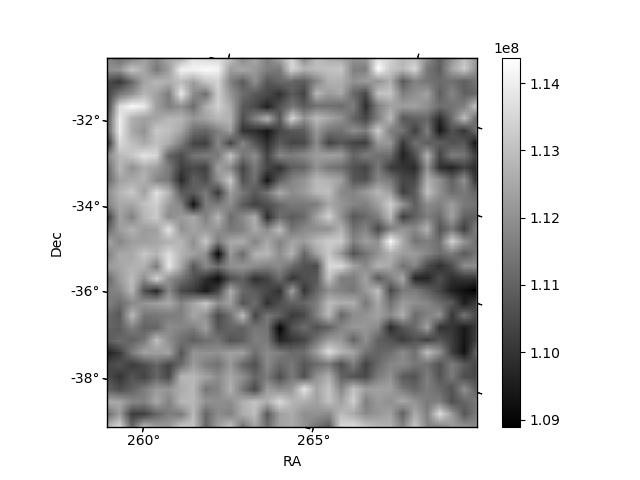
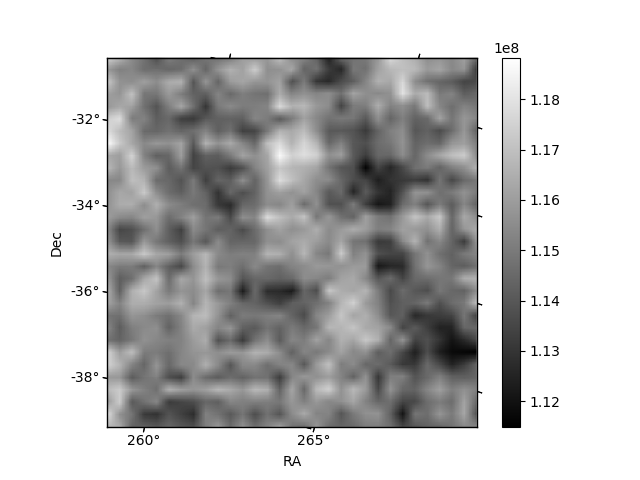
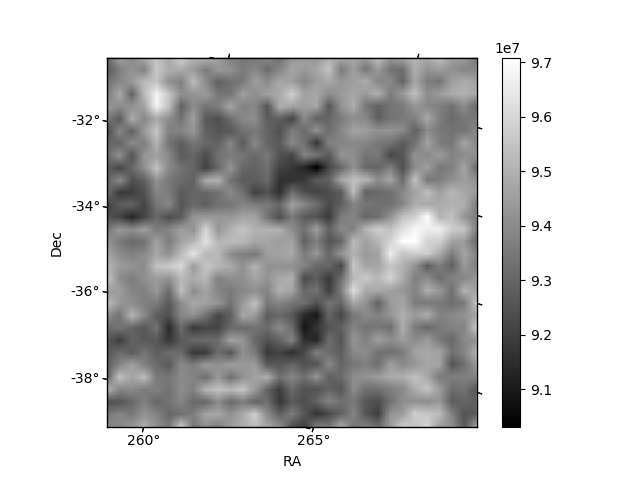
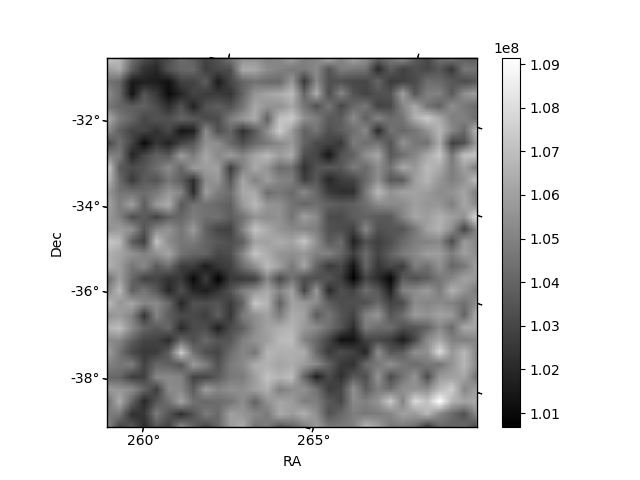
Histogram calculated using DETX and DETY for each event in the final _common_clean file
| Quadrant A | 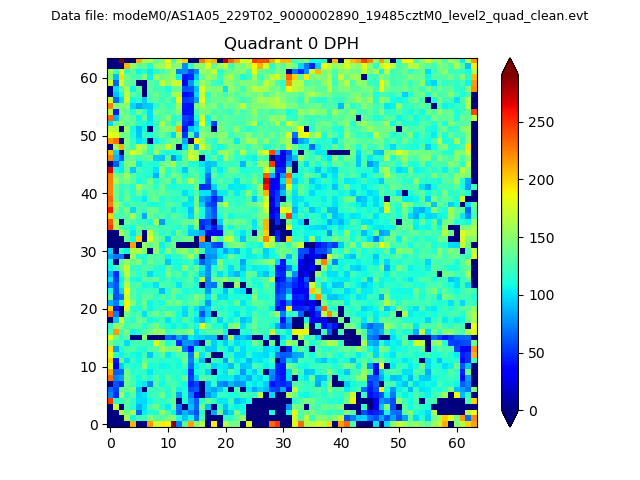 |
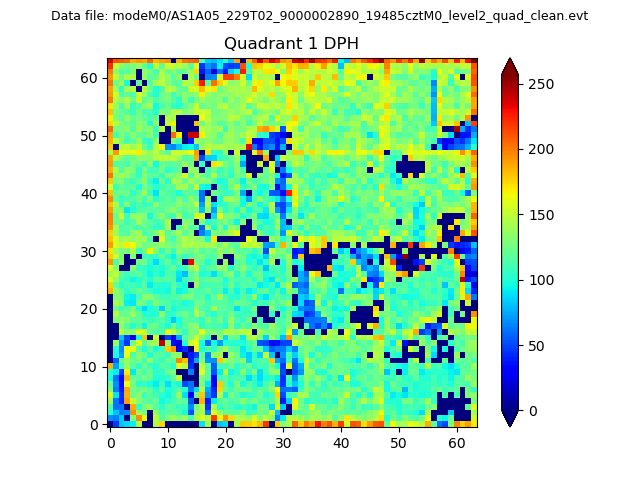 |
Quadrant B |
|---|---|---|---|
| Quadrant D | 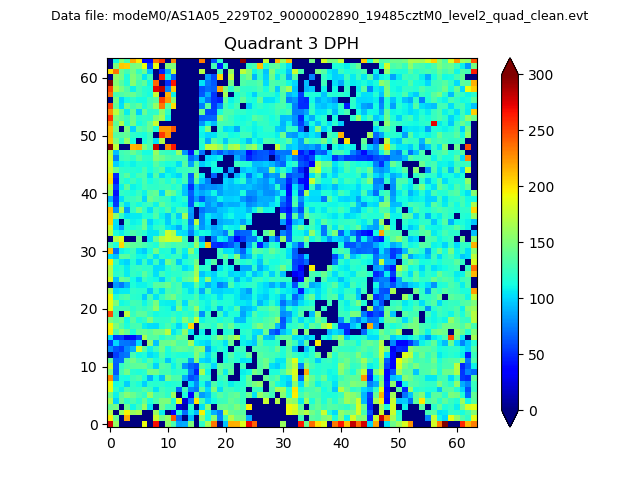 |
 |
Quadrant C |
| Plot type | Count rate plots | Images |
|---|---|---|
| Comparison with Poisson distribution Blue bars denote a histogram of data divided into 1 sec bins. Red curve is a Poisson curve with rate = median count rate of data. |
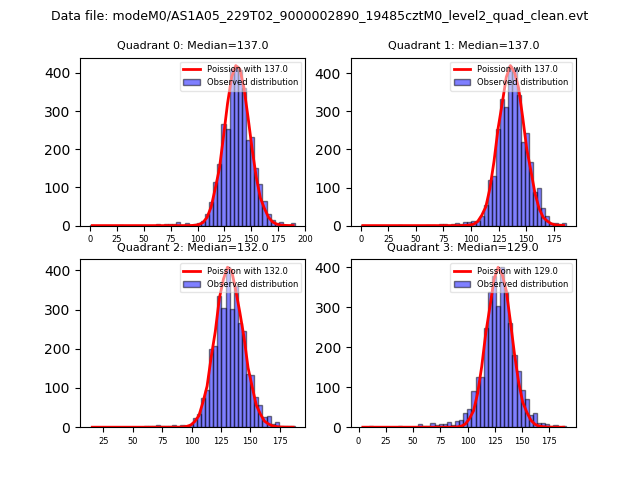 |
 |
| Quadrant-wise count rates Data is divided into 100 sec bins |
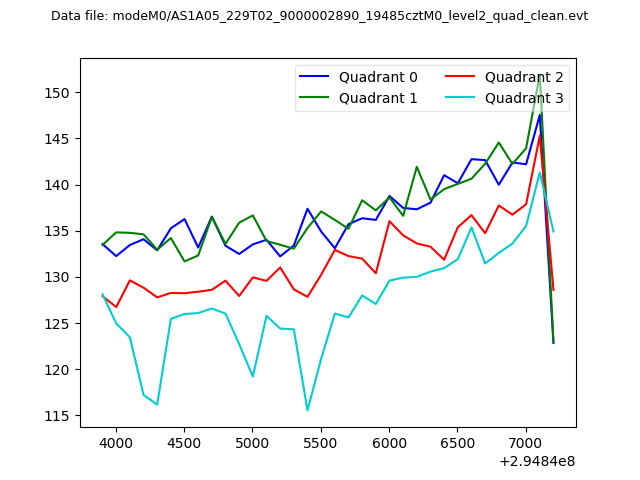 |
|
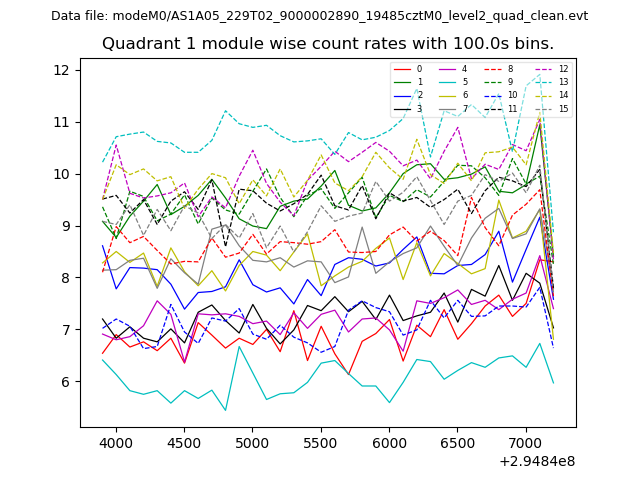
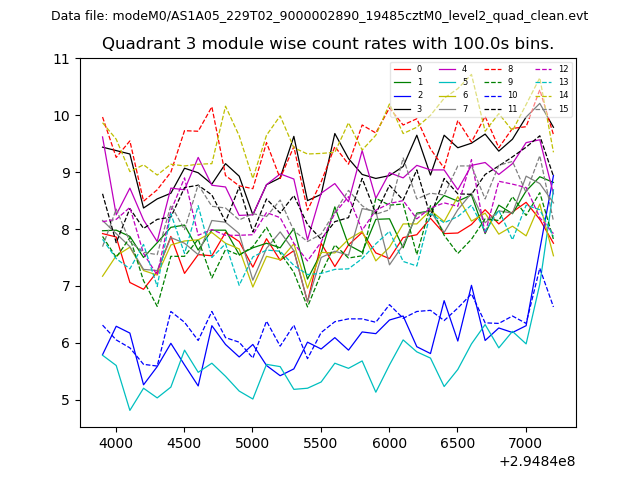
| Module-wise count rates for Quadrant A Data is divided into 100 sec bins |
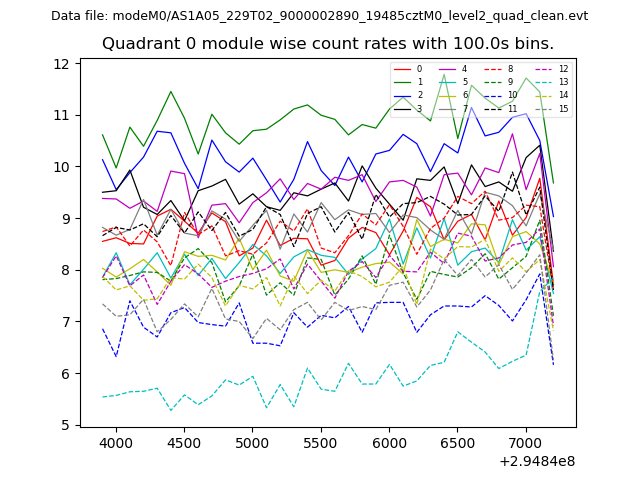 |
 |
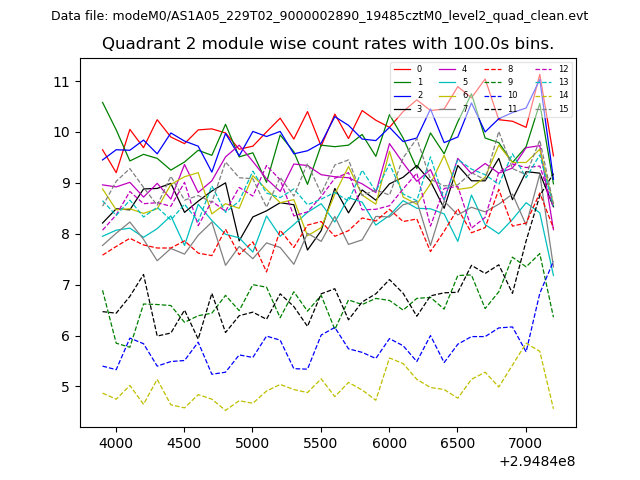
| Module-wise count rates for Quadrant B Data is divided into 100 sec bins |
 |
 |
| Module-wise count rates for Quadrant C Data is divided into 100 sec bins |
 |
 |
| Module-wise count rates for Quadrant D Data is divided into 100 sec bins |
 |
 |
| Parameter | Plot |
|---|---|
| CZT HV Monitor | 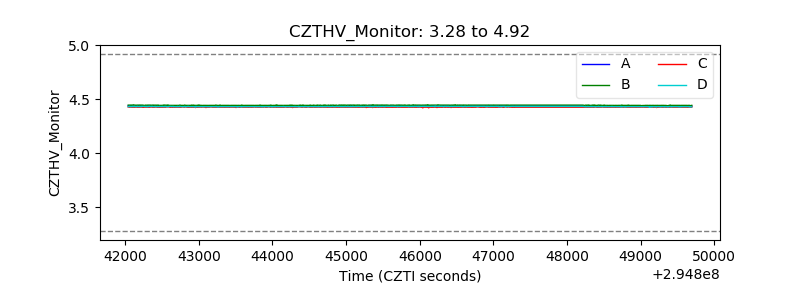 |
| D_VDD | 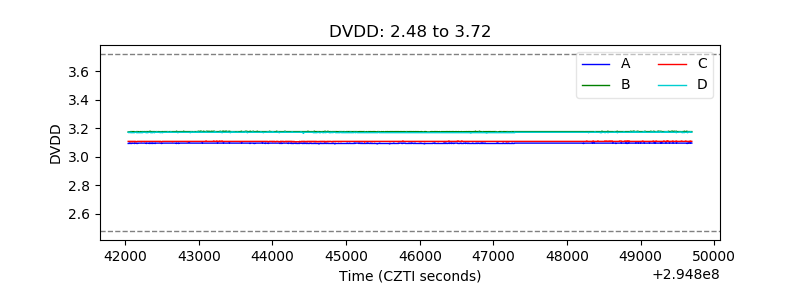 |
| Temperature 1 | 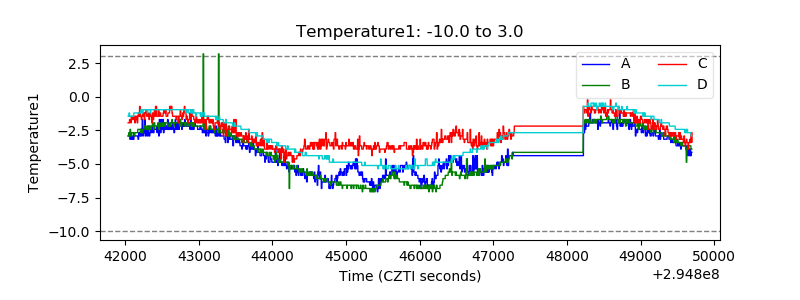 |
| Veto HV Monitor | 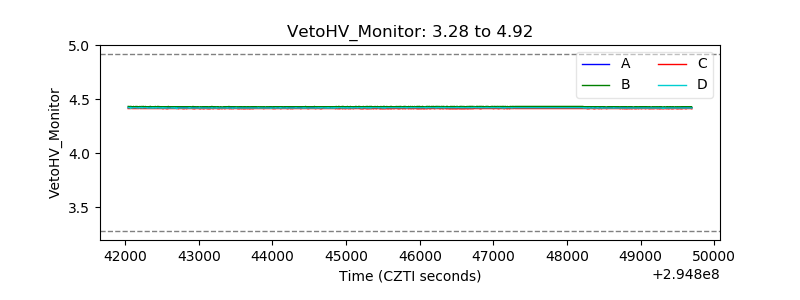 |
| Veto LLD | 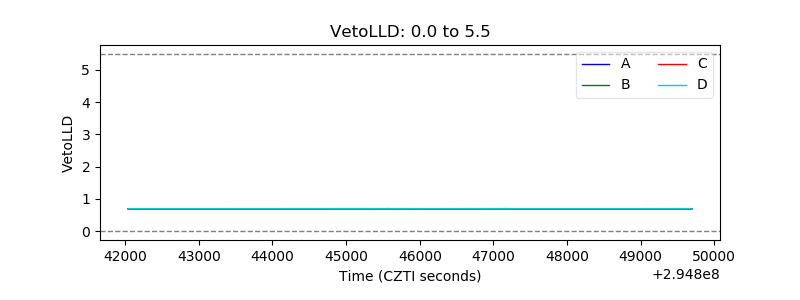 |
| Alpha Counter | 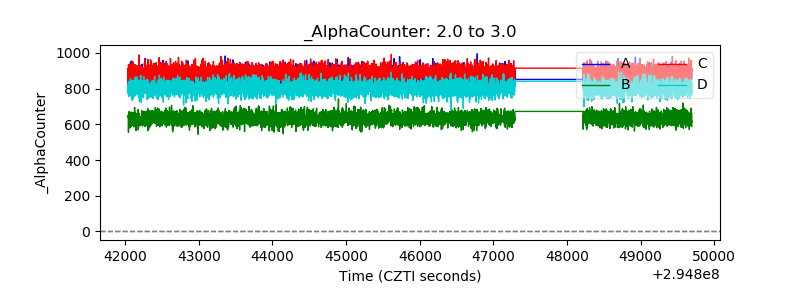 |
| _CPM_Rate | 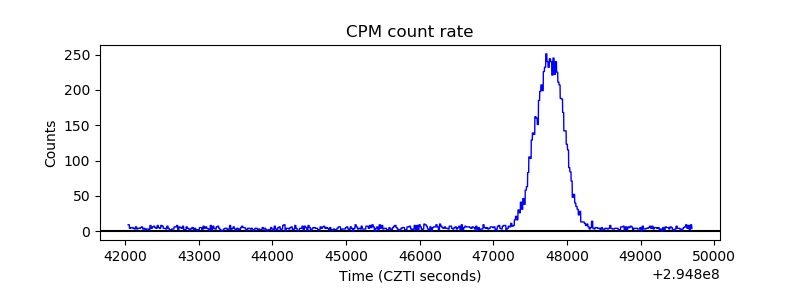 |
| CZT Counter | 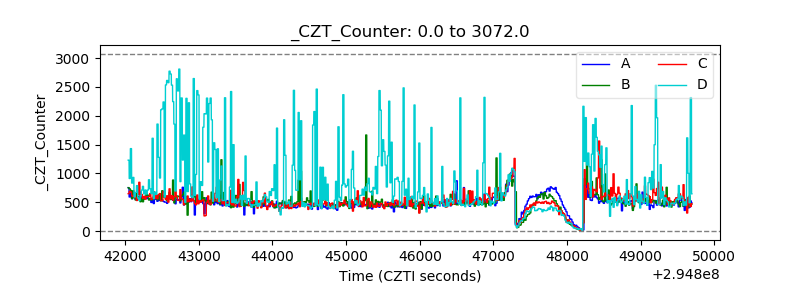 |
| +2.5 Volts monitor |  |
| +5 Volts monitor |  |
| _ROLL_ROT | 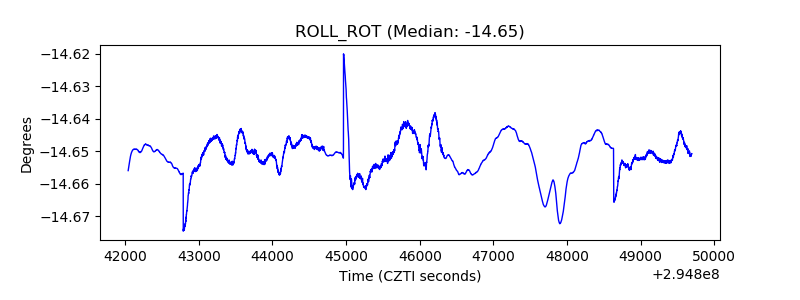 |
| _Roll_DEC | 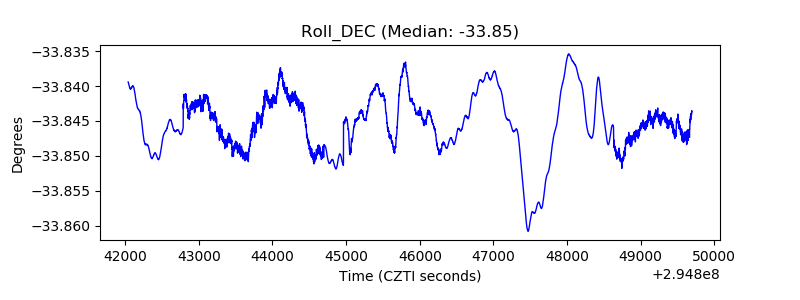 |
| _Roll_RA | 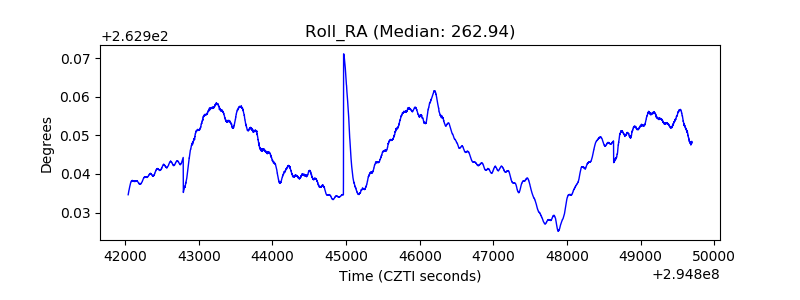 |
| Veto Counter | 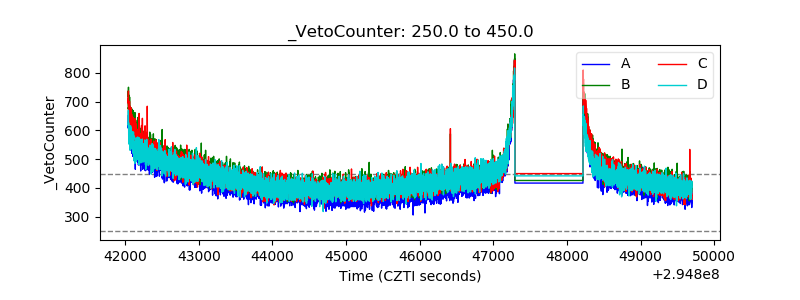 |