| Param | Original file | Final file |
|---|---|---|
| Filename | modeM0/AS1A05_229T02_9000002890_19488cztM0_level2.evt | modeM0/AS1A05_229T02_9000002890_19488cztM0_level2_quad_clean.evt |
| Size (bytes) | 672,768,000 | 92,053,440 |
| Size | 641.6 MB | 87.8 MB |
| Events in quadrant A | 3,268,534 | 600,754 |
| Events in quadrant B | 3,930,933 | 599,604 |
| Events in quadrant C | 3,772,589 | 585,987 |
| Events in quadrant D | 8,930,290 | 514,059 |
| Mode M0 | |||
|---|---|---|---|
| Quadrant | BADHDUFLAG | Total packets | Discarded packets |
| A | 0 | 14302 | 1 |
| B | 0 | 16196 | 1 |
| C | 0 | 15403 | 1 |
| D | 0 | 31515 | 1 |
| Mode SS | |||
|---|---|---|---|
| Quadrant | BADHDUFLAG | Total packets | Discarded packets |
| A | 0 | 142 | 0 |
| B | 0 | 142 | 0 |
| C | 0 | 142 | 0 |
| D | 0 | 142 | 0 |
| Mode M9 | |||
|---|---|---|---|
| Quadrant | BADHDUFLAG | Total packets | Discarded packets |
| A | 0 | 3 | 0 |
| B | 0 | 3 | 0 |
| C | 0 | 3 | 0 |
| D | 0 | 3 | 0 |
| Quadrant | Total seconds | Saturated seconds | Saturation percentage |
|---|---|---|---|
| A | 6988 | 35 | 0.500859% |
| B | 6988 | 196 | 2.804808% |
| C | 6988 | 85 | 1.216371% |
| D | 6988 | 1310 | 18.746422% |
Noise dominated data is calculated using 1-second bins in cleaned event files. If a bin has >2000 counts, and if more than 50% of those come from <1% of pixels, then it is considered to be noise-dominated and hence unusable.
| Quadrant | # 1 sec bins | Bins with >0 counts | Bins with >2000 counts | High rate bins dominated by noise | Noise dominated (total time) | Noise dominated (detector-on time) | Marked lightcurve |
|---|---|---|---|---|---|---|---|
| A | 7338 | 6989 | 0 | 0 | 0.00% | 0.00% | 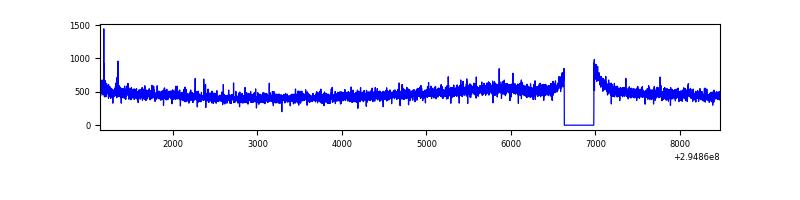 |
| B | 7338 | 6989 | 90 | 90 | 1.23% | 1.29% | 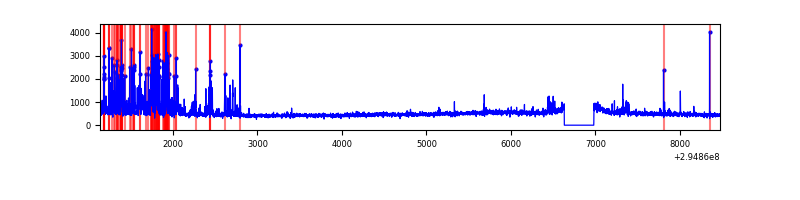 |
| C | 7338 | 6989 | 4 | 4 | 0.05% | 0.06% | 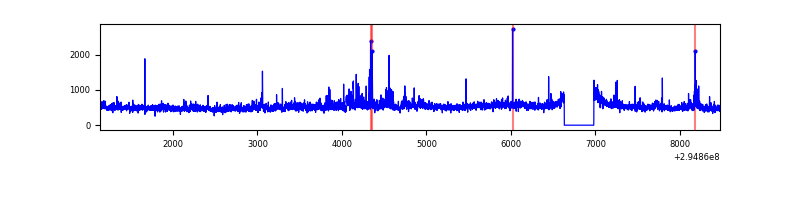 |
| D | 7338 | 6989 | 1237 | 1237 | 16.86% | 17.70% | 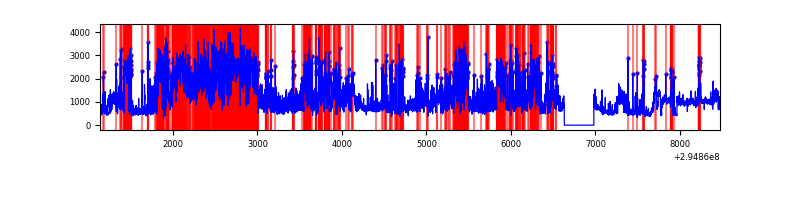 |
Top three noisy pixels from each quadrant. If the there are fewer than three noisy pixels in the level2.evt file, extra rows are filled as -1
| Pixel properties | Quadrant properties | ||||||
|---|---|---|---|---|---|---|---|
| Quadrant | DetID | PixID | Counts | Sigma | Mean | Median | Sigma |
| A | 11 | 29 | 19821 | 111.39 | 839 | 820 | 170.6 |
| A | 5 | 16 | 8573 | 45.45 | 839 | 820 | 170.6 |
| A | 0 | 226 | 7158 | 37.16 | 839 | 820 | 170.6 |
| B | 3 | 112 | 536636 | 3351.51 | 831 | 811 | 159.9 |
| B | 0 | 197 | 56629 | 349.13 | 831 | 811 | 159.9 |
| B | 12 | 111 | 19348 | 115.94 | 831 | 811 | 159.9 |
| C | 9 | 221 | 376741 | 1994.57 | 805 | 811 | 188.5 |
| C | 14 | 238 | 125836 | 663.34 | 805 | 811 | 188.5 |
| C | 3 | 233 | 119022 | 627.19 | 805 | 811 | 188.5 |
| D | 7 | 238 | 2049291 | 11038.84 | 761 | 741 | 185.6 |
| D | 5 | 222 | 2007073 | 10811.34 | 761 | 741 | 185.6 |
| D | 7 | 223 | 880683 | 4741.66 | 761 | 741 | 185.6 |
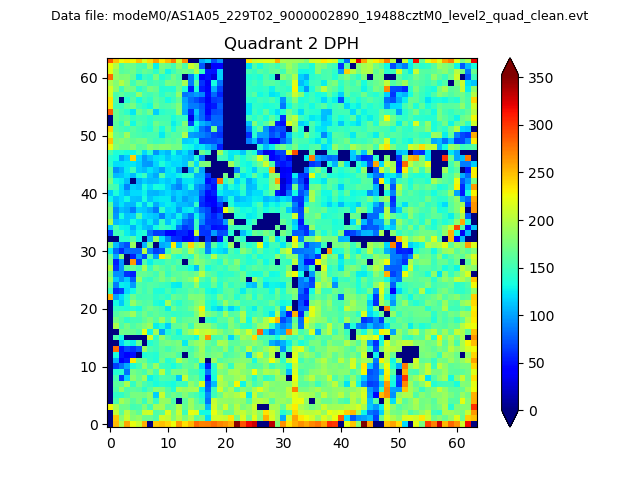
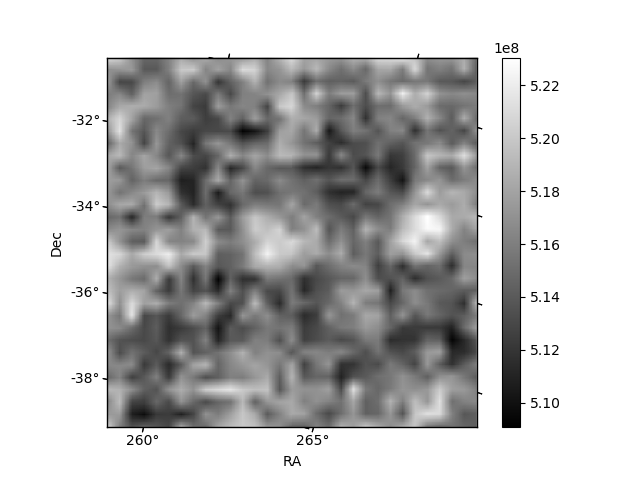
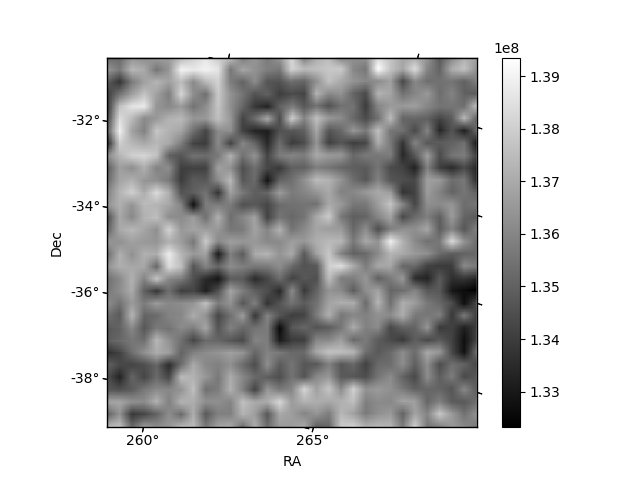
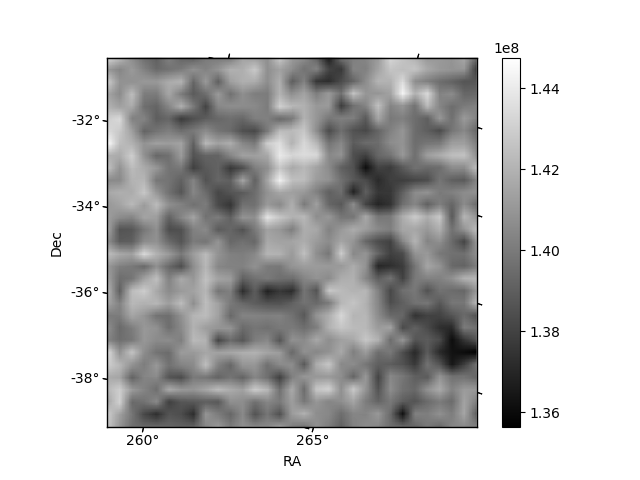
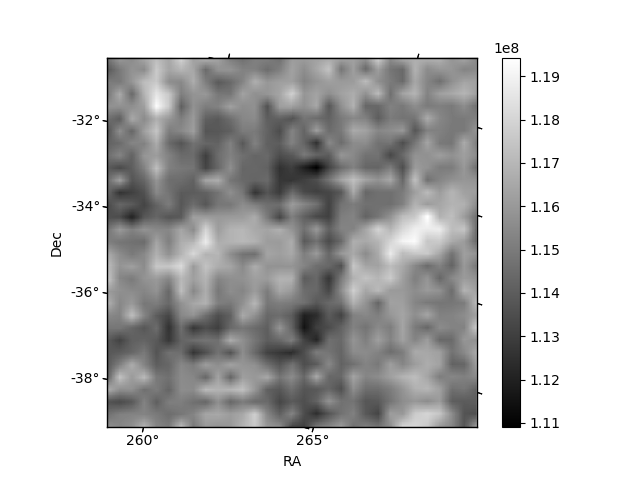
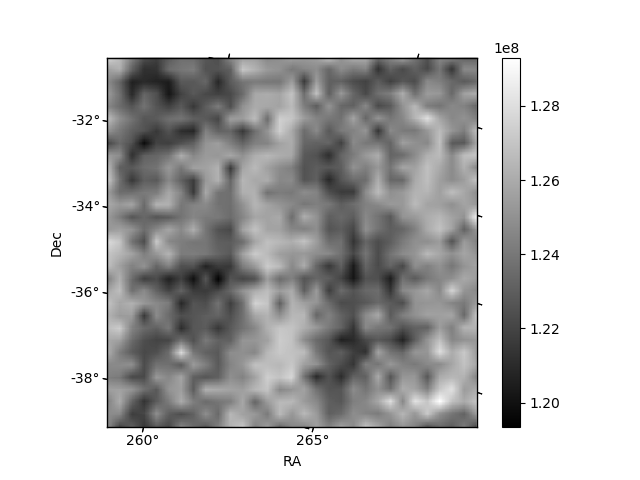
Histogram calculated using DETX and DETY for each event in the final _common_clean file
| Quadrant A | 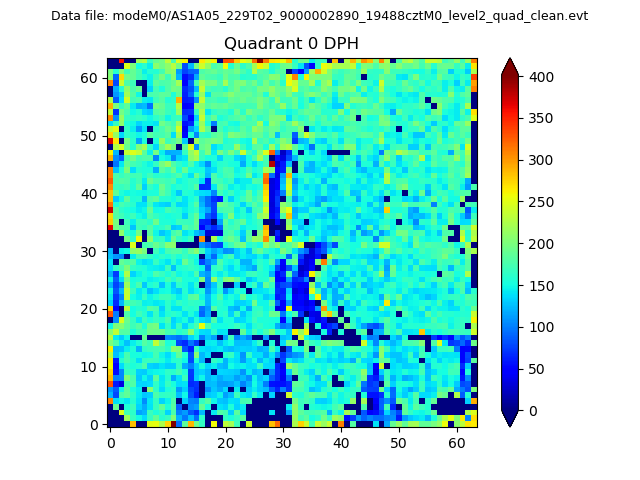 |
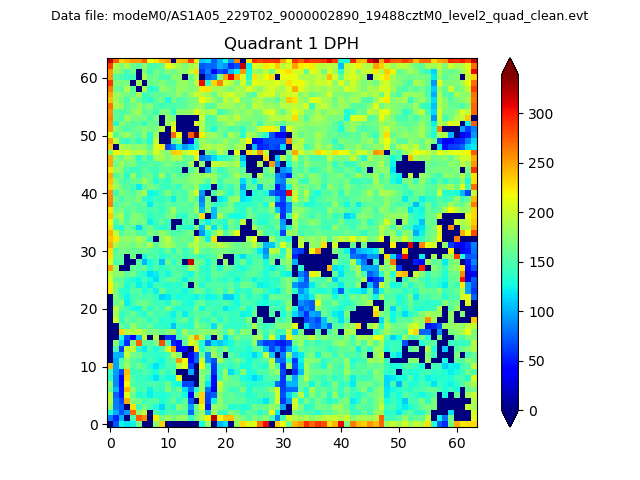 |
Quadrant B |
|---|---|---|---|
| Quadrant D | 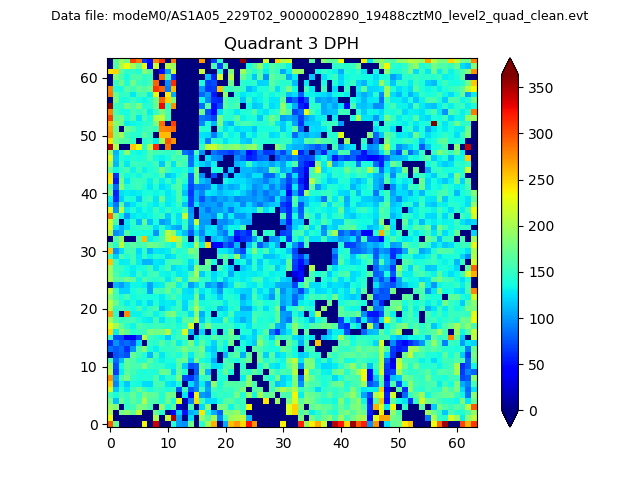 |
 |
Quadrant C |
| Plot type | Count rate plots | Images |
|---|---|---|
| Comparison with Poisson distribution Blue bars denote a histogram of data divided into 1 sec bins. Red curve is a Poisson curve with rate = median count rate of data. |
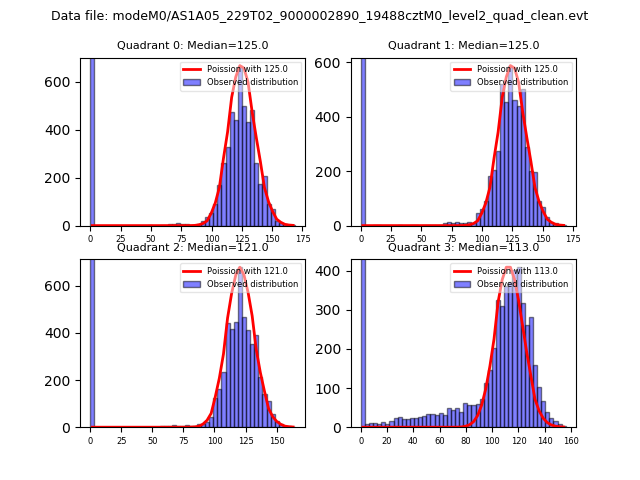 |
 |
| Quadrant-wise count rates Data is divided into 100 sec bins |
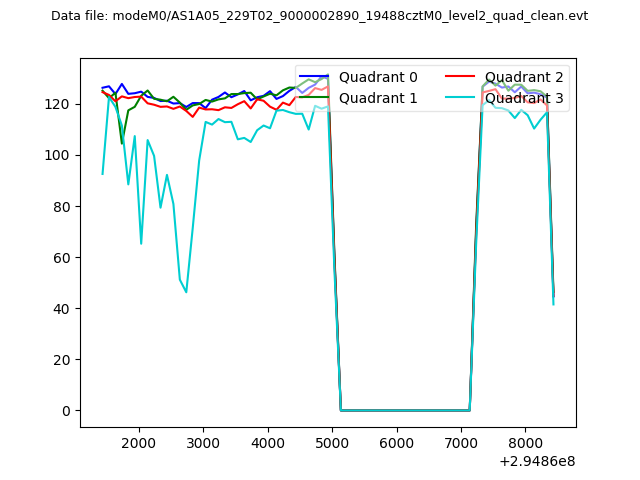 |
|
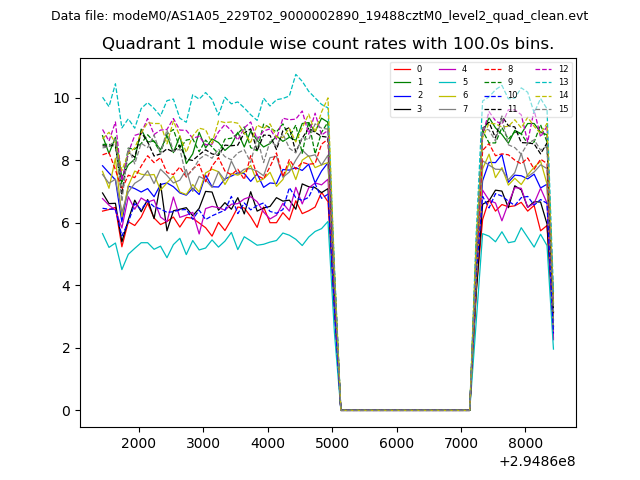
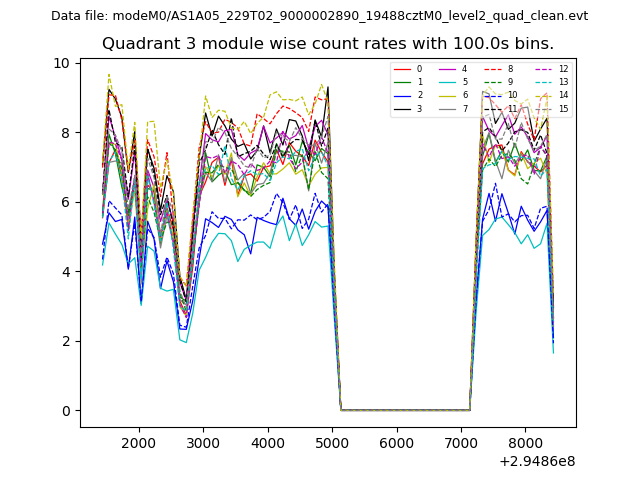
| Module-wise count rates for Quadrant A Data is divided into 100 sec bins |
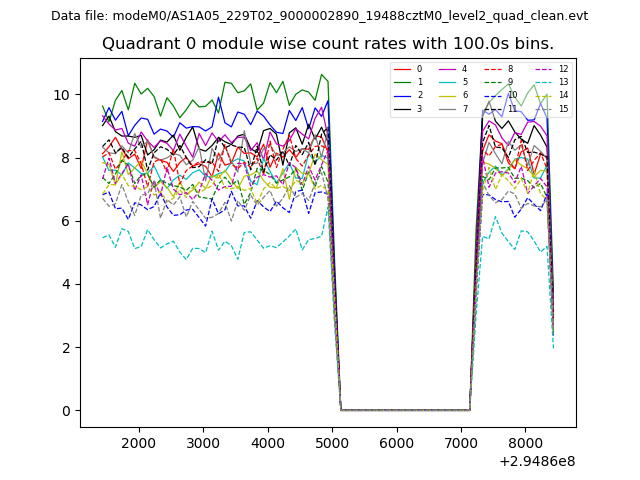 |
 |
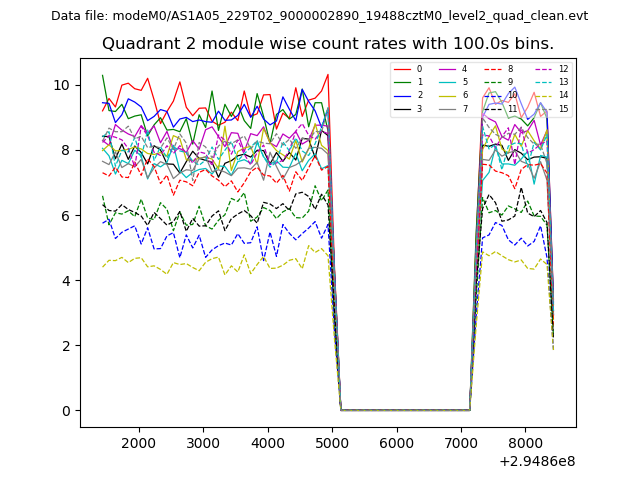
| Module-wise count rates for Quadrant B Data is divided into 100 sec bins |
 |
 |
| Module-wise count rates for Quadrant C Data is divided into 100 sec bins |
 |
 |
| Module-wise count rates for Quadrant D Data is divided into 100 sec bins |
 |
 |
| Parameter | Plot |
|---|---|
| CZT HV Monitor | 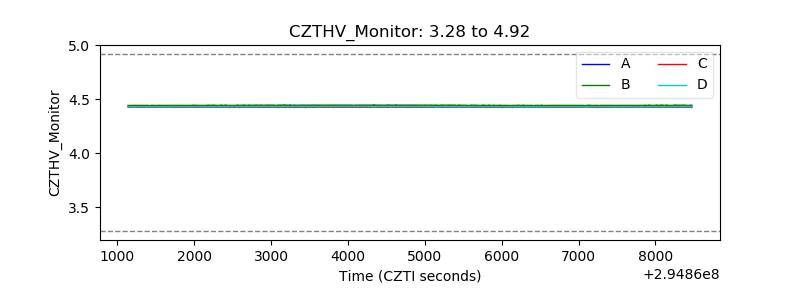 |
| D_VDD | 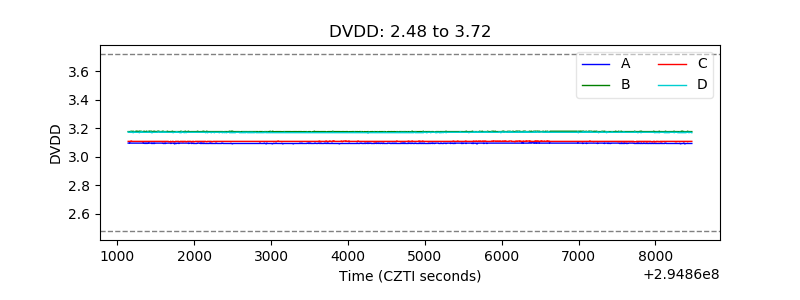 |
| Temperature 1 | 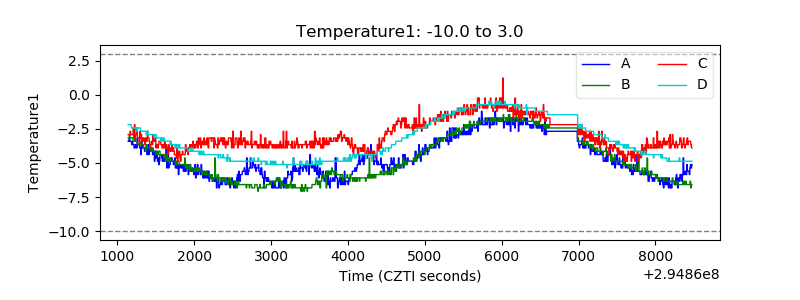 |
| Veto HV Monitor | 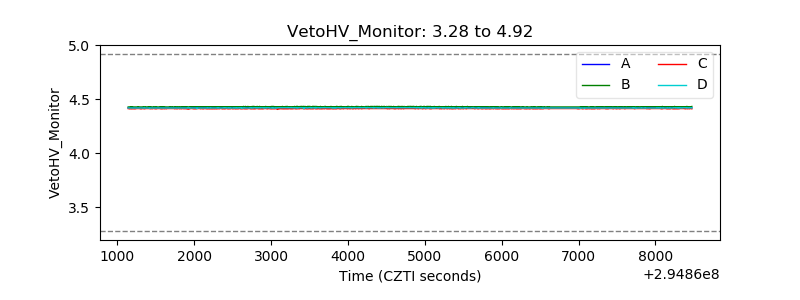 |
| Veto LLD | 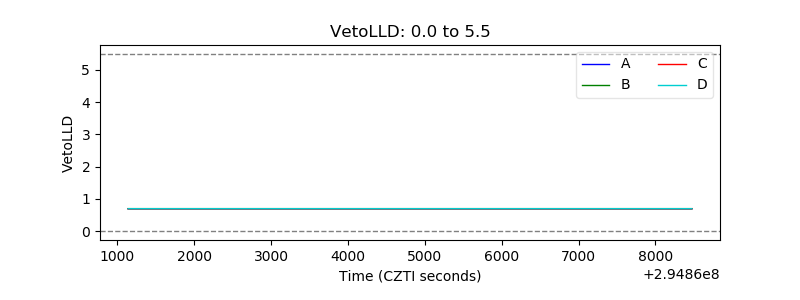 |
| Alpha Counter | 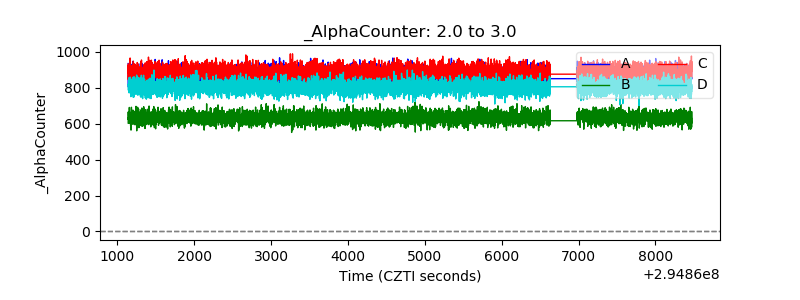 |
| _CPM_Rate | 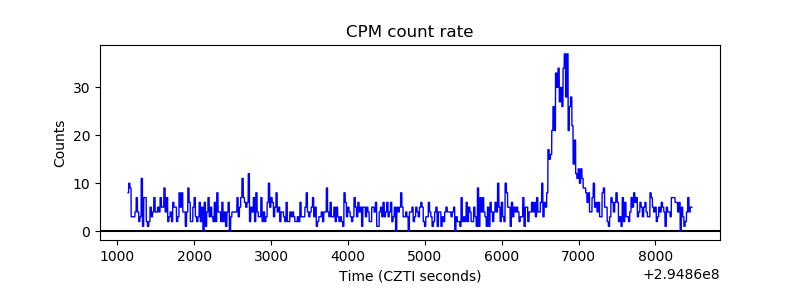 |
| CZT Counter | 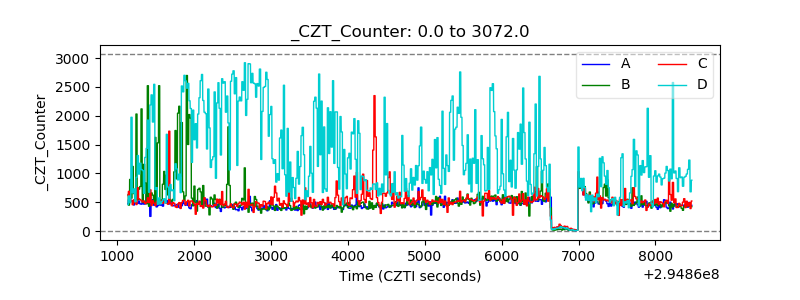 |
| +2.5 Volts monitor | 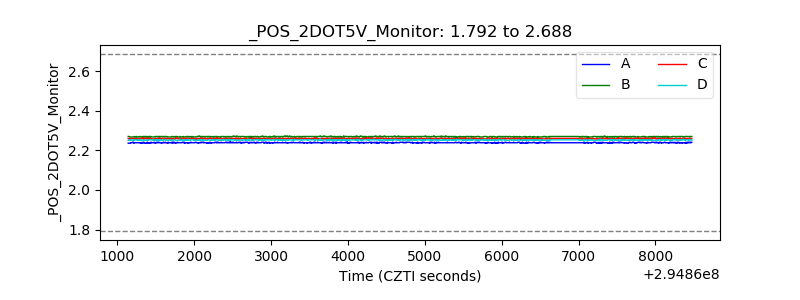 |
| +5 Volts monitor | 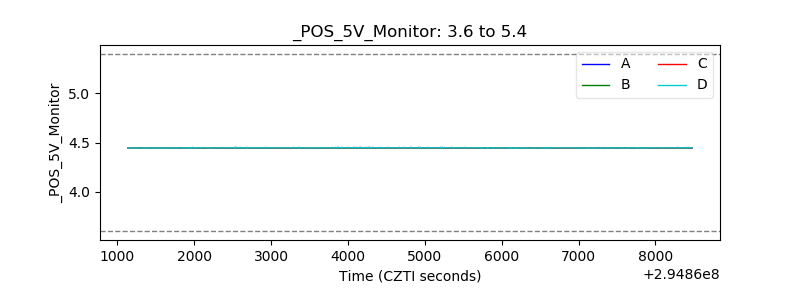 |
| _ROLL_ROT | 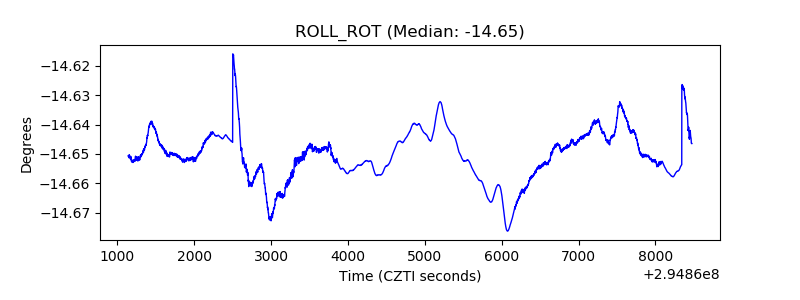 |
| _Roll_DEC | 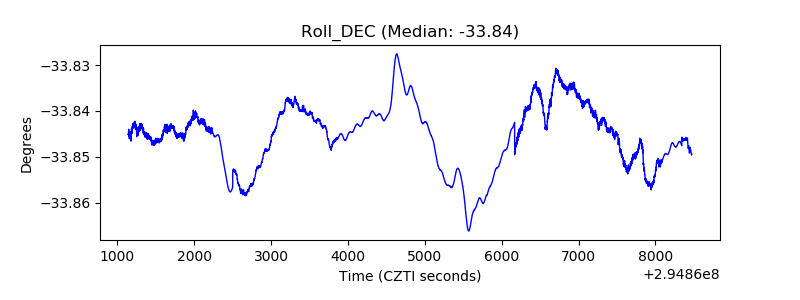 |
| _Roll_RA | 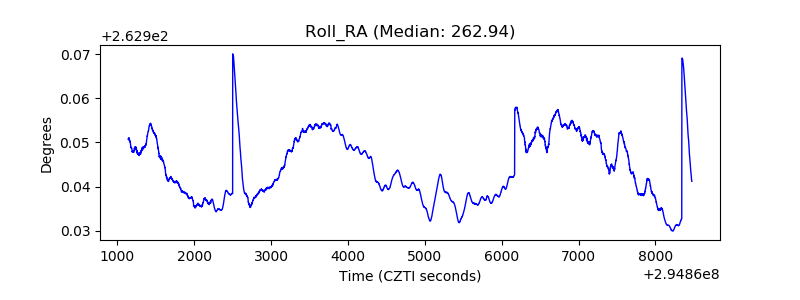 |
| Veto Counter | 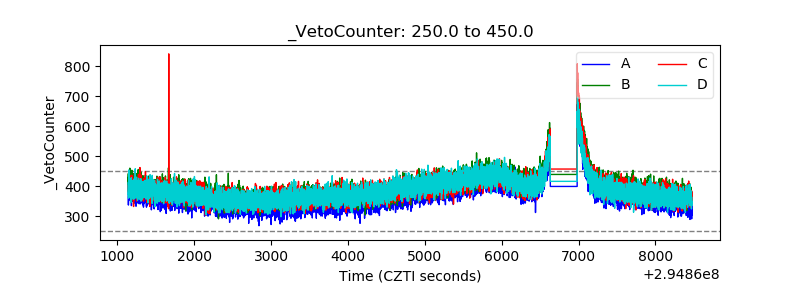 |