| Param | Original file | Final file |
|---|---|---|
| Filename | modeM0/AS1A05_229T02_9000002890_19491cztM0_level2.evt | modeM0/AS1A05_229T02_9000002890_19491cztM0_level2_quad_clean.evt |
| Size (bytes) | 256,841,280 | 58,296,960 |
| Size | 244.9 MB | 55.6 MB |
| Events in quadrant A | 1,571,653 | 387,516 |
| Events in quadrant B | 1,611,069 | 390,740 |
| Events in quadrant C | 1,723,732 | 377,931 |
| Events in quadrant D | 2,635,411 | 363,837 |
| Mode M0 | |||
|---|---|---|---|
| Quadrant | BADHDUFLAG | Total packets | Discarded packets |
| A | 0 | 7137 | 1 |
| B | 0 | 7207 | 1 |
| C | 0 | 7358 | 1 |
| D | 0 | 10161 | 1 |
| Mode SS | |||
|---|---|---|---|
| Quadrant | BADHDUFLAG | Total packets | Discarded packets |
| A | 0 | 70 | 0 |
| B | 0 | 70 | 0 |
| C | 0 | 70 | 0 |
| D | 0 | 70 | 0 |
| Quadrant | Total seconds | Saturated seconds | Saturation percentage |
|---|---|---|---|
| A | 3455 | 29 | 0.839363% |
| B | 3456 | 52 | 1.504630% |
| C | 3456 | 52 | 1.504630% |
| D | 3456 | 59 | 1.707176% |
Noise dominated data is calculated using 1-second bins in cleaned event files. If a bin has >2000 counts, and if more than 50% of those come from <1% of pixels, then it is considered to be noise-dominated and hence unusable.
| Quadrant | # 1 sec bins | Bins with >0 counts | Bins with >2000 counts | High rate bins dominated by noise | Noise dominated (total time) | Noise dominated (detector-on time) | Marked lightcurve |
|---|---|---|---|---|---|---|---|
| A | 3455 | 3455 | 4 | 4 | 0.12% | 0.12% | 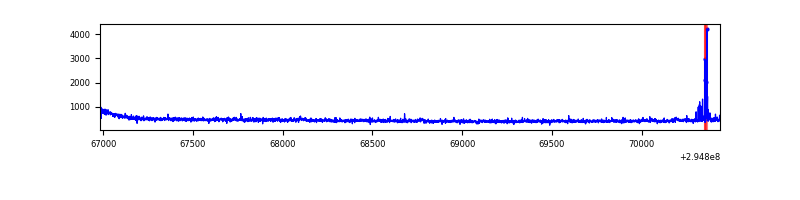 |
| B | 3456 | 3456 | 2 | 2 | 0.06% | 0.06% | 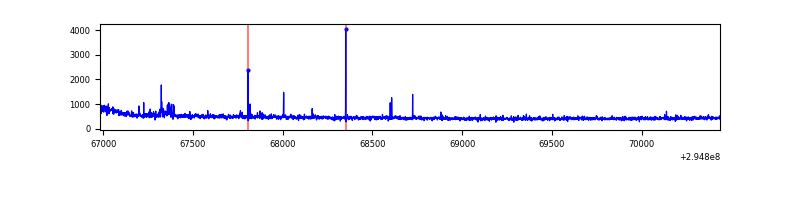 |
| C | 3456 | 3456 | 1 | 1 | 0.03% | 0.03% | 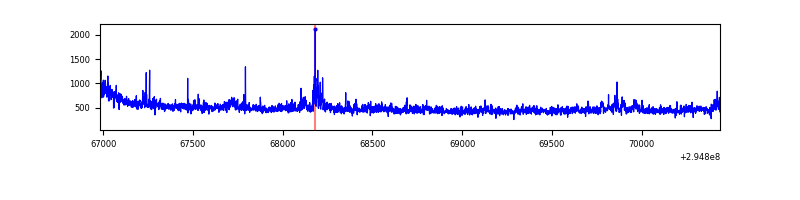 |
| D | 3456 | 3456 | 44 | 44 | 1.27% | 1.27% | 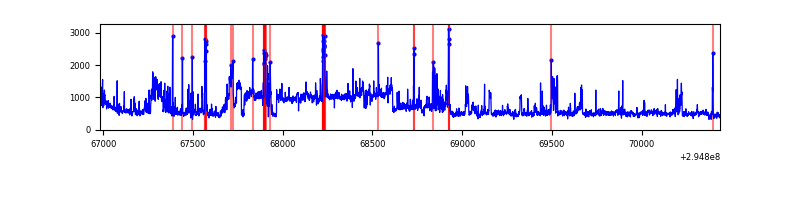 |
Top three noisy pixels from each quadrant. If the there are fewer than three noisy pixels in the level2.evt file, extra rows are filled as -1
| Pixel properties | Quadrant properties | ||||||
|---|---|---|---|---|---|---|---|
| Quadrant | DetID | PixID | Counts | Sigma | Mean | Median | Sigma |
| A | 10 | 253 | 44014 | 541.14 | 393 | 385 | 80.6 |
| A | 11 | 29 | 8082 | 95.47 | 393 | 385 | 80.6 |
| A | 13 | 254 | 3562 | 39.41 | 393 | 385 | 80.6 |
| B | 0 | 197 | 21668 | 277.31 | 396 | 386 | 76.7 |
| B | 3 | 112 | 10463 | 131.31 | 396 | 386 | 76.7 |
| B | 12 | 111 | 9241 | 115.38 | 396 | 386 | 76.7 |
| C | 9 | 221 | 123809 | 1348.05 | 382 | 384 | 91.6 |
| C | 14 | 238 | 60056 | 651.74 | 382 | 384 | 91.6 |
| C | 3 | 233 | 47757 | 517.41 | 382 | 384 | 91.6 |
| D | 7 | 223 | 830720 | 8774.59 | 381 | 371 | 94.6 |
| D | 7 | 238 | 195967 | 2066.93 | 381 | 371 | 94.6 |
| D | 1 | 52 | 105037 | 1106.04 | 381 | 371 | 94.6 |
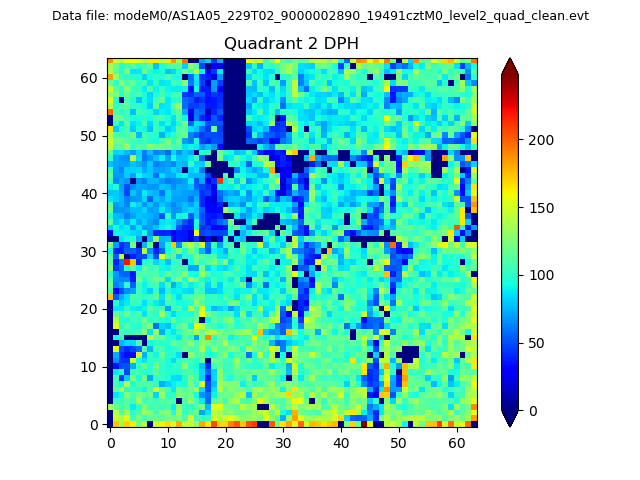
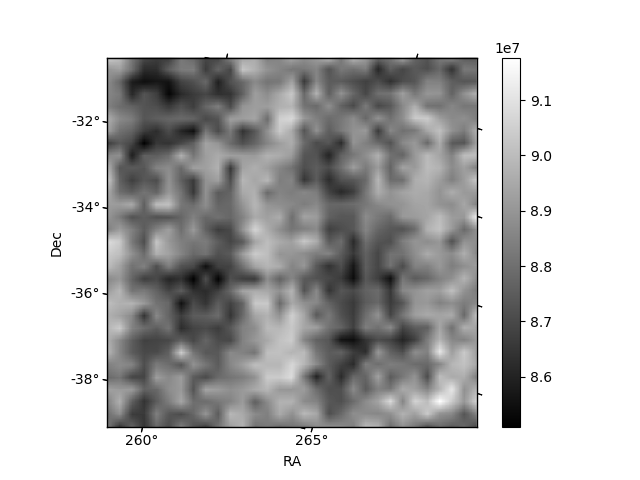
Histogram calculated using DETX and DETY for each event in the final _common_clean file
| Quadrant A | 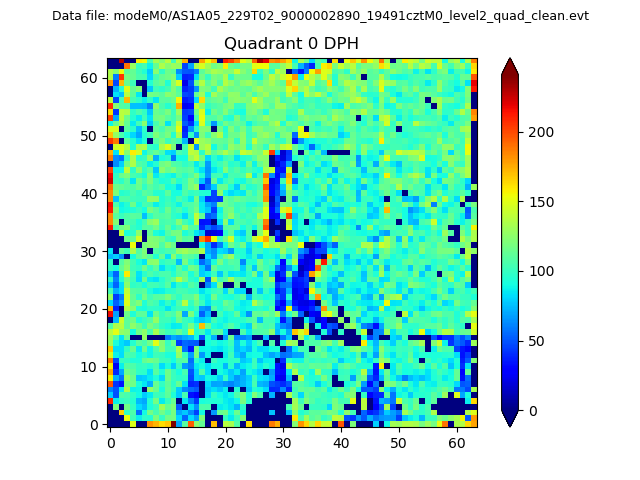 |
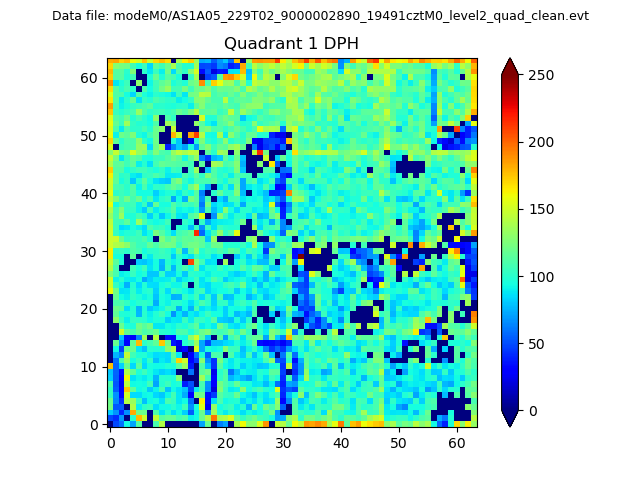 |
Quadrant B |
|---|---|---|---|
| Quadrant D | 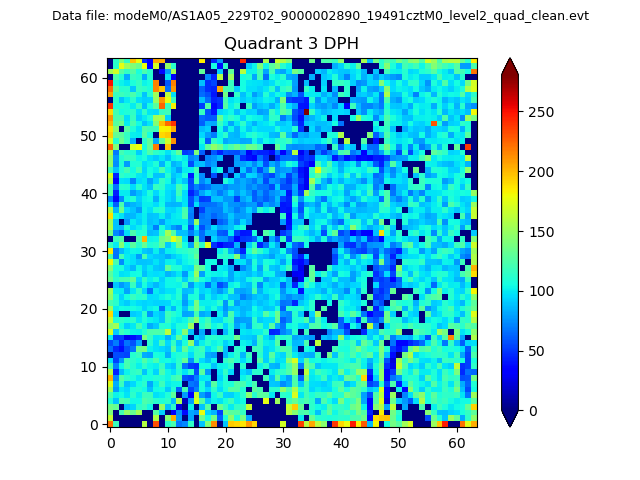 |
 |
Quadrant C |
| Plot type | Count rate plots | Images |
|---|---|---|
| Comparison with Poisson distribution Blue bars denote a histogram of data divided into 1 sec bins. Red curve is a Poisson curve with rate = median count rate of data. |
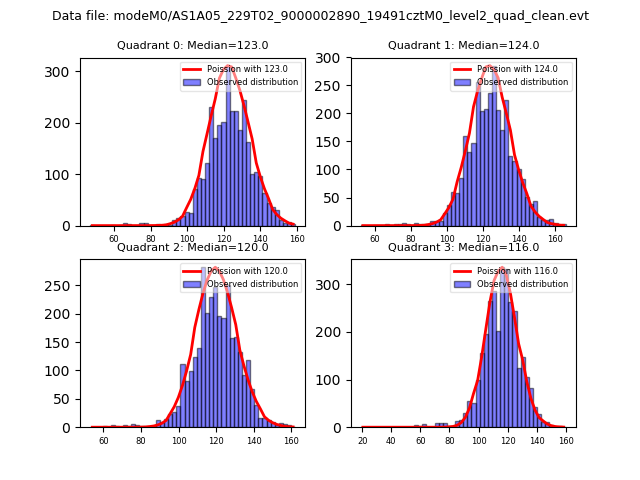 |
 |
| Quadrant-wise count rates Data is divided into 100 sec bins |
 |
|
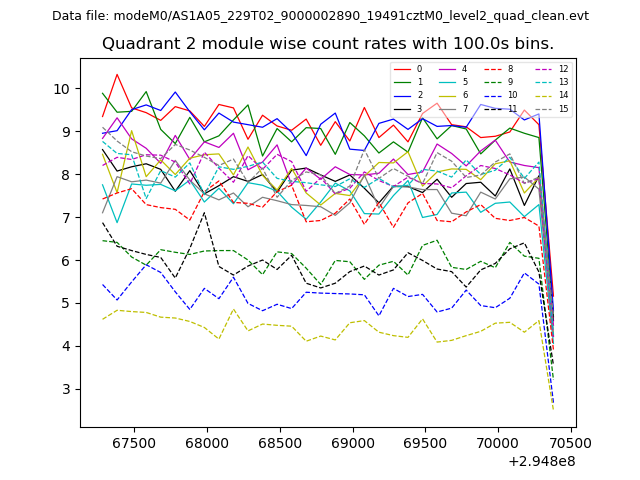
| Module-wise count rates for Quadrant A Data is divided into 100 sec bins |
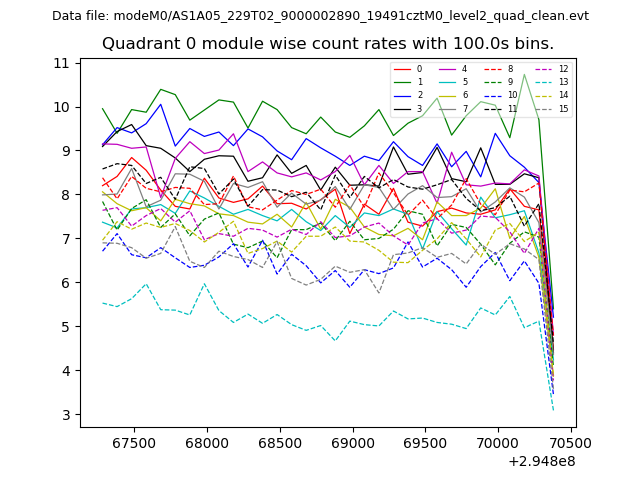 |
 |
| Module-wise count rates for Quadrant B Data is divided into 100 sec bins |
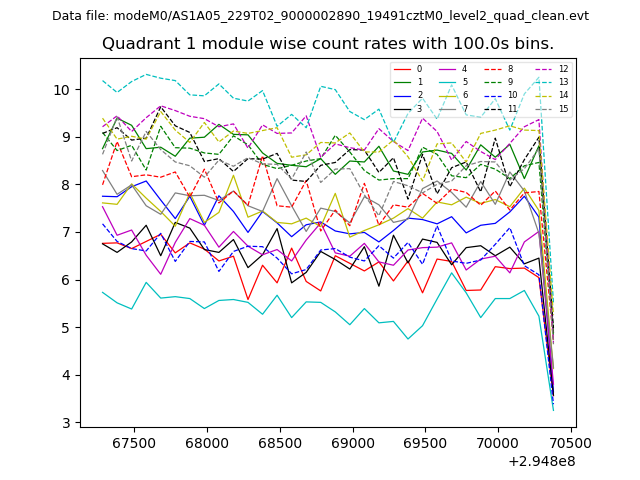 |
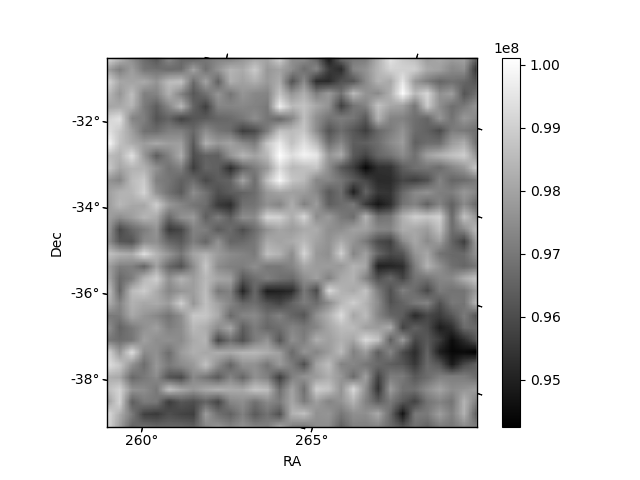 |
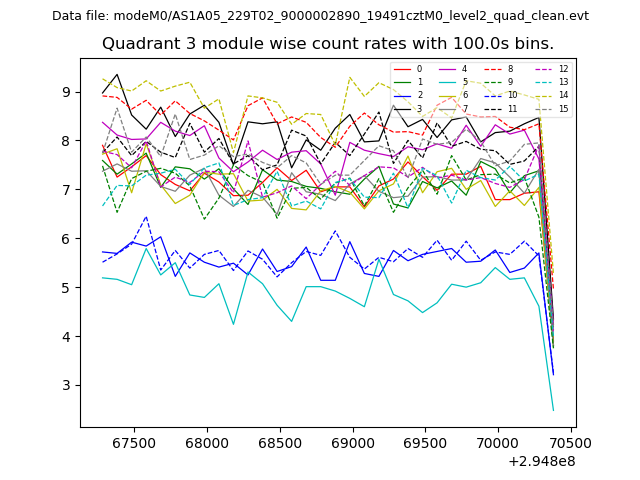
| Module-wise count rates for Quadrant C Data is divided into 100 sec bins |
 |
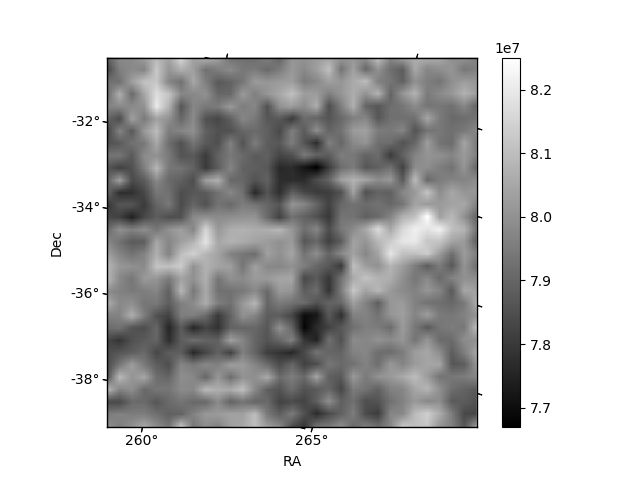 |
| Module-wise count rates for Quadrant D Data is divided into 100 sec bins |
 |
 |
| Parameter | Plot |
|---|---|
| CZT HV Monitor | 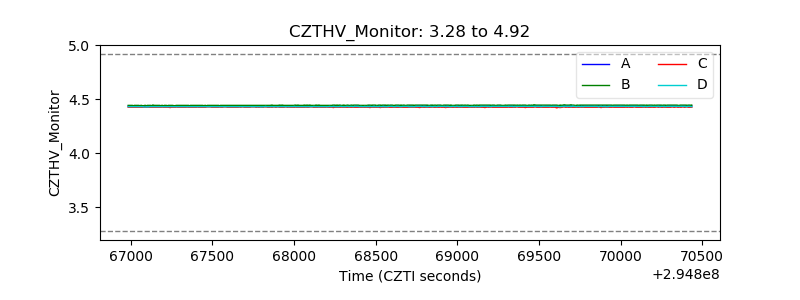 |
| D_VDD | 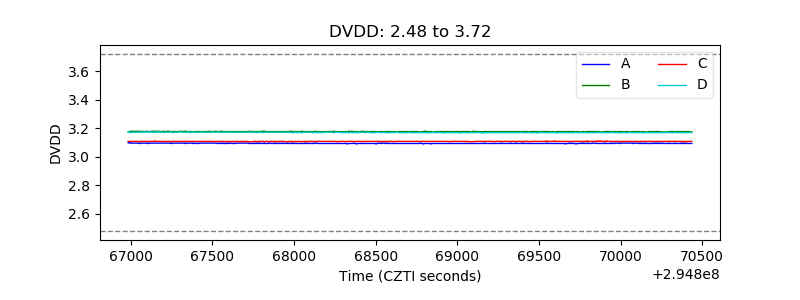 |
| Temperature 1 | 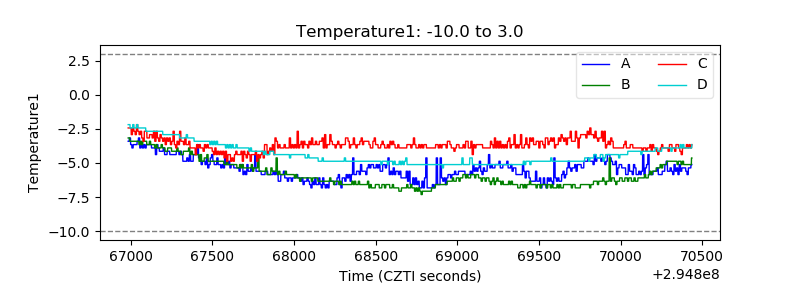 |
| Veto HV Monitor | 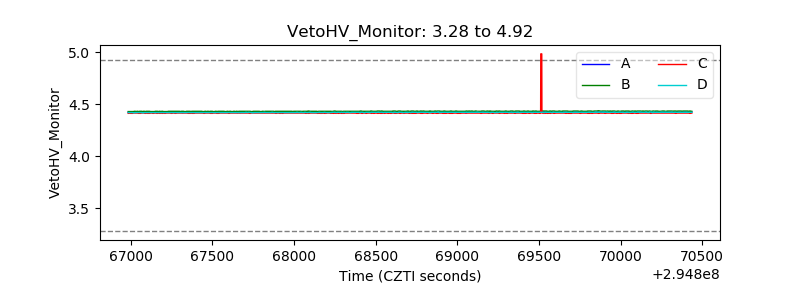 |
| Veto LLD | 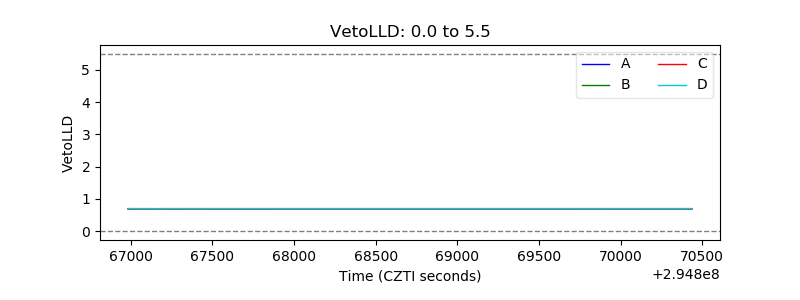 |
| Alpha Counter | 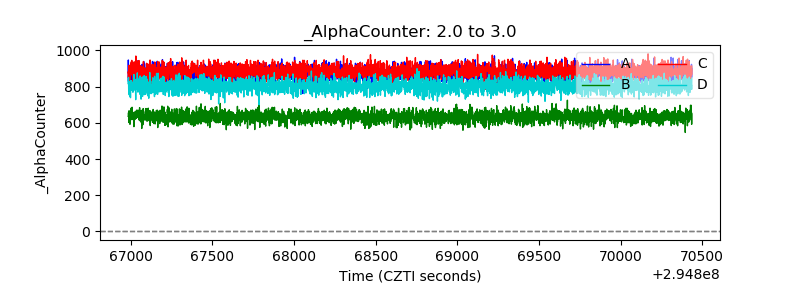 |
| _CPM_Rate | 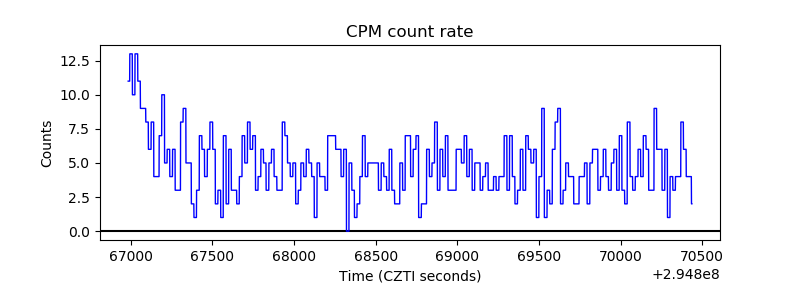 |
| CZT Counter |  |
| +2.5 Volts monitor |  |
| +5 Volts monitor |  |
| _ROLL_ROT | 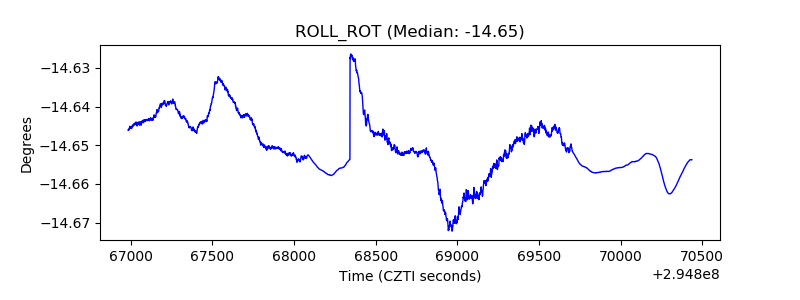 |
| _Roll_DEC | 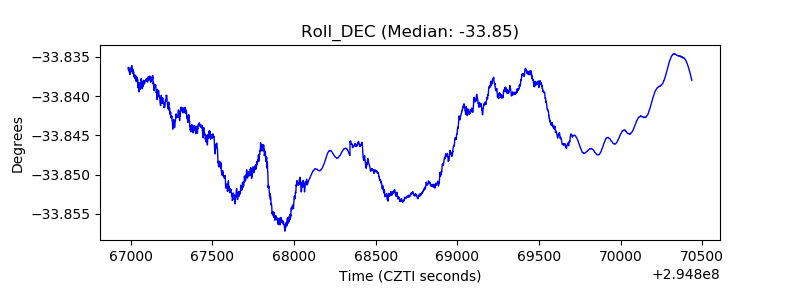 |
| _Roll_RA | 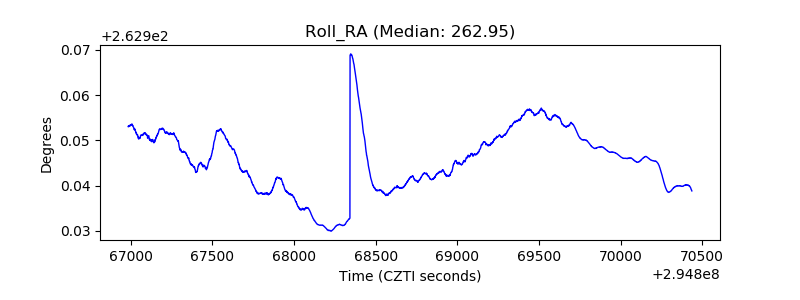 |
| Veto Counter | 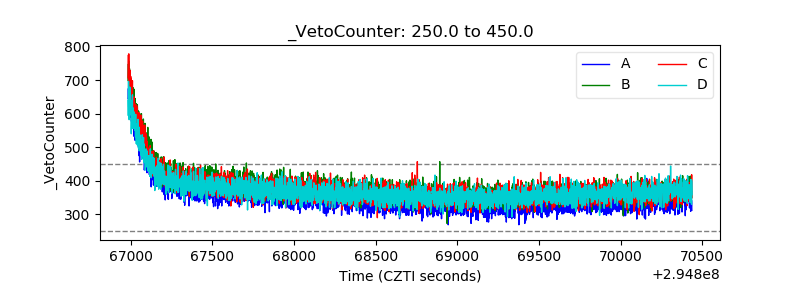 |