| Param | Original file | Final file |
|---|---|---|
| Filename | modeM0/AS1A05_062T01_9000002892cztM0_level2.fits | modeM0/AS1A05_062T01_9000002892cztM0_level2_quad_clean.evt |
| Size (bytes) | 468,838,080 | 353,376,000 |
| Size | 447.1 MB | 337.0 MB |
| Events in quadrant A | 2,923,304 | 1,966,915 |
| Events in quadrant B | 2,785,118 | 1,961,565 |
| Events in quadrant C | 2,830,164 | 1,871,554 |
| Events in quadrant D | 2,466,660 | 1,707,067 |
| Mode M9 | |||
|---|---|---|---|
| Quadrant | BADHDUFLAG | Total packets | Discarded packets |
| A | 0 | 88 | 0 |
| B | 0 | 88 | 0 |
| C | 0 | 88 | 0 |
| D | 0 | 88 | 0 |
| Mode SS | |||
|---|---|---|---|
| Quadrant | BADHDUFLAG | Total packets | Discarded packets |
| A | 0 | 946 | 0 |
| B | 0 | 946 | 0 |
| C | 0 | 950 | 0 |
| D | 0 | 946 | 0 |
| Mode M0 | |||
|---|---|---|---|
| Quadrant | BADHDUFLAG | Total packets | Discarded packets |
| A | 0 | 100864 | 0 |
| B | 0 | 101927 | 0 |
| C | 0 | 106160 | 0 |
| D | 0 | 123336 | 0 |
| Quadrant | Total seconds | Saturated seconds | Saturation percentage |
|---|---|---|---|
| A | 46530 | 586 | 1.259403% |
| B | 46539 | 684 | 1.469735% |
| C | 46530 | 862 | 1.852568% |
| D | 46527 | 1656 | 3.559224% |
Noise dominated data is calculated using 1-second bins in cleaned event files. If a bin has >2000 counts, and if more than 50% of those come from <1% of pixels, then it is considered to be noise-dominated and hence unusable.
| Quadrant | # 1 sec bins | Bins with >0 counts | Bins with >2000 counts | High rate bins dominated by noise | Noise dominated (total time) | Noise dominated (detector-on time) | Marked lightcurve |
|---|---|---|---|---|---|---|---|
| A | 56395 | 46598 | 0 | 0 | 0.00% | 0.00% |  |
| B | 56395 | 46621 | 0 | 0 | 0.00% | 0.00% |  |
| C | 56395 | 46595 | 0 | 0 | 0.00% | 0.00% |  |
| D | 56395 | 46582 | 0 | 0 | 0.00% | 0.00% |  |
Top three noisy pixels from each quadrant. If the there are fewer than three noisy pixels in the level2.evt file, extra rows are filled as -1
| Pixel properties | Quadrant properties | ||||||
|---|---|---|---|---|---|---|---|
| Quadrant | DetID | PixID | Counts | Sigma | Mean | Median | Sigma |
| A | 0 | 29 | 2758 | 10.95 | 762 | 718 | 186.2 |
| A | 7 | 110 | 2357 | 8.8 | 762 | 718 | 186.2 |
| A | 9 | 19 | 2202 | 7.97 | 762 | 718 | 186.2 |
| B | 2 | 9 | 2211 | 10.45 | 736 | 706 | 144.0 |
| B | 2 | 8 | 1913 | 8.38 | 736 | 706 | 144.0 |
| B | 3 | 17 | 1860 | 8.02 | 736 | 706 | 144.0 |
| C | 1 | 80 | 2155 | 7.65 | 747 | 702 | 189.9 |
| C | 1 | 81 | 2124 | 7.49 | 747 | 702 | 189.9 |
| C | 3 | 158 | 1927 | 6.45 | 747 | 702 | 189.9 |
| D | 10 | 189 | 1771 | 6.13 | 704 | 642 | 184.3 |
| D | 6 | 67 | 1736 | 5.94 | 704 | 642 | 184.3 |
| D | 3 | 14 | 1734 | 5.93 | 704 | 642 | 184.3 |
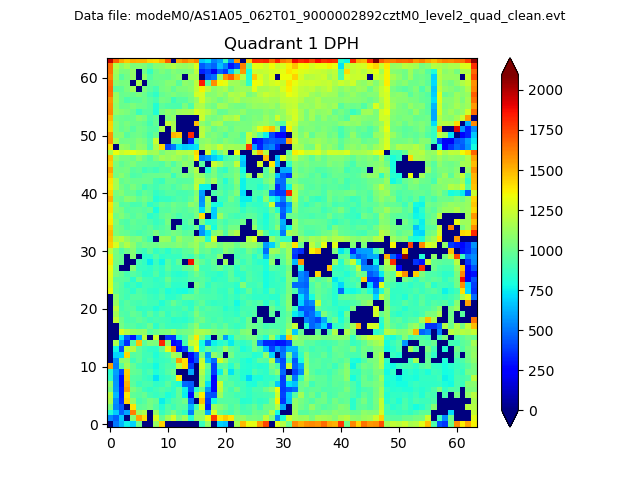
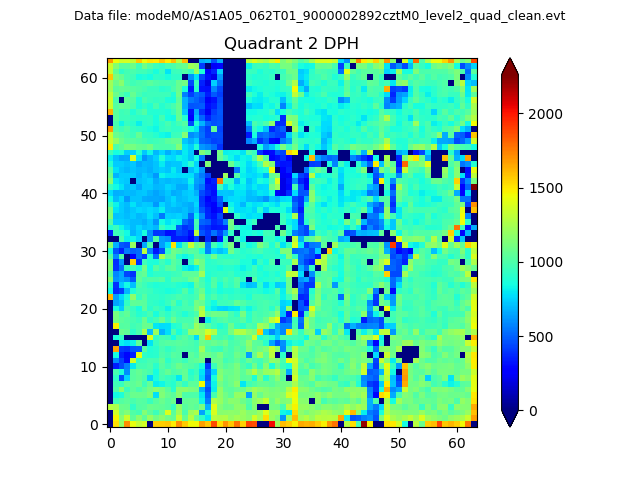
Histogram calculated using DETX and DETY for each event in the final _common_clean file
| Quadrant A |  |
 |
Quadrant B |
|---|---|---|---|
| Quadrant D |  |
 |
Quadrant C |
| Plot type | Count rate plots | Images |
|---|---|---|
| Comparison with Poisson distribution Blue bars denote a histogram of data divided into 1 sec bins. Red curve is a Poisson curve with rate = median count rate of data. |
 |
 |
| Quadrant-wise count rates Data is divided into 100 sec bins |
 |
|
| Module-wise count rates for Quadrant A Data is divided into 100 sec bins |
 |
 |
| Module-wise count rates for Quadrant B Data is divided into 100 sec bins |
 |
 |
| Module-wise count rates for Quadrant C Data is divided into 100 sec bins |
 |
 |
| Module-wise count rates for Quadrant D Data is divided into 100 sec bins |
 |
 |
| Parameter | Plot |
|---|---|
| CZT HV Monitor |  |
| D_VDD | 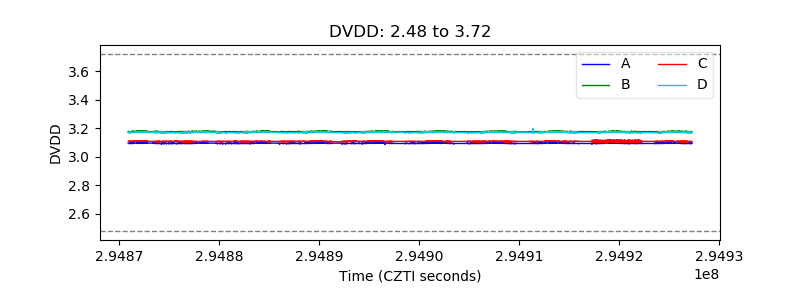 |
| Temperature 1 |  |
| Veto HV Monitor |  |
| Veto LLD |  |
| Alpha Counter |  |
| _CPM_Rate |  |
| CZT Counter |  |
| +2.5 Volts monitor |  |
| +5 Volts monitor |  |
| _ROLL_ROT |  |
| _Roll_DEC |  |
| _Roll_RA |  |
| Veto Counter |  |