| Param | Original file | Final file |
|---|---|---|
| Filename | modeM0/AS1A05_062T01_9000002892_19491cztM0_level2.evt | modeM0/AS1A05_062T01_9000002892_19491cztM0_level2_quad_clean.evt |
| Size (bytes) | 508,196,160 | 73,160,640 |
| Size | 484.7 MB | 69.8 MB |
| Events in quadrant A | 3,639,619 | 442,750 |
| Events in quadrant B | 3,328,104 | 450,868 |
| Events in quadrant C | 3,535,408 | 431,401 |
| Events in quadrant D | 4,424,802 | 414,666 |
| Mode M9 | |||
|---|---|---|---|
| Quadrant | BADHDUFLAG | Total packets | Discarded packets |
| A | 0 | 5 | 0 |
| B | 0 | 5 | 0 |
| C | 0 | 5 | 0 |
| D | 0 | 5 | 0 |
| Mode SS | |||
|---|---|---|---|
| Quadrant | BADHDUFLAG | Total packets | Discarded packets |
| A | 0 | 140 | 0 |
| B | 0 | 140 | 0 |
| C | 0 | 140 | 0 |
| D | 0 | 140 | 0 |
| Mode M0 | |||
|---|---|---|---|
| Quadrant | BADHDUFLAG | Total packets | Discarded packets |
| A | 0 | 15391 | 1 |
| B | 0 | 14255 | 1 |
| C | 0 | 14619 | 1 |
| D | 0 | 17591 | 1 |
| Quadrant | Total seconds | Saturated seconds | Saturation percentage |
|---|---|---|---|
| A | 6817 | 58 | 0.850814% |
| B | 6817 | 53 | 0.777468% |
| C | 6817 | 71 | 1.041514% |
| D | 6817 | 213 | 3.124542% |
Noise dominated data is calculated using 1-second bins in cleaned event files. If a bin has >2000 counts, and if more than 50% of those come from <1% of pixels, then it is considered to be noise-dominated and hence unusable.
| Quadrant | # 1 sec bins | Bins with >0 counts | Bins with >2000 counts | High rate bins dominated by noise | Noise dominated (total time) | Noise dominated (detector-on time) | Marked lightcurve |
|---|---|---|---|---|---|---|---|
| A | 7342 | 6818 | 7 | 7 | 0.10% | 0.10% | 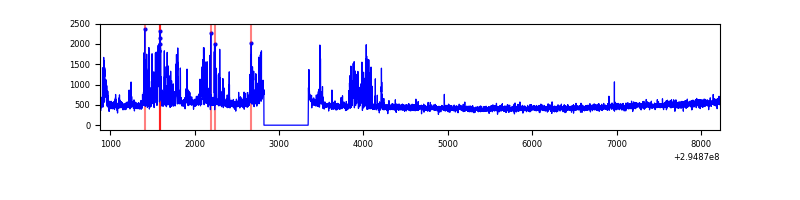 |
| B | 7342 | 6818 | 12 | 12 | 0.16% | 0.18% | 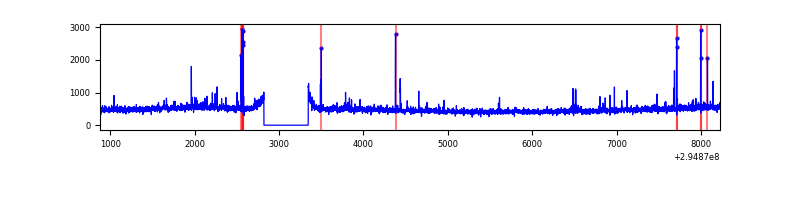 |
| C | 7342 | 6818 | 4 | 4 | 0.05% | 0.06% | 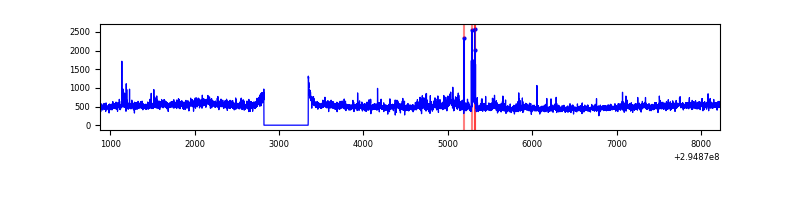 |
| D | 7342 | 6817 | 148 | 148 | 2.02% | 2.17% | 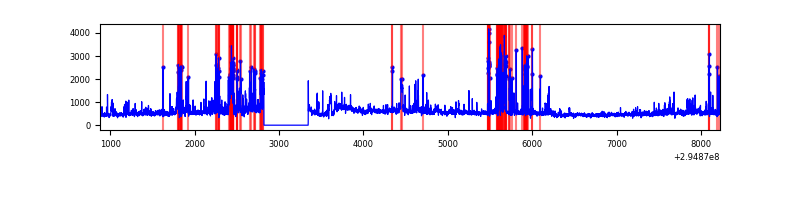 |
Top three noisy pixels from each quadrant. If the there are fewer than three noisy pixels in the level2.evt file, extra rows are filled as -1
| Pixel properties | Quadrant properties | ||||||
|---|---|---|---|---|---|---|---|
| Quadrant | DetID | PixID | Counts | Sigma | Mean | Median | Sigma |
| A | 10 | 253 | 449471 | 2704.75 | 820 | 804 | 165.9 |
| A | 11 | 29 | 18760 | 108.25 | 820 | 804 | 165.9 |
| A | 3 | 1 | 9399 | 51.81 | 820 | 804 | 165.9 |
| B | 4 | 171 | 44909 | 281.2 | 815 | 792 | 156.9 |
| B | 7 | 220 | 20010 | 122.49 | 815 | 792 | 156.9 |
| B | 12 | 111 | 18679 | 114.01 | 815 | 792 | 156.9 |
| C | 9 | 221 | 188396 | 1007.79 | 790 | 796 | 186.2 |
| C | 3 | 233 | 142727 | 762.45 | 790 | 796 | 186.2 |
| C | 14 | 238 | 121826 | 650.17 | 790 | 796 | 186.2 |
| D | 1 | 52 | 554030 | 2830.15 | 794 | 770 | 195.5 |
| D | 7 | 223 | 490969 | 2507.57 | 794 | 770 | 195.5 |
| D | 7 | 238 | 184248 | 938.56 | 794 | 770 | 195.5 |
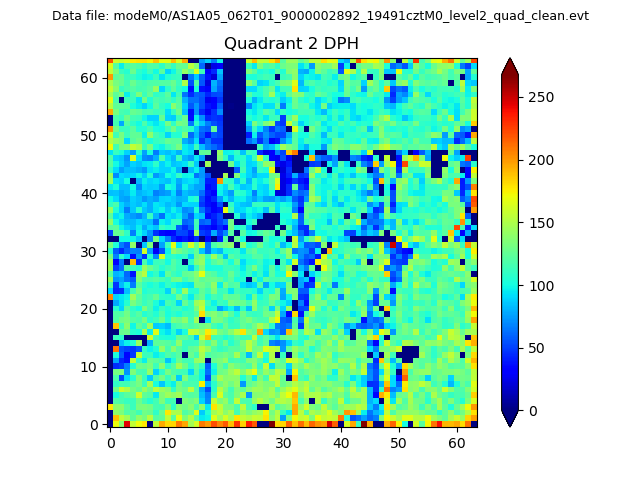
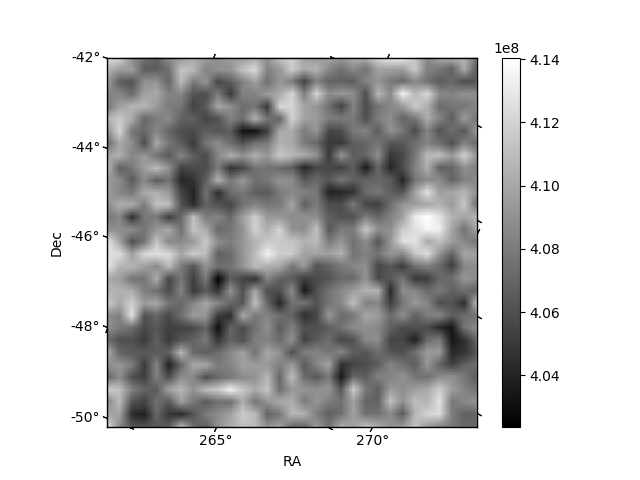
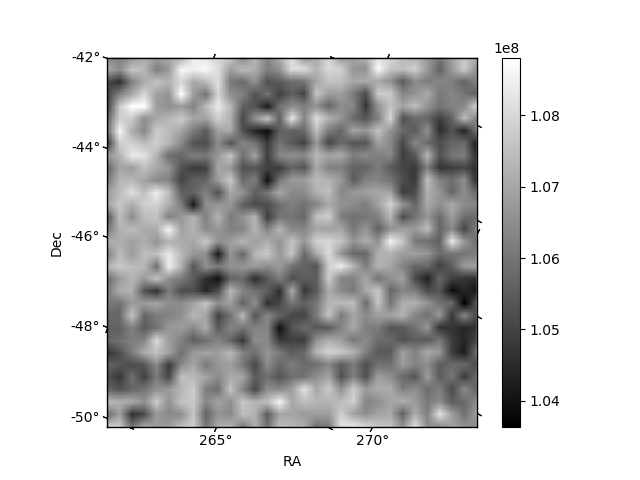
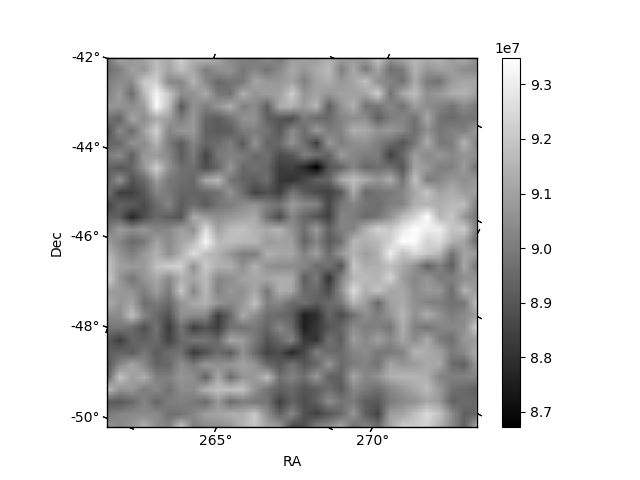
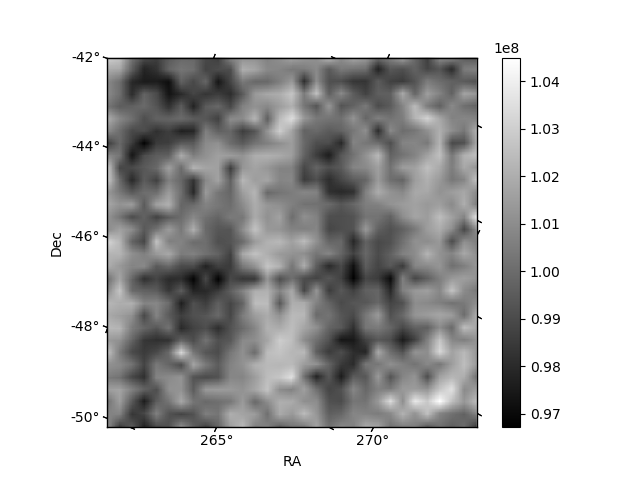
Histogram calculated using DETX and DETY for each event in the final _common_clean file
| Quadrant A | 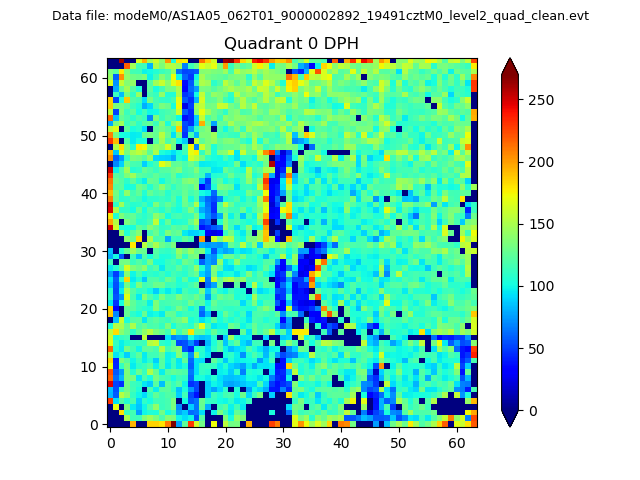 |
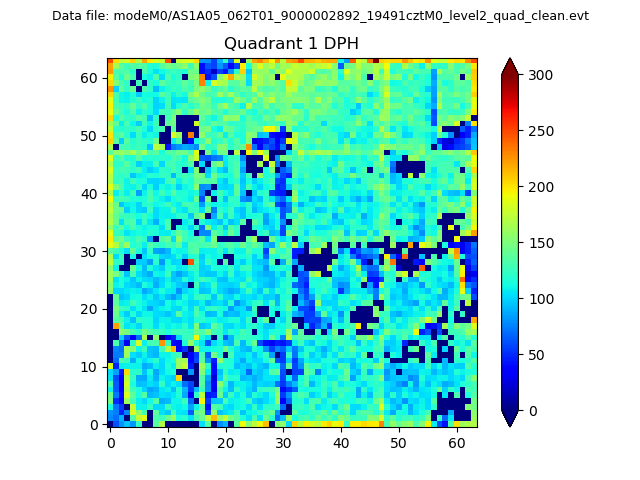 |
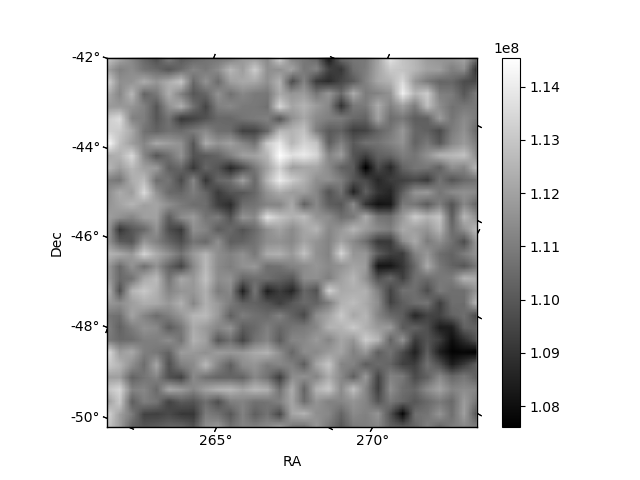
Quadrant B |
|---|---|---|---|
| Quadrant D | 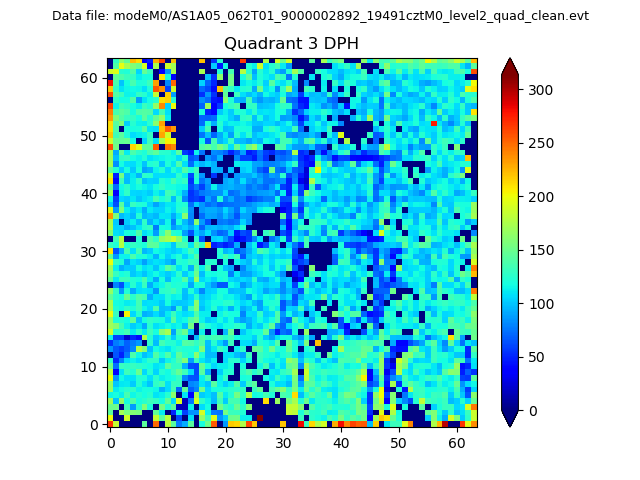 |
 |
Quadrant C |
| Plot type | Count rate plots | Images |
|---|---|---|
| Comparison with Poisson distribution Blue bars denote a histogram of data divided into 1 sec bins. Red curve is a Poisson curve with rate = median count rate of data. |
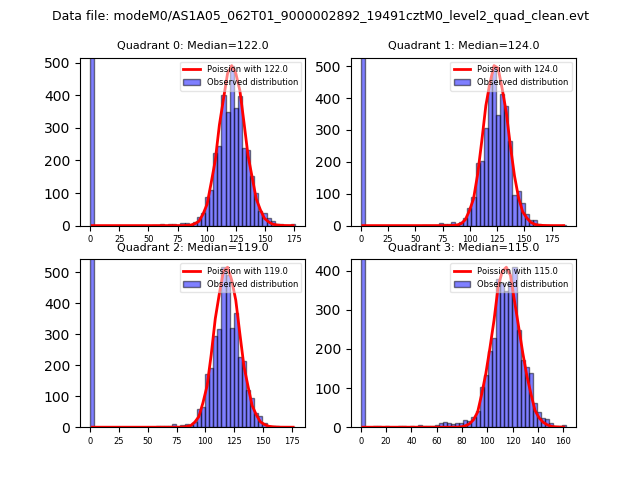 |
 |
| Quadrant-wise count rates Data is divided into 100 sec bins |
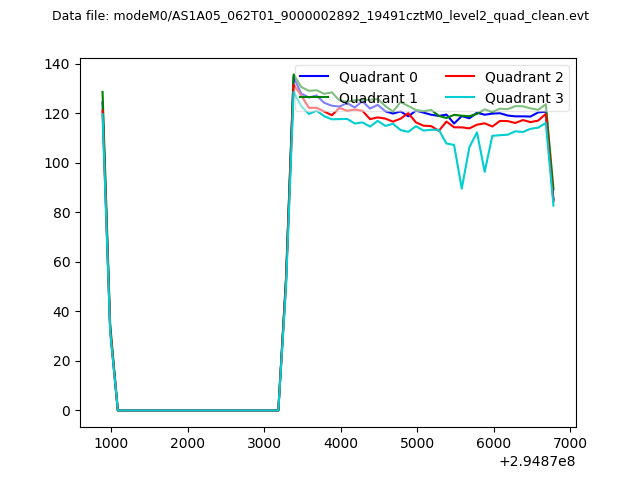 |
|
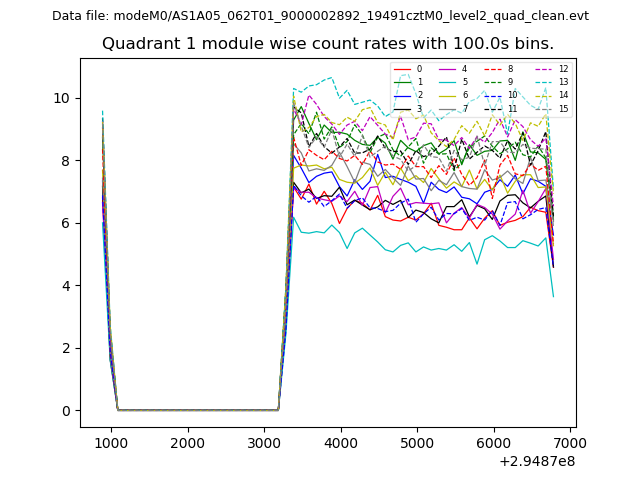
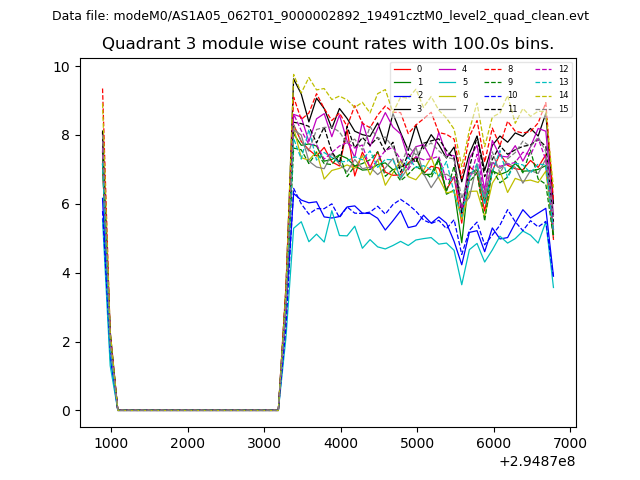
| Module-wise count rates for Quadrant A Data is divided into 100 sec bins |
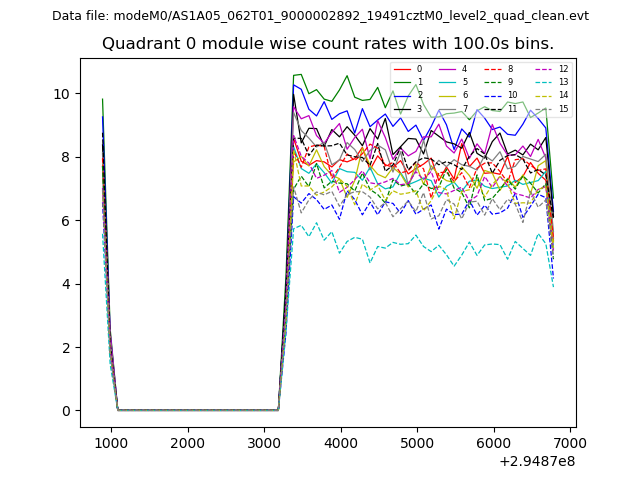 |
 |
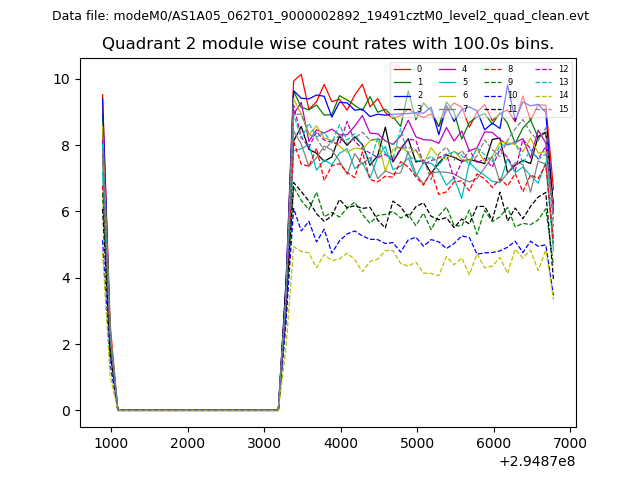
| Module-wise count rates for Quadrant B Data is divided into 100 sec bins |
 |
 |
| Module-wise count rates for Quadrant C Data is divided into 100 sec bins |
 |
 |
| Module-wise count rates for Quadrant D Data is divided into 100 sec bins |
 |
 |
| Parameter | Plot |
|---|---|
| CZT HV Monitor | 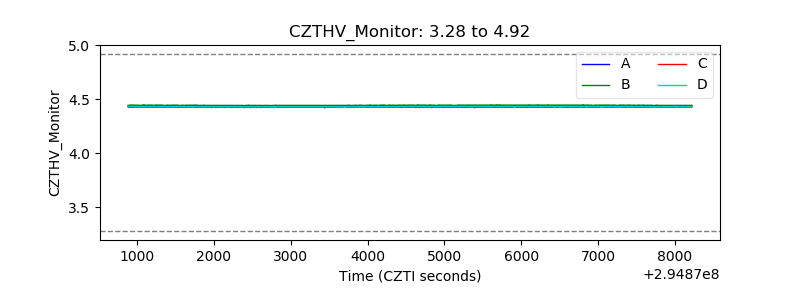 |
| D_VDD | 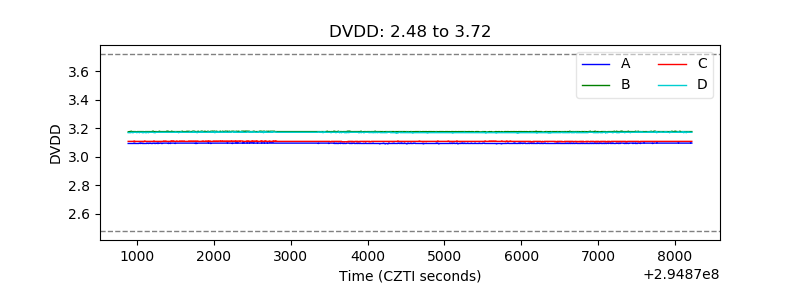 |
| Temperature 1 | 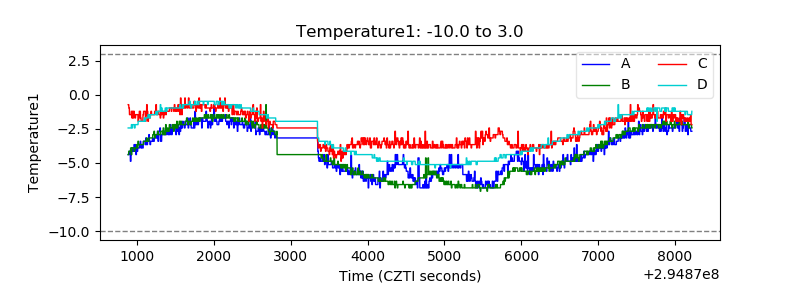 |
| Veto HV Monitor | 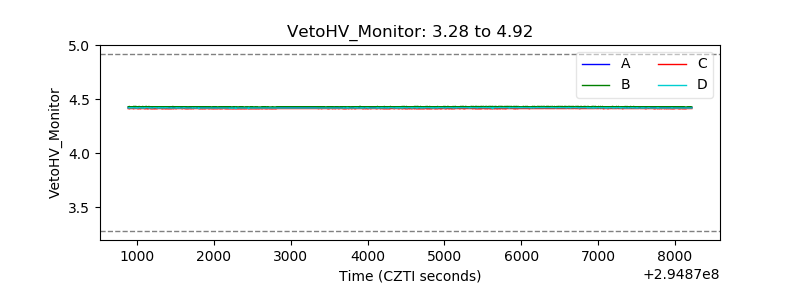 |
| Veto LLD | 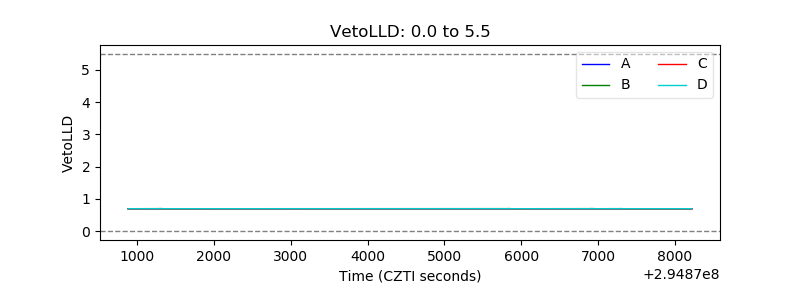 |
| Alpha Counter | 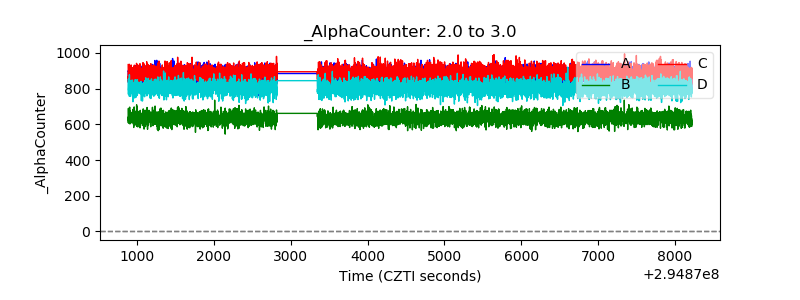 |
| _CPM_Rate | 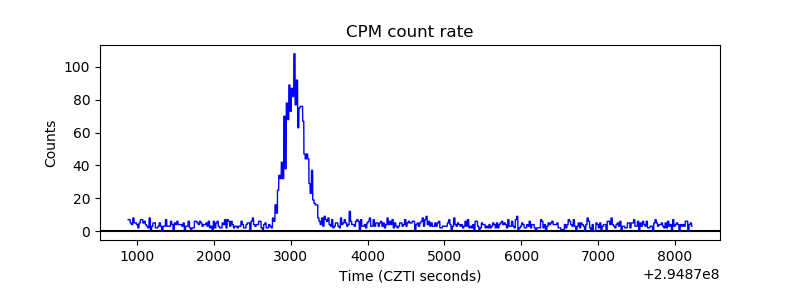 |
| CZT Counter | 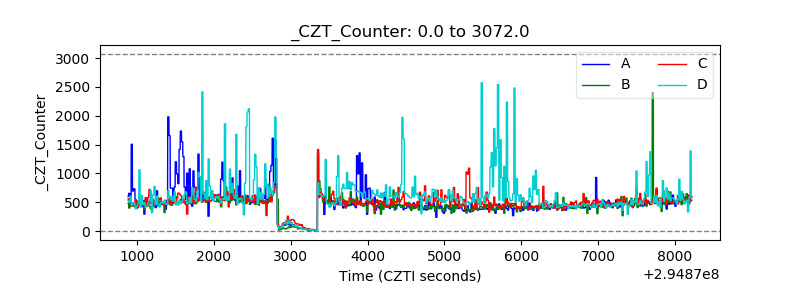 |
| +2.5 Volts monitor |  |
| +5 Volts monitor | 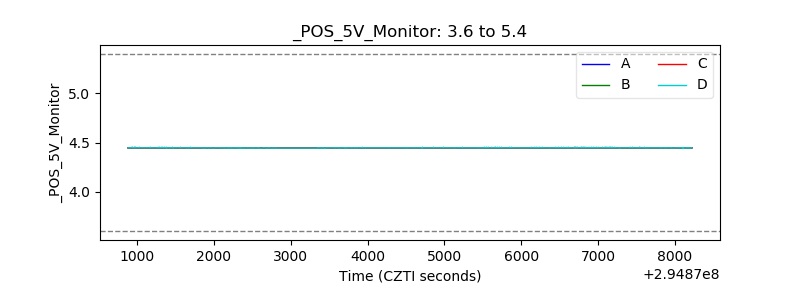 |
| _ROLL_ROT | 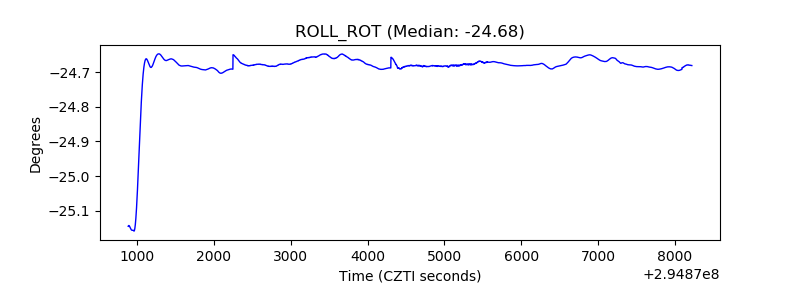 |
| _Roll_DEC | 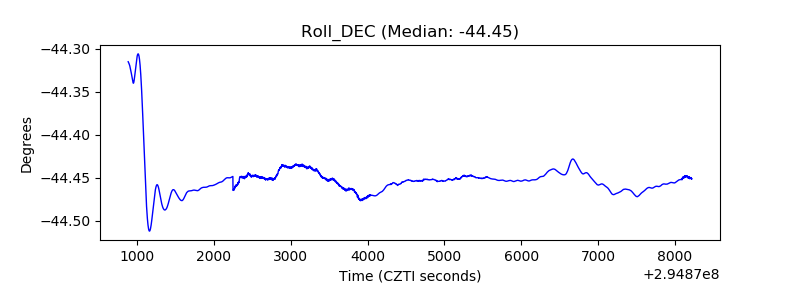 |
| _Roll_RA | 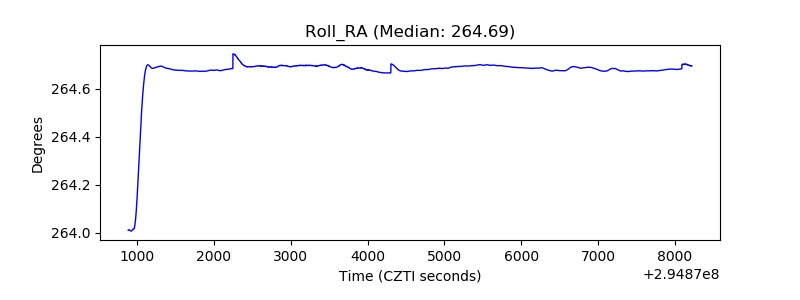 |
| Veto Counter | 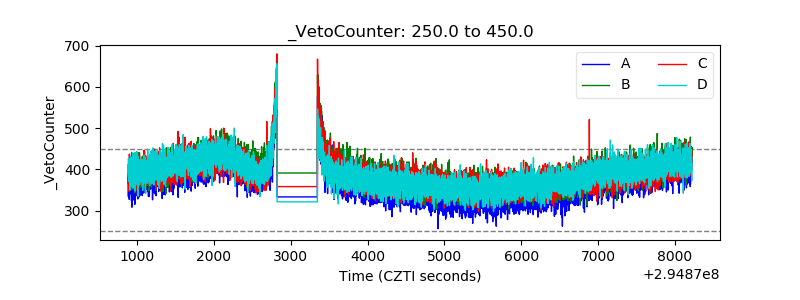 |