| Param | Original file | Final file |
|---|---|---|
| Filename | modeM0/AS1A05_062T01_9000002892_19492cztM0_level2.evt | modeM0/AS1A05_062T01_9000002892_19492cztM0_level2_quad_clean.evt |
| Size (bytes) | 991,339,200 | 167,175,360 |
| Size | 945.4 MB | 159.4 MB |
| Events in quadrant A | 6,847,706 | 1,048,455 |
| Events in quadrant B | 6,658,641 | 1,067,855 |
| Events in quadrant C | 6,919,206 | 1,029,539 |
| Events in quadrant D | 8,696,657 | 996,927 |
| Mode M9 | |||
|---|---|---|---|
| Quadrant | BADHDUFLAG | Total packets | Discarded packets |
| A | 0 | 25 | 0 |
| B | 0 | 25 | 0 |
| C | 0 | 25 | 0 |
| D | 0 | 25 | 0 |
| Mode SS | |||
|---|---|---|---|
| Quadrant | BADHDUFLAG | Total packets | Discarded packets |
| A | 0 | 272 | 0 |
| B | 0 | 272 | 0 |
| C | 0 | 272 | 0 |
| D | 0 | 272 | 0 |
| Mode M0 | |||
|---|---|---|---|
| Quadrant | BADHDUFLAG | Total packets | Discarded packets |
| A | 0 | 28952 | 3 |
| B | 0 | 28227 | 3 |
| C | 0 | 28580 | 3 |
| D | 0 | 34645 | 3 |
| Quadrant | Total seconds | Saturated seconds | Saturation percentage |
|---|---|---|---|
| A | 13322 | 121 | 0.908272% |
| B | 13323 | 149 | 1.118367% |
| C | 13323 | 190 | 1.426105% |
| D | 13323 | 433 | 3.250019% |
Noise dominated data is calculated using 1-second bins in cleaned event files. If a bin has >2000 counts, and if more than 50% of those come from <1% of pixels, then it is considered to be noise-dominated and hence unusable.
| Quadrant | # 1 sec bins | Bins with >0 counts | Bins with >2000 counts | High rate bins dominated by noise | Noise dominated (total time) | Noise dominated (detector-on time) | Marked lightcurve |
|---|---|---|---|---|---|---|---|
| A | 15777 | 13325 | 11 | 11 | 0.07% | 0.08% | 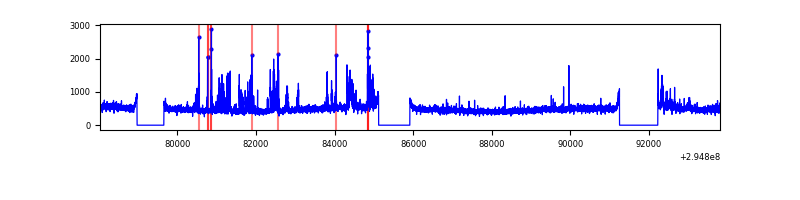 |
| B | 15778 | 13326 | 36 | 36 | 0.23% | 0.27% | 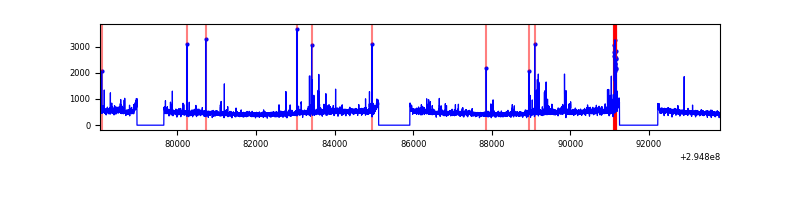 |
| C | 15778 | 13324 | 14 | 14 | 0.09% | 0.11% | 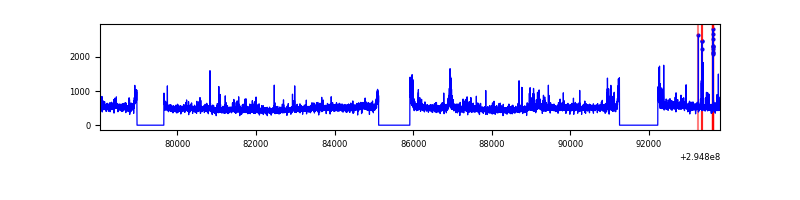 |
| D | 15778 | 13325 | 297 | 297 | 1.88% | 2.23% | 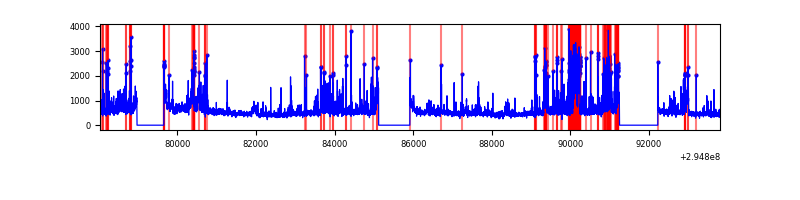 |
Top three noisy pixels from each quadrant. If the there are fewer than three noisy pixels in the level2.evt file, extra rows are filled as -1
| Pixel properties | Quadrant properties | ||||||
|---|---|---|---|---|---|---|---|
| Quadrant | DetID | PixID | Counts | Sigma | Mean | Median | Sigma |
| A | 10 | 253 | 597656 | 1843.72 | 1611 | 1573 | 323.3 |
| A | 11 | 47 | 25820 | 75.0 | 1611 | 1573 | 323.3 |
| A | 11 | 29 | 19170 | 54.43 | 1611 | 1573 | 323.3 |
| B | 7 | 220 | 138614 | 448.8 | 1607 | 1566 | 305.4 |
| B | 3 | 64 | 53815 | 171.1 | 1607 | 1566 | 305.4 |
| B | 4 | 171 | 47795 | 151.39 | 1607 | 1566 | 305.4 |
| C | 9 | 221 | 312515 | 856.07 | 1560 | 1571 | 363.2 |
| C | 14 | 238 | 241047 | 659.31 | 1560 | 1571 | 363.2 |
| C | 3 | 233 | 168656 | 460.01 | 1560 | 1571 | 363.2 |
| D | 7 | 238 | 739401 | 1961.22 | 1559 | 1514 | 376.2 |
| D | 1 | 52 | 726957 | 1928.14 | 1559 | 1514 | 376.2 |
| D | 7 | 223 | 536789 | 1422.7 | 1559 | 1514 | 376.2 |
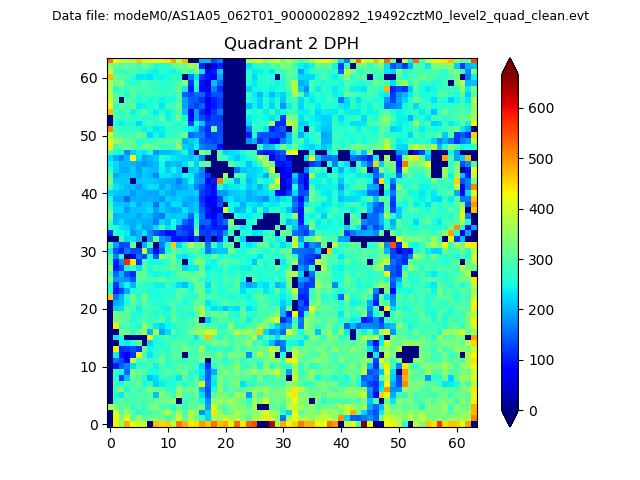
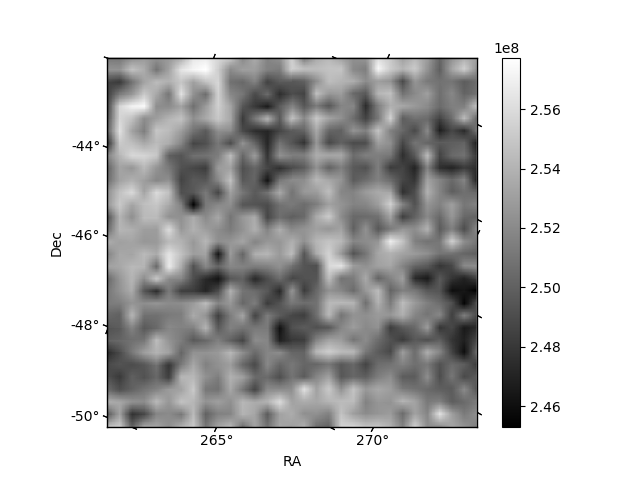
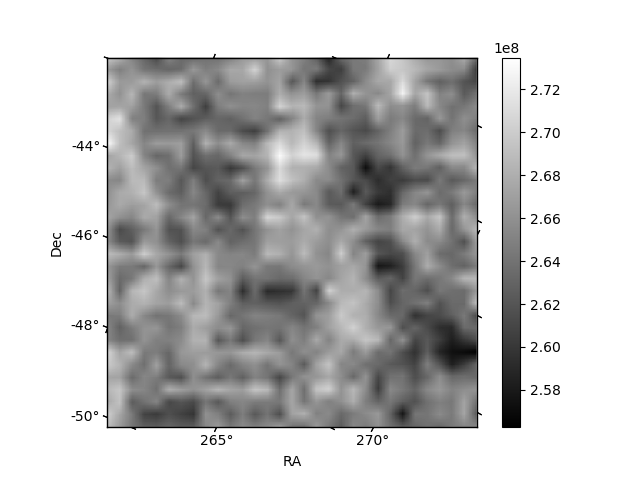
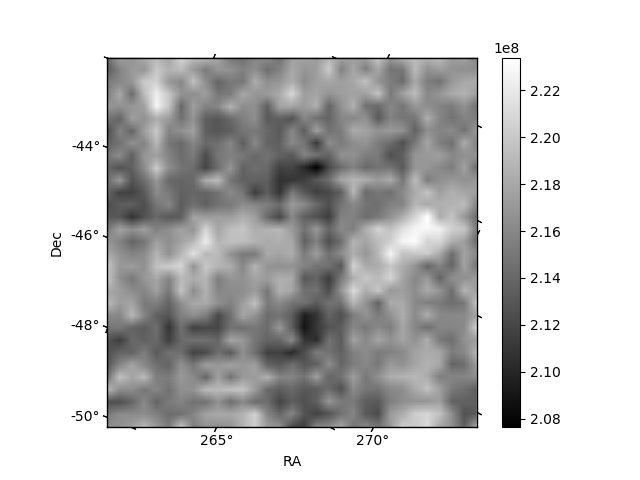
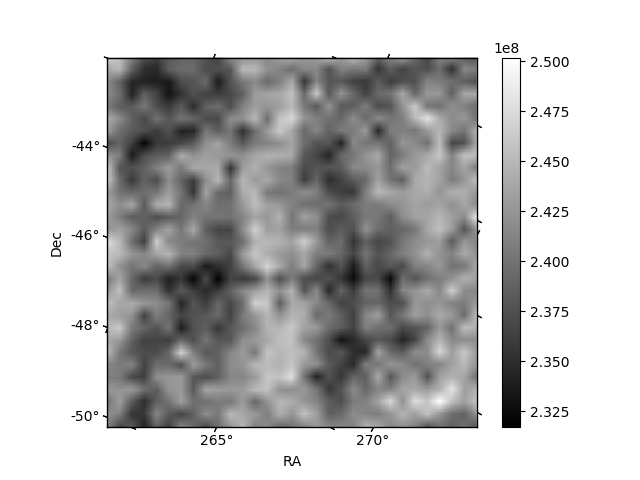
Histogram calculated using DETX and DETY for each event in the final _common_clean file
| Quadrant A | 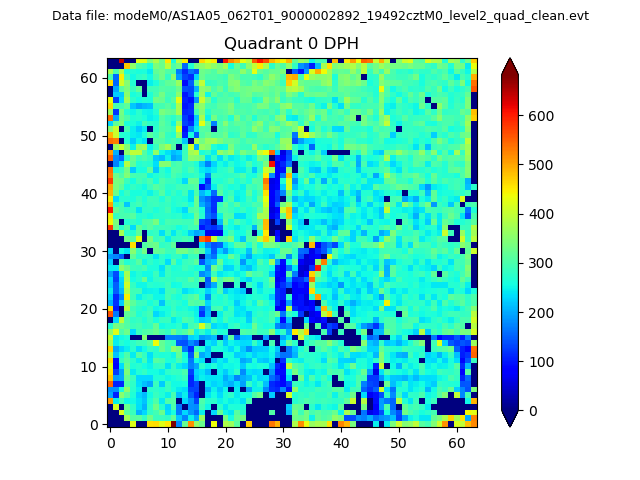 |
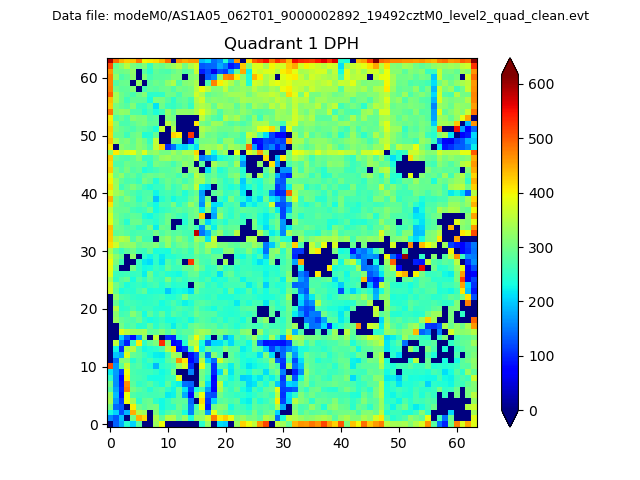 |
Quadrant B |
|---|---|---|---|
| Quadrant D | 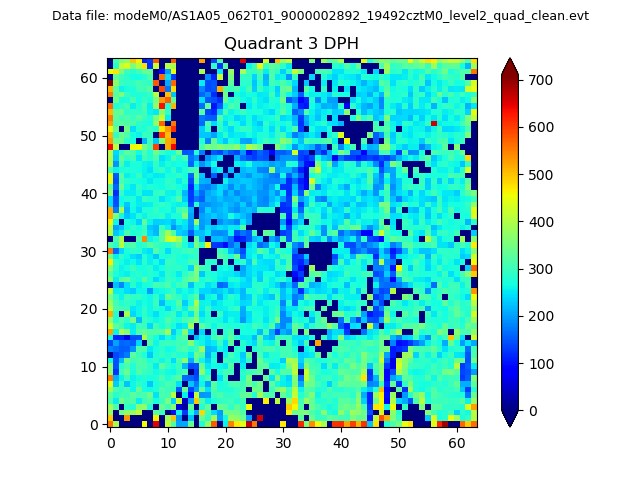 |
 |
Quadrant C |
| Plot type | Count rate plots | Images |
|---|---|---|
| Comparison with Poisson distribution Blue bars denote a histogram of data divided into 1 sec bins. Red curve is a Poisson curve with rate = median count rate of data. |
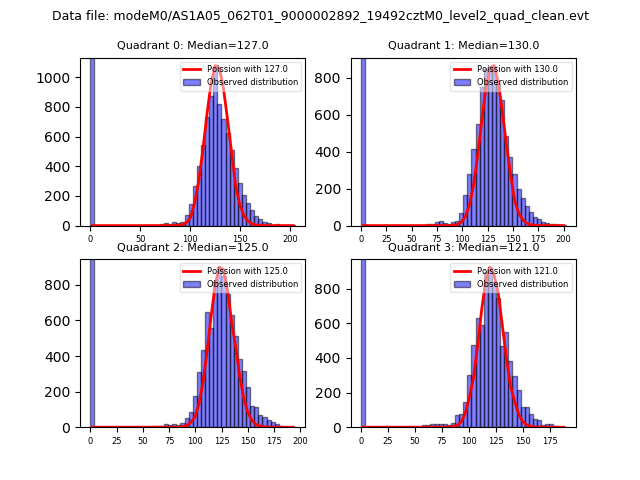 |
 |
| Quadrant-wise count rates Data is divided into 100 sec bins |
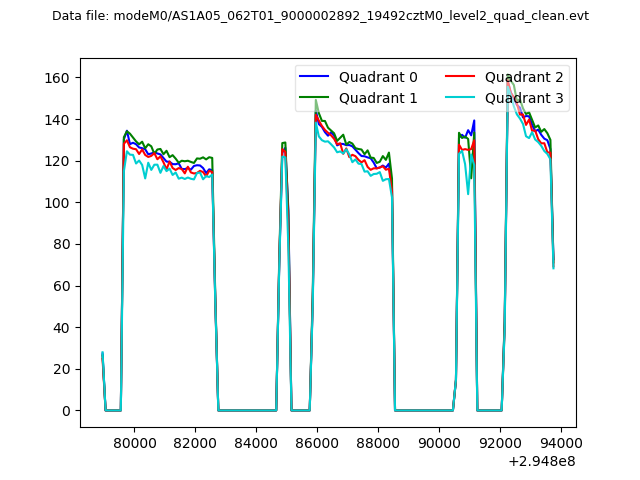 |
|
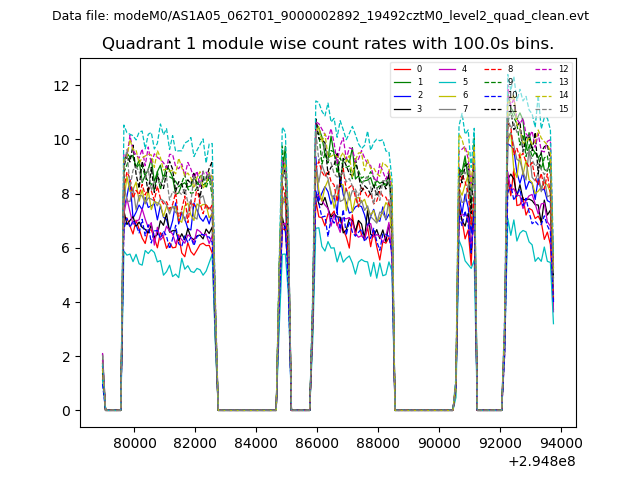
| Module-wise count rates for Quadrant A Data is divided into 100 sec bins |
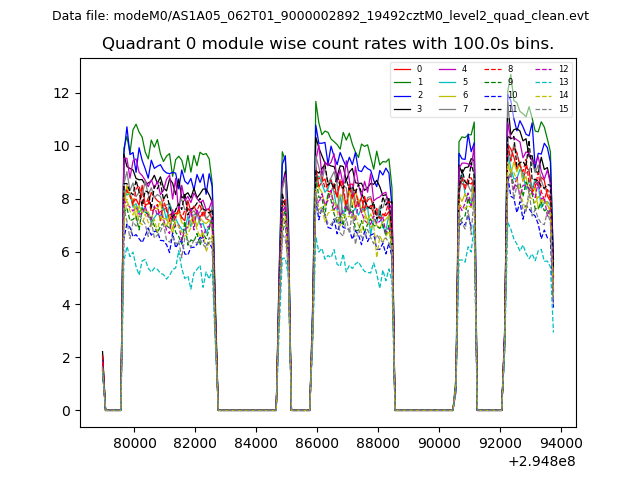 |
 |
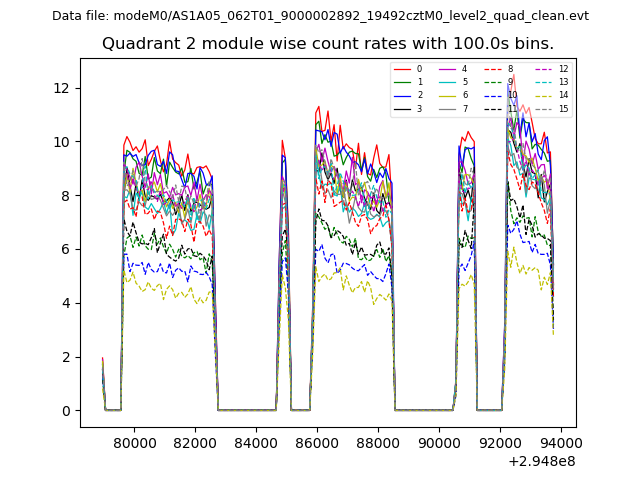
| Module-wise count rates for Quadrant B Data is divided into 100 sec bins |
 |
 |
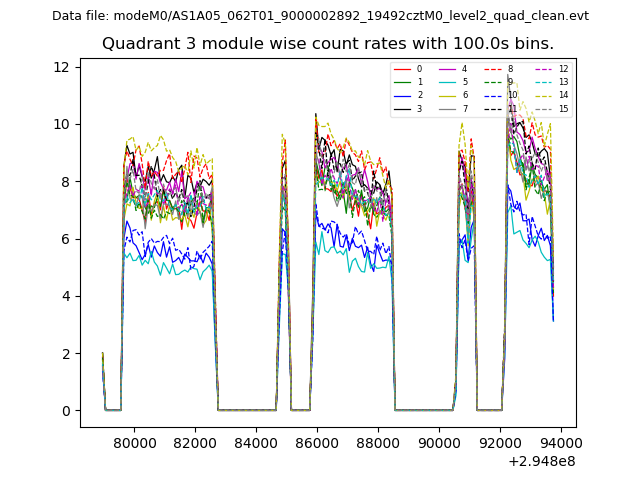
| Module-wise count rates for Quadrant C Data is divided into 100 sec bins |
 |
 |
| Module-wise count rates for Quadrant D Data is divided into 100 sec bins |
 |
 |
| Parameter | Plot |
|---|---|
| CZT HV Monitor | 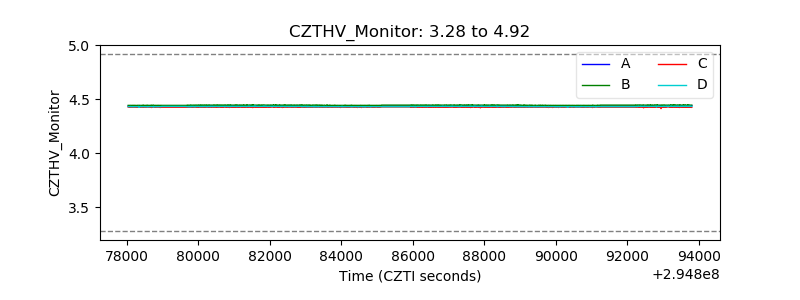 |
| D_VDD | 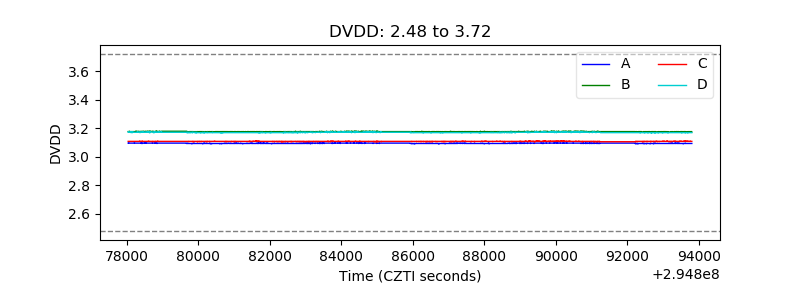 |
| Temperature 1 |  |
| Veto HV Monitor | 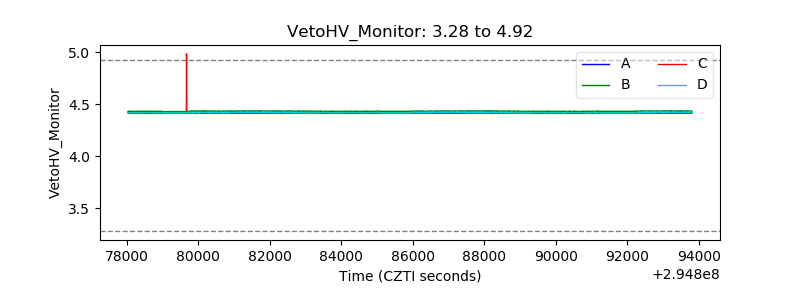 |
| Veto LLD | 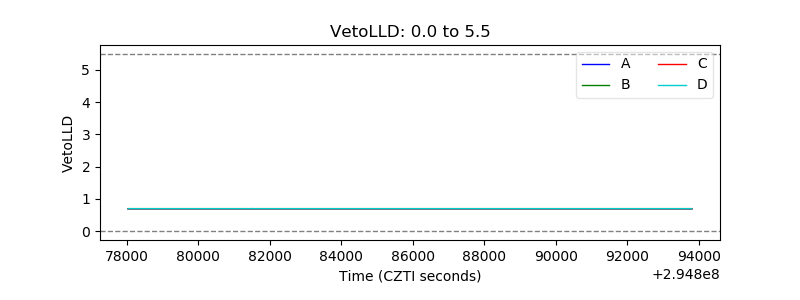 |
| Alpha Counter | 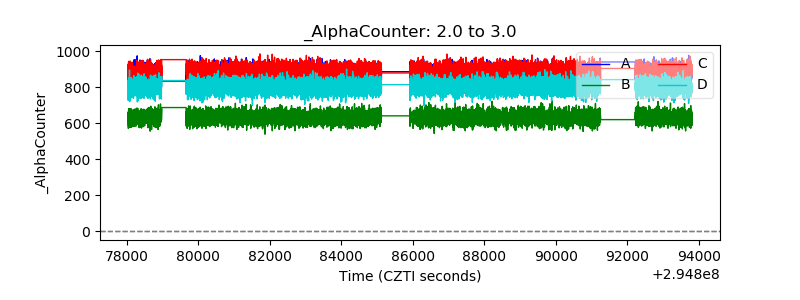 |
| _CPM_Rate | 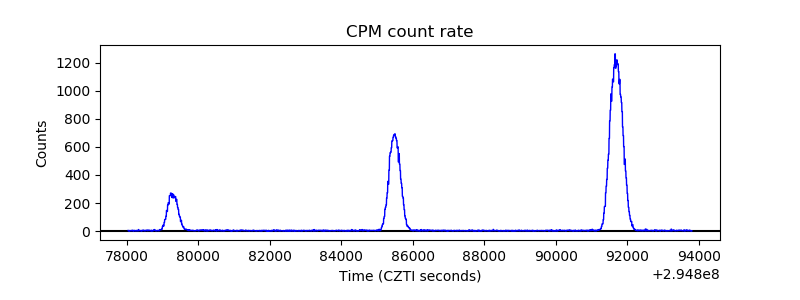 |
| CZT Counter | 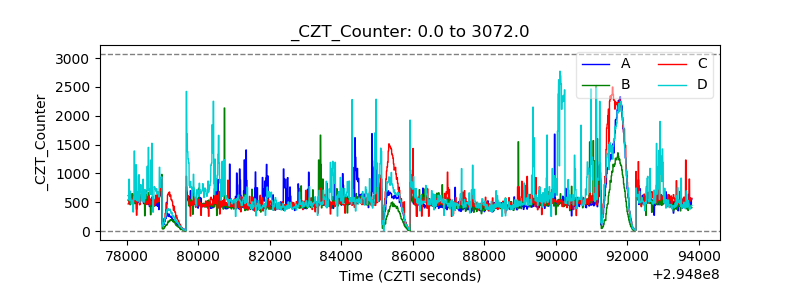 |
| +2.5 Volts monitor |  |
| +5 Volts monitor |  |
| _ROLL_ROT | 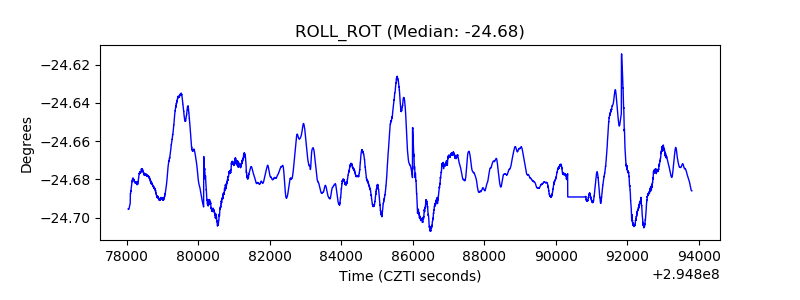 |
| _Roll_DEC | 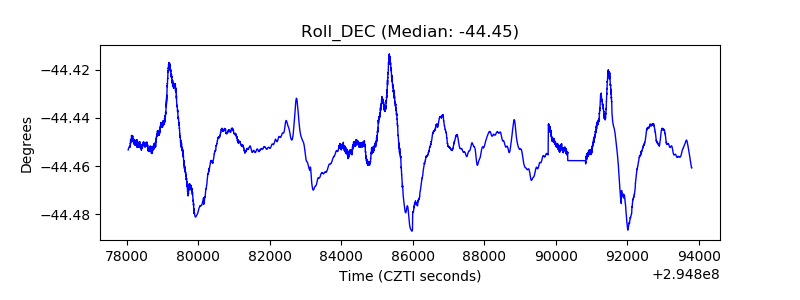 |
| _Roll_RA |  |
| Veto Counter | 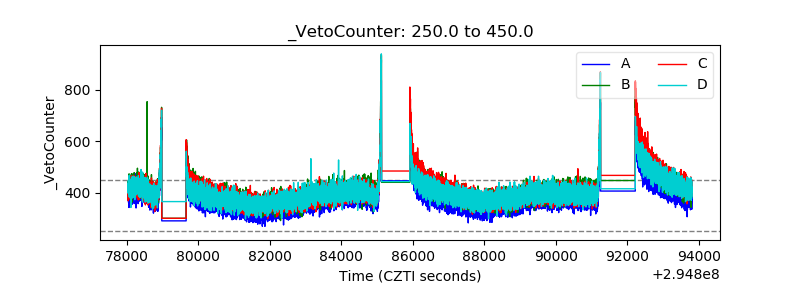 |