| Param | Original file | Final file |
|---|---|---|
| Filename | modeM0/AS1A05_062T01_9000002892_19494cztM0_level2.evt | modeM0/AS1A05_062T01_9000002892_19494cztM0_level2_quad_clean.evt |
| Size (bytes) | 510,024,960 | 96,554,880 |
| Size | 486.4 MB | 92.1 MB |
| Events in quadrant A | 3,277,041 | 625,632 |
| Events in quadrant B | 3,357,328 | 636,519 |
| Events in quadrant C | 3,748,795 | 612,534 |
| Events in quadrant D | 4,621,858 | 595,729 |
| Mode M9 | |||
|---|---|---|---|
| Quadrant | BADHDUFLAG | Total packets | Discarded packets |
| A | 0 | 13 | 0 |
| B | 0 | 14 | 0 |
| C | 0 | 14 | 0 |
| D | 0 | 14 | 0 |
| Mode SS | |||
|---|---|---|---|
| Quadrant | BADHDUFLAG | Total packets | Discarded packets |
| A | 0 | 132 | 0 |
| B | 0 | 132 | 0 |
| C | 0 | 132 | 0 |
| D | 0 | 132 | 0 |
| Mode M0 | |||
|---|---|---|---|
| Quadrant | BADHDUFLAG | Total packets | Discarded packets |
| A | 0 | 13728 | 2 |
| B | 0 | 13979 | 2 |
| C | 0 | 15192 | 2 |
| D | 0 | 17961 | 2 |
| Quadrant | Total seconds | Saturated seconds | Saturation percentage |
|---|---|---|---|
| A | 6505 | 35 | 0.538048% |
| B | 6505 | 74 | 1.137586% |
| C | 6505 | 114 | 1.752498% |
| D | 6505 | 267 | 4.104535% |
Noise dominated data is calculated using 1-second bins in cleaned event files. If a bin has >2000 counts, and if more than 50% of those come from <1% of pixels, then it is considered to be noise-dominated and hence unusable.
| Quadrant | # 1 sec bins | Bins with >0 counts | Bins with >2000 counts | High rate bins dominated by noise | Noise dominated (total time) | Noise dominated (detector-on time) | Marked lightcurve |
|---|---|---|---|---|---|---|---|
| A | 7600 | 6505 | 1 | 1 | 0.01% | 0.02% | 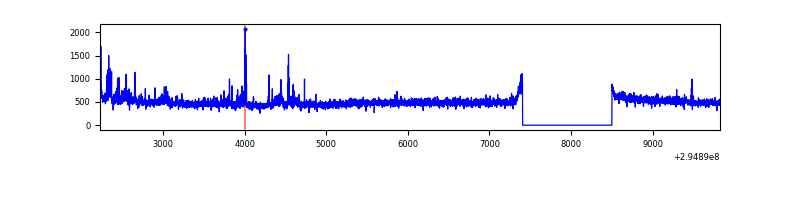 |
| B | 7600 | 6505 | 23 | 23 | 0.30% | 0.35% | 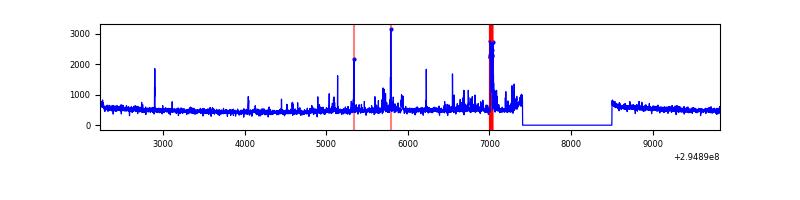 |
| C | 7600 | 6505 | 27 | 27 | 0.36% | 0.42% | 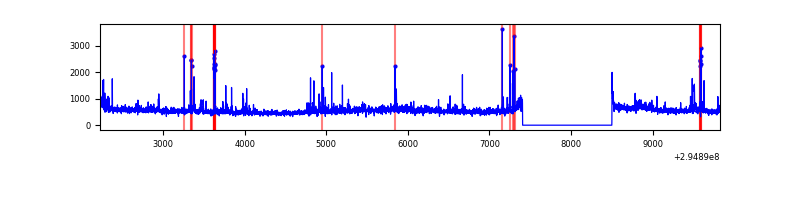 |
| D | 7600 | 6505 | 229 | 229 | 3.01% | 3.52% | 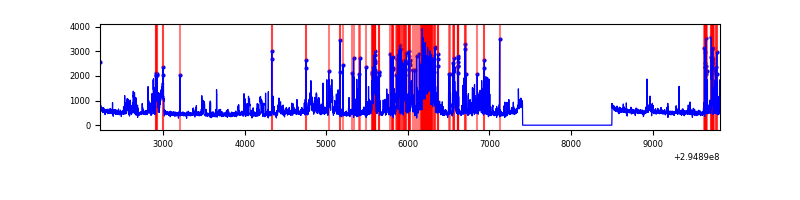 |
Top three noisy pixels from each quadrant. If the there are fewer than three noisy pixels in the level2.evt file, extra rows are filled as -1
| Pixel properties | Quadrant properties | ||||||
|---|---|---|---|---|---|---|---|
| Quadrant | DetID | PixID | Counts | Sigma | Mean | Median | Sigma |
| A | 10 | 253 | 137783 | 837.39 | 812 | 796 | 163.6 |
| A | 0 | 226 | 6930 | 37.5 | 812 | 796 | 163.6 |
| A | 13 | 254 | 6761 | 36.46 | 812 | 796 | 163.6 |
| B | 7 | 220 | 81364 | 526.02 | 808 | 789 | 153.2 |
| B | 4 | 171 | 46867 | 300.81 | 808 | 789 | 153.2 |
| B | 0 | 190 | 27212 | 172.5 | 808 | 789 | 153.2 |
| C | 5 | 112 | 211044 | 1140.14 | 790 | 797 | 184.4 |
| C | 9 | 221 | 203220 | 1097.71 | 790 | 797 | 184.4 |
| C | 3 | 233 | 123370 | 664.7 | 790 | 797 | 184.4 |
| D | 1 | 52 | 1075660 | 5632.44 | 792 | 773 | 190.8 |
| D | 7 | 238 | 373927 | 1955.34 | 792 | 773 | 190.8 |
| D | 12 | 218 | 133024 | 693.0 | 792 | 773 | 190.8 |
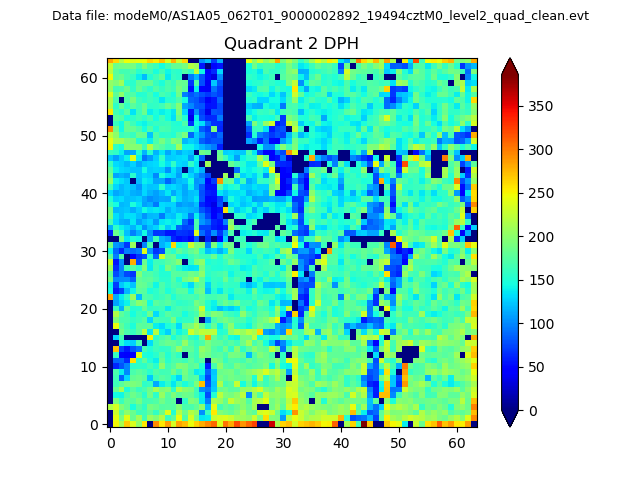
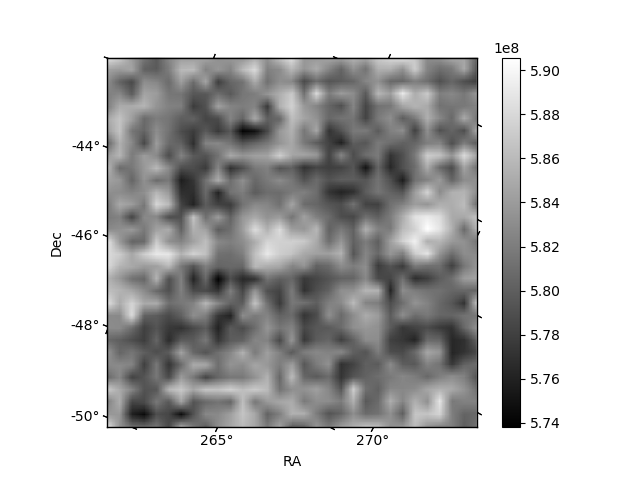
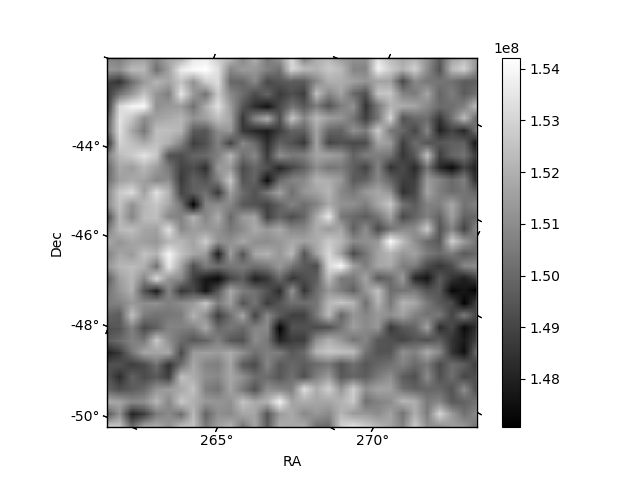
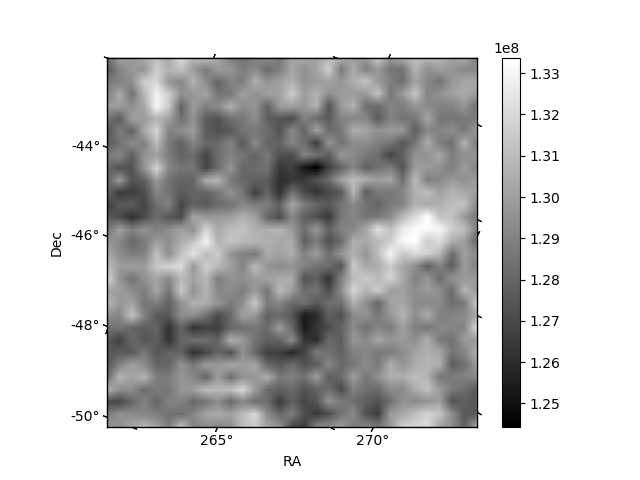
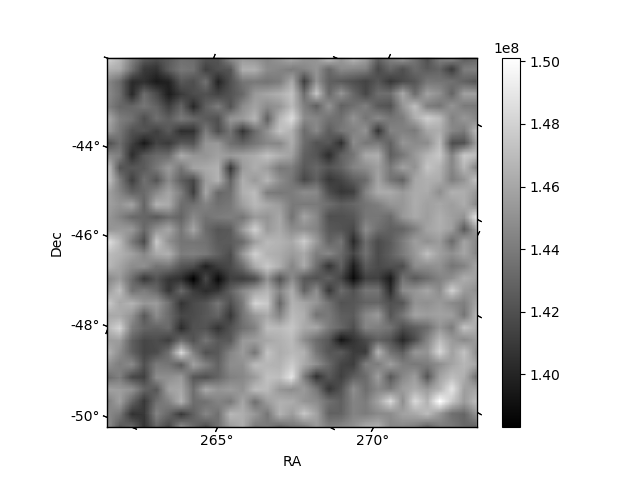
Histogram calculated using DETX and DETY for each event in the final _common_clean file
| Quadrant A | 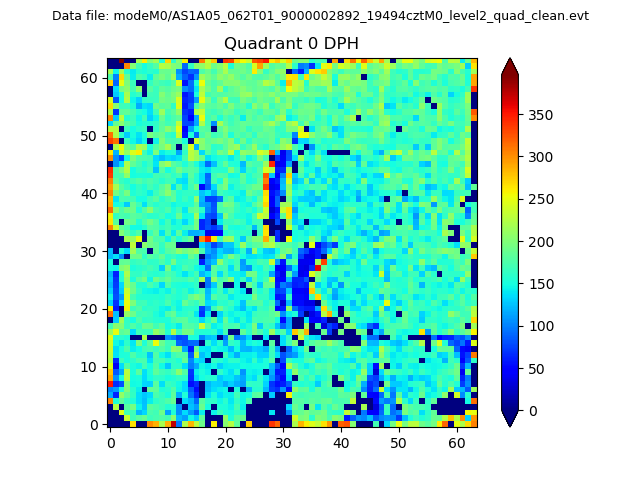 |
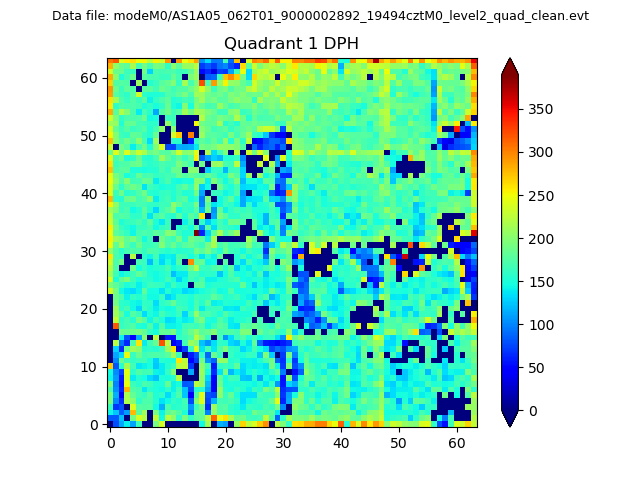 |
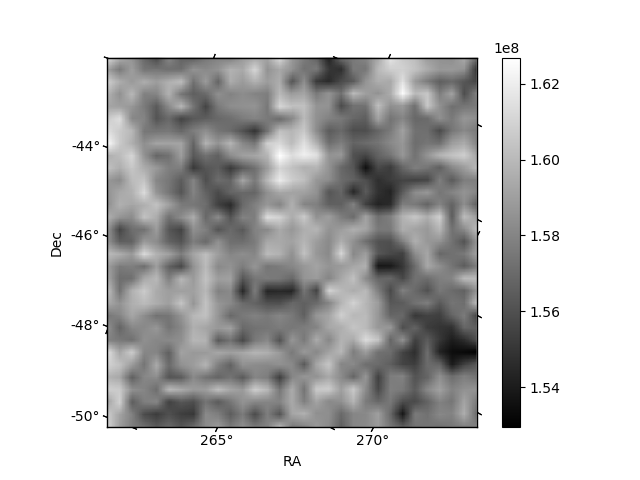
Quadrant B |
|---|---|---|---|
| Quadrant D | 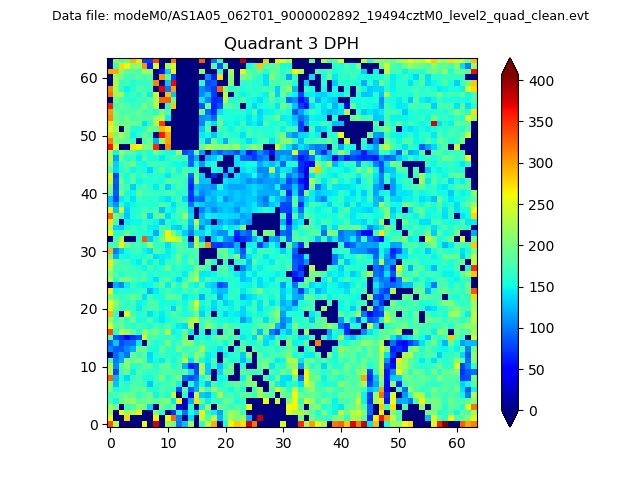 |
 |
Quadrant C |
| Plot type | Count rate plots | Images |
|---|---|---|
| Comparison with Poisson distribution Blue bars denote a histogram of data divided into 1 sec bins. Red curve is a Poisson curve with rate = median count rate of data. |
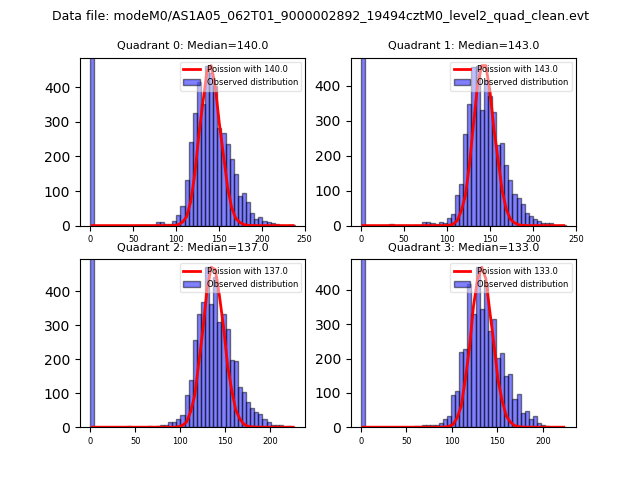 |
 |
| Quadrant-wise count rates Data is divided into 100 sec bins |
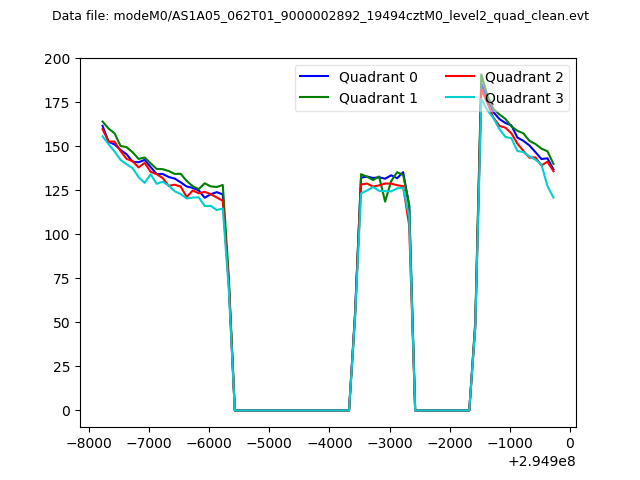 |
|
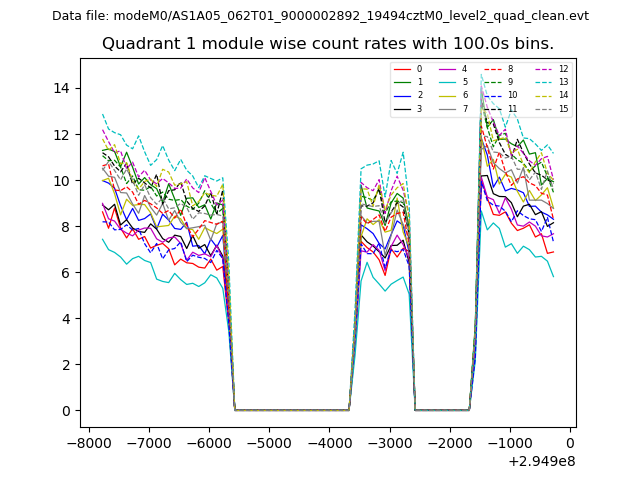
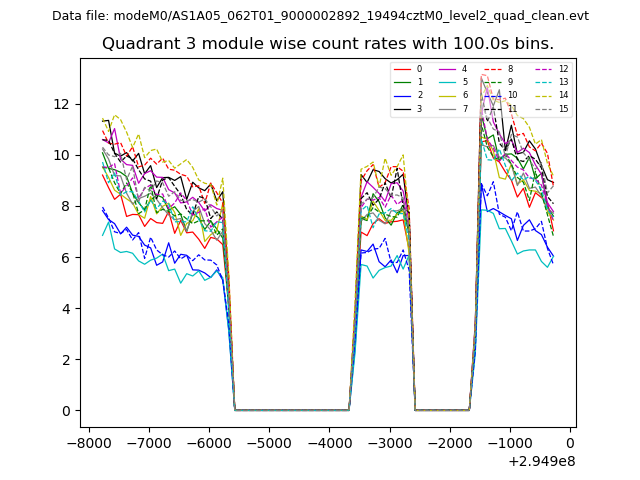
| Module-wise count rates for Quadrant A Data is divided into 100 sec bins |
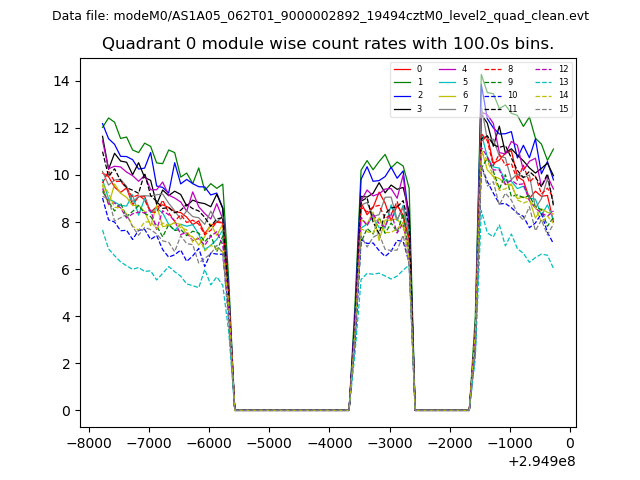 |
 |
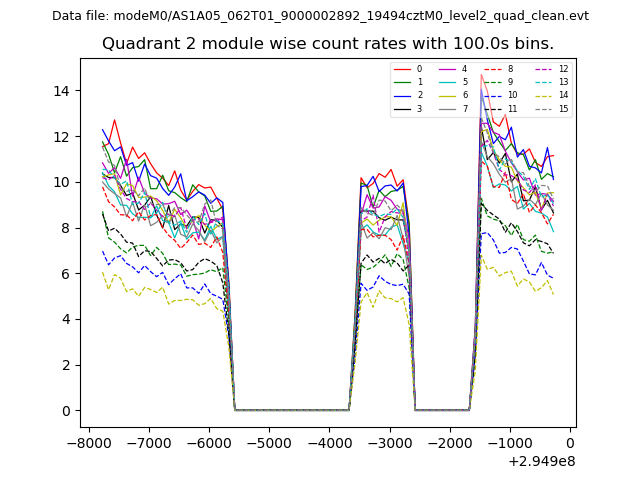
| Module-wise count rates for Quadrant B Data is divided into 100 sec bins |
 |
 |
| Module-wise count rates for Quadrant C Data is divided into 100 sec bins |
 |
 |
| Module-wise count rates for Quadrant D Data is divided into 100 sec bins |
 |
 |
| Parameter | Plot |
|---|---|
| CZT HV Monitor | 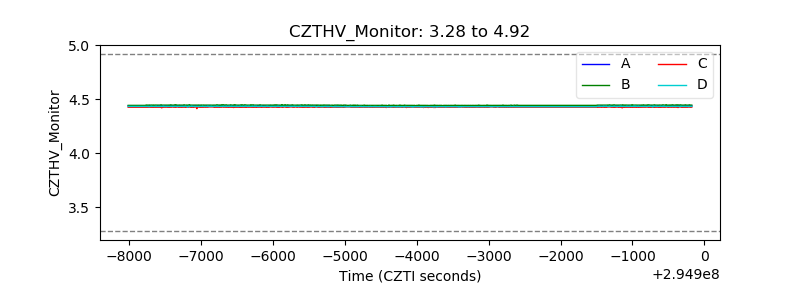 |
| D_VDD | 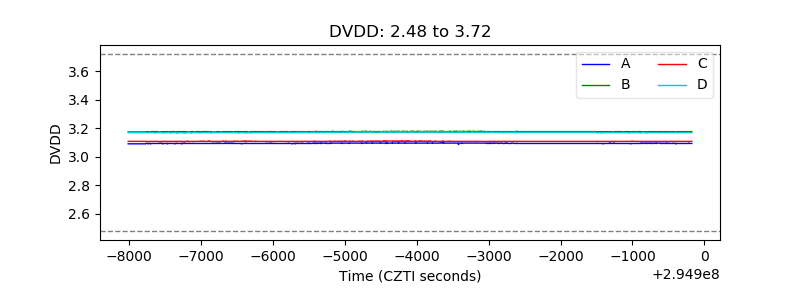 |
| Temperature 1 | 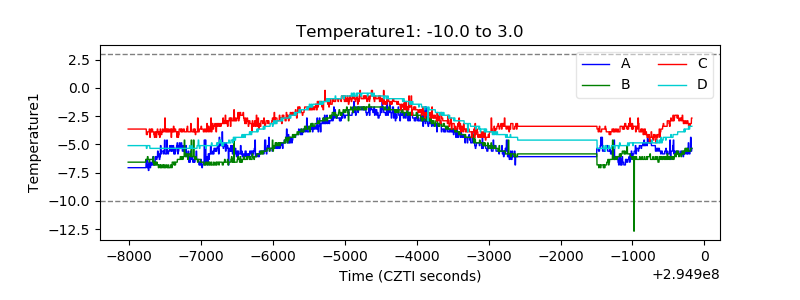 |
| Veto HV Monitor |  |
| Veto LLD | 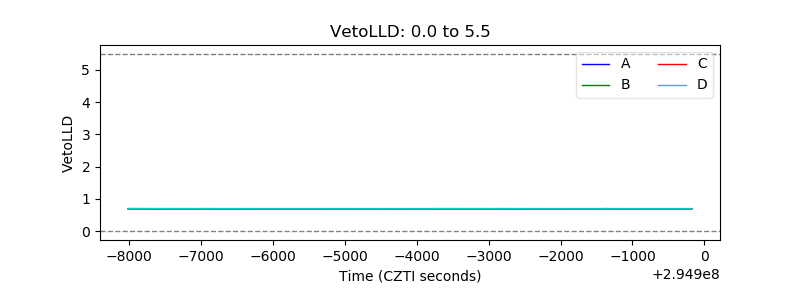 |
| Alpha Counter |  |
| _CPM_Rate |  |
| CZT Counter | 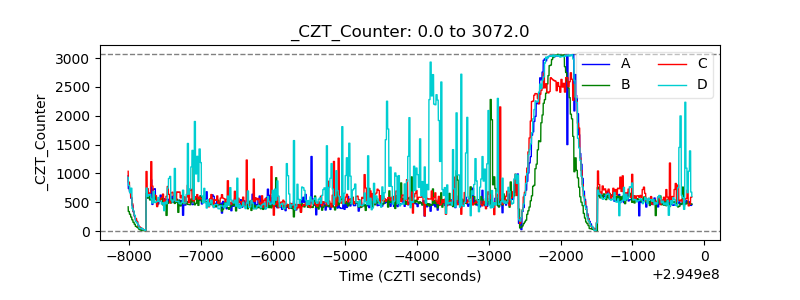 |
| +2.5 Volts monitor |  |
| +5 Volts monitor |  |
| _ROLL_ROT | 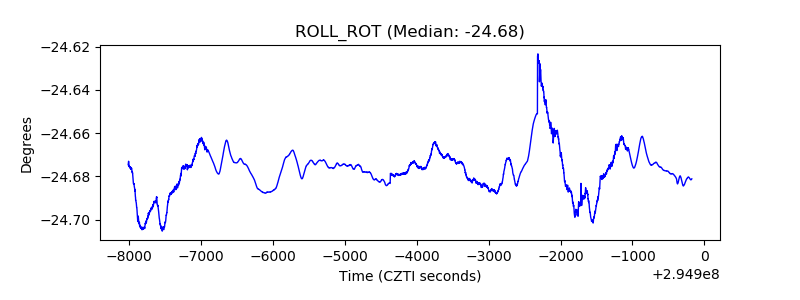 |
| _Roll_DEC | 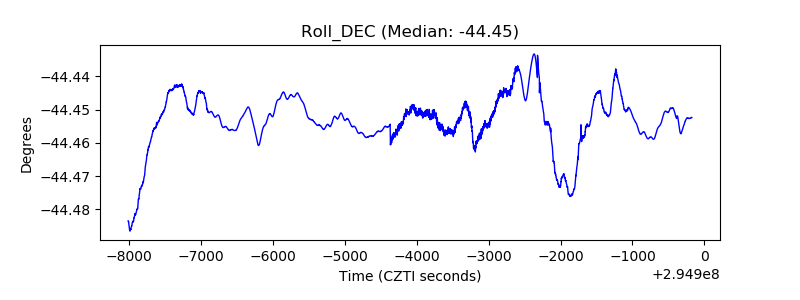 |
| _Roll_RA | 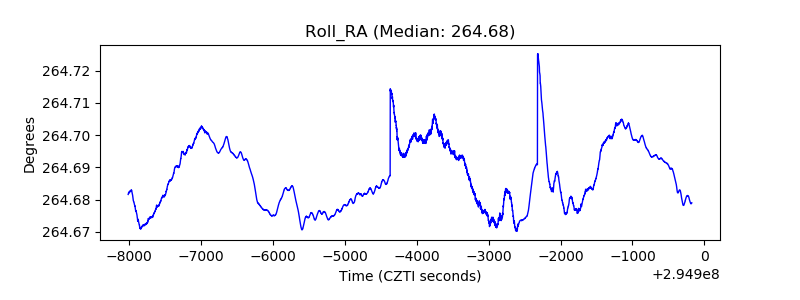 |
| Veto Counter | 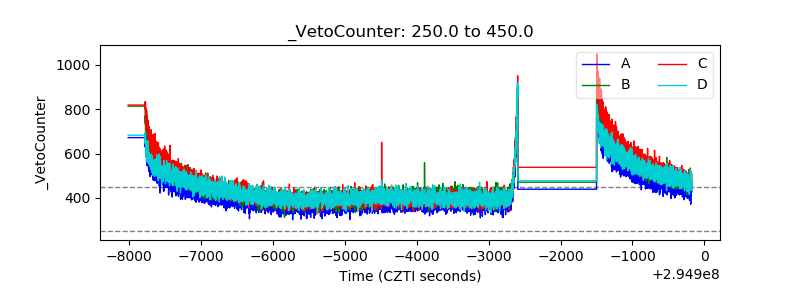 |