| Param | Original file | Final file |
|---|---|---|
| Filename | modeM0/AS1A05_062T01_9000002892_19495cztM0_level2.evt | modeM0/AS1A05_062T01_9000002892_19495cztM0_level2_quad_clean.evt |
| Size (bytes) | 519,117,120 | 99,567,360 |
| Size | 495.1 MB | 95.0 MB |
| Events in quadrant A | 3,325,254 | 654,454 |
| Events in quadrant B | 3,405,561 | 665,471 |
| Events in quadrant C | 3,757,701 | 638,410 |
| Events in quadrant D | 4,803,188 | 614,453 |
| Mode M9 | |||
|---|---|---|---|
| Quadrant | BADHDUFLAG | Total packets | Discarded packets |
| A | 0 | 16 | 0 |
| B | 0 | 17 | 0 |
| C | 0 | 17 | 0 |
| D | 0 | 17 | 0 |
| Mode SS | |||
|---|---|---|---|
| Quadrant | BADHDUFLAG | Total packets | Discarded packets |
| A | 0 | 128 | 0 |
| B | 0 | 128 | 0 |
| C | 0 | 128 | 0 |
| D | 0 | 128 | 0 |
| Mode M0 | |||
|---|---|---|---|
| Quadrant | BADHDUFLAG | Total packets | Discarded packets |
| A | 0 | 13739 | 2 |
| B | 0 | 13990 | 2 |
| C | 0 | 15100 | 2 |
| D | 0 | 18423 | 2 |
| Quadrant | Total seconds | Saturated seconds | Saturation percentage |
|---|---|---|---|
| A | 6345 | 34 | 0.535855% |
| B | 6344 | 55 | 0.866961% |
| C | 6344 | 108 | 1.702396% |
| D | 6344 | 242 | 3.814628% |
Noise dominated data is calculated using 1-second bins in cleaned event files. If a bin has >2000 counts, and if more than 50% of those come from <1% of pixels, then it is considered to be noise-dominated and hence unusable.
| Quadrant | # 1 sec bins | Bins with >0 counts | Bins with >2000 counts | High rate bins dominated by noise | Noise dominated (total time) | Noise dominated (detector-on time) | Marked lightcurve |
|---|---|---|---|---|---|---|---|
| A | 7545 | 6345 | 0 | 0 | 0.00% | 0.00% | 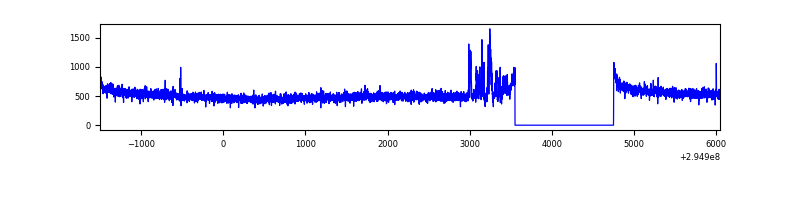 |
| B | 7544 | 6345 | 22 | 22 | 0.29% | 0.35% | 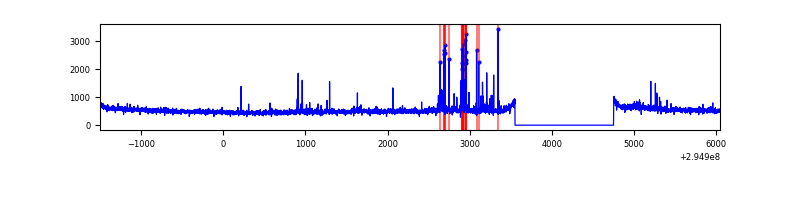 |
| C | 7544 | 6345 | 18 | 18 | 0.24% | 0.28% | 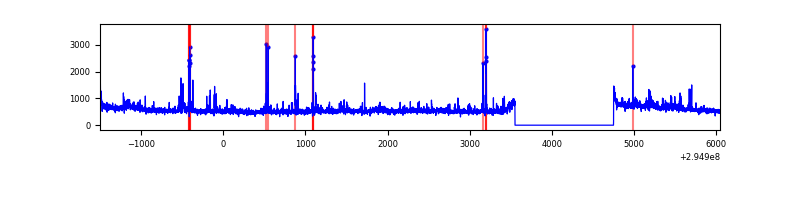 |
| D | 7544 | 6345 | 208 | 208 | 2.76% | 3.28% | 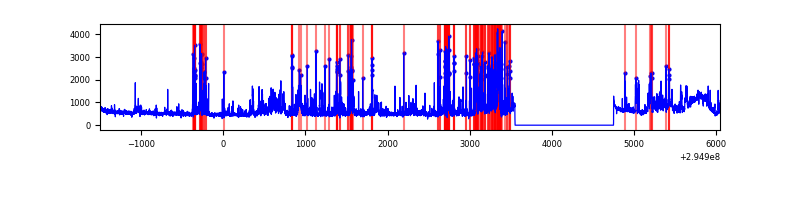 |
Top three noisy pixels from each quadrant. If the there are fewer than three noisy pixels in the level2.evt file, extra rows are filled as -1
| Pixel properties | Quadrant properties | ||||||
|---|---|---|---|---|---|---|---|
| Quadrant | DetID | PixID | Counts | Sigma | Mean | Median | Sigma |
| A | 10 | 253 | 98453 | 588.47 | 830 | 814 | 165.9 |
| A | 11 | 29 | 21649 | 125.57 | 830 | 814 | 165.9 |
| A | 0 | 226 | 7330 | 39.27 | 830 | 814 | 165.9 |
| B | 7 | 220 | 87618 | 566.42 | 822 | 803 | 153.3 |
| B | 4 | 171 | 30553 | 194.1 | 822 | 803 | 153.3 |
| B | 0 | 244 | 25680 | 162.31 | 822 | 803 | 153.3 |
| C | 9 | 221 | 208039 | 1119.16 | 804 | 815 | 185.2 |
| C | 5 | 112 | 151141 | 811.87 | 804 | 815 | 185.2 |
| C | 14 | 238 | 126435 | 678.44 | 804 | 815 | 185.2 |
| D | 7 | 238 | 1062632 | 5391.1 | 810 | 786 | 197.0 |
| D | 1 | 52 | 354723 | 1796.97 | 810 | 786 | 197.0 |
| D | 12 | 218 | 205258 | 1038.13 | 810 | 786 | 197.0 |
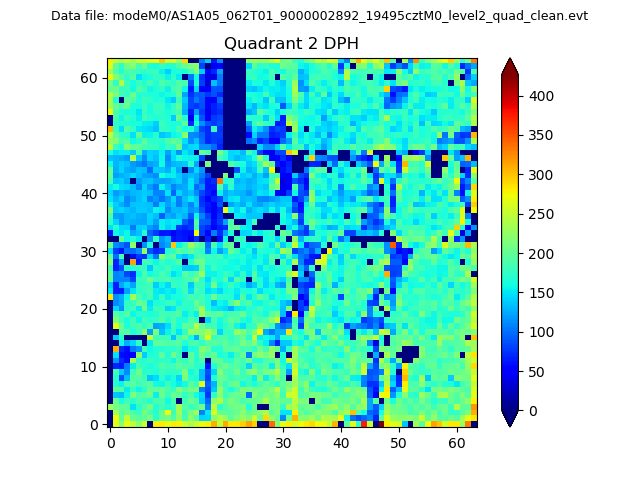
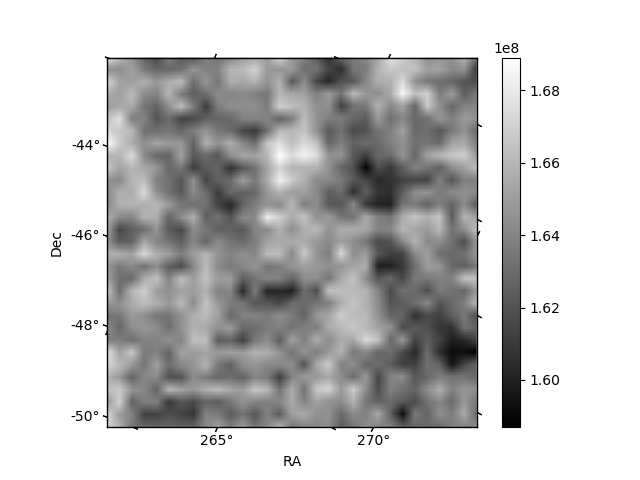
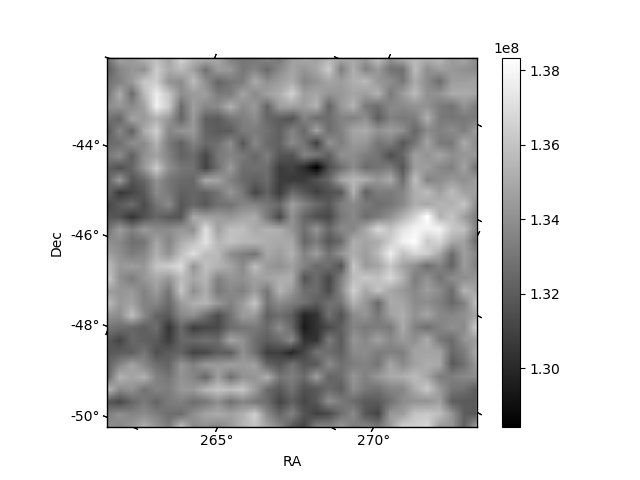
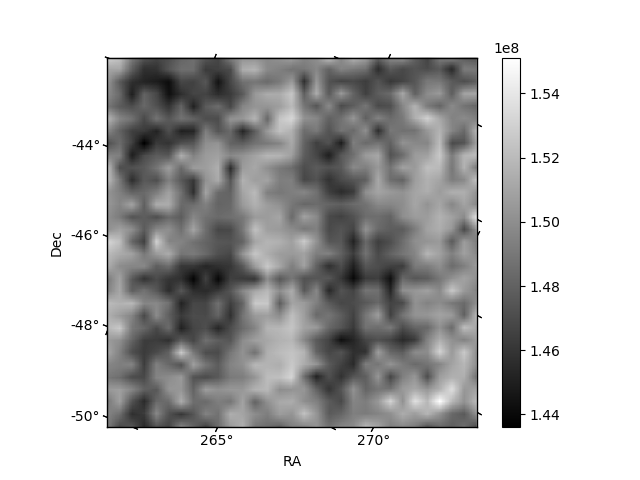
Histogram calculated using DETX and DETY for each event in the final _common_clean file
| Quadrant A | 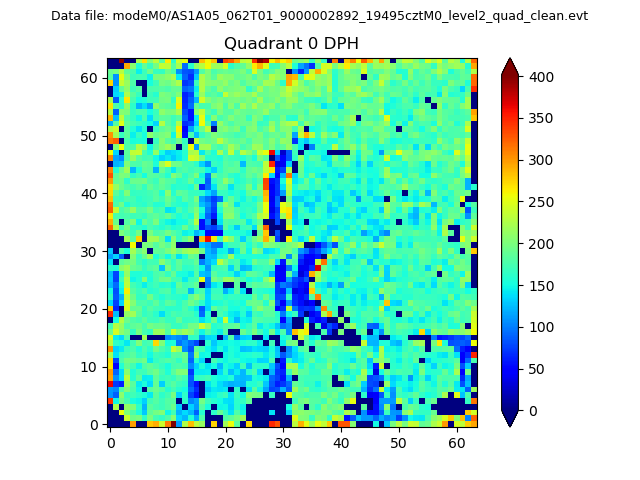 |
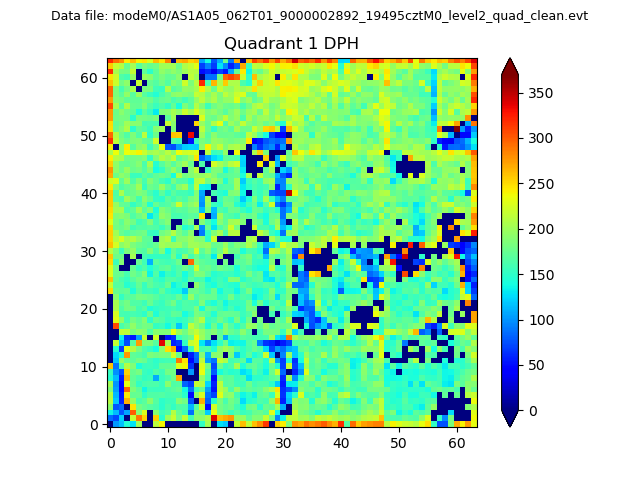 |
Quadrant B |
|---|---|---|---|
| Quadrant D | 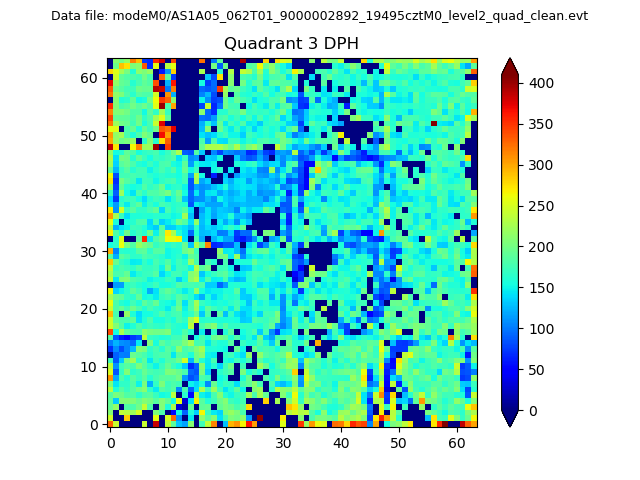 |
 |
Quadrant C |
| Plot type | Count rate plots | Images |
|---|---|---|
| Comparison with Poisson distribution Blue bars denote a histogram of data divided into 1 sec bins. Red curve is a Poisson curve with rate = median count rate of data. |
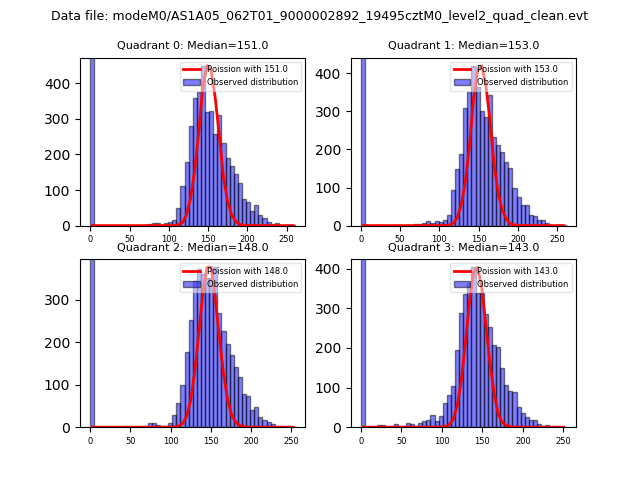 |
 |
| Quadrant-wise count rates Data is divided into 100 sec bins |
 |
|
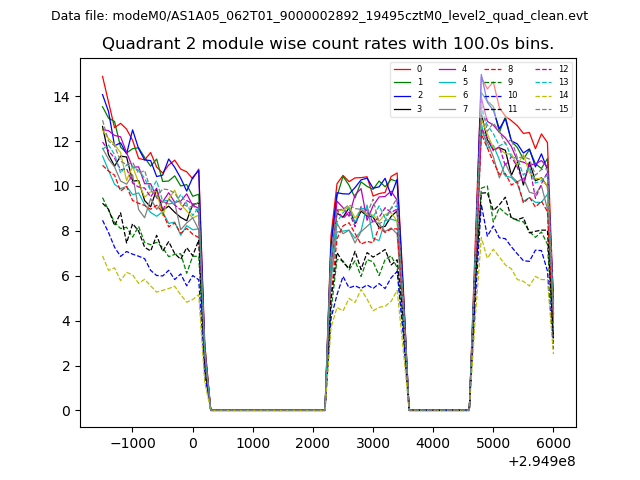
| Module-wise count rates for Quadrant A Data is divided into 100 sec bins |
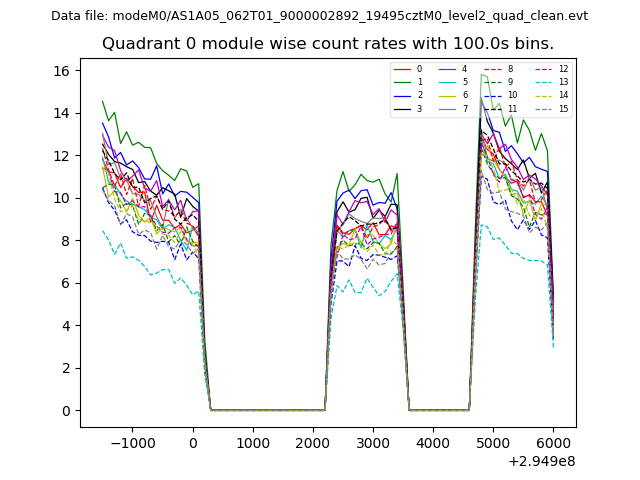 |
 |
| Module-wise count rates for Quadrant B Data is divided into 100 sec bins |
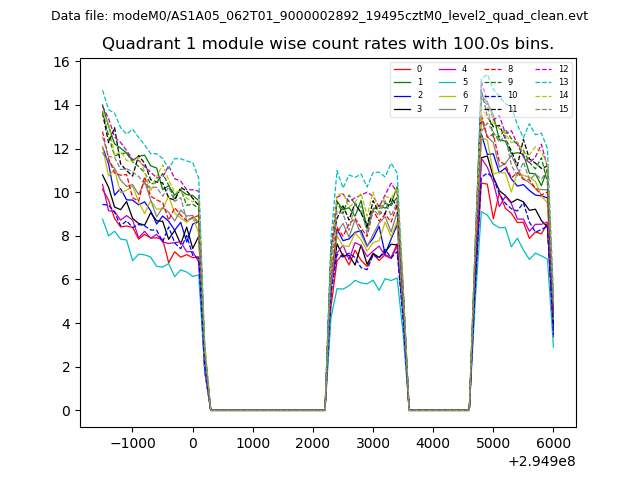 |
 |
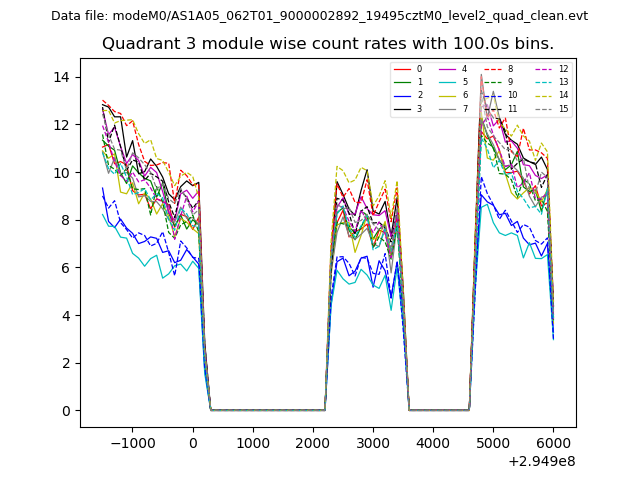
| Module-wise count rates for Quadrant C Data is divided into 100 sec bins |
 |
 |
| Module-wise count rates for Quadrant D Data is divided into 100 sec bins |
 |
 |
| Parameter | Plot |
|---|---|
| CZT HV Monitor |  |
| D_VDD | 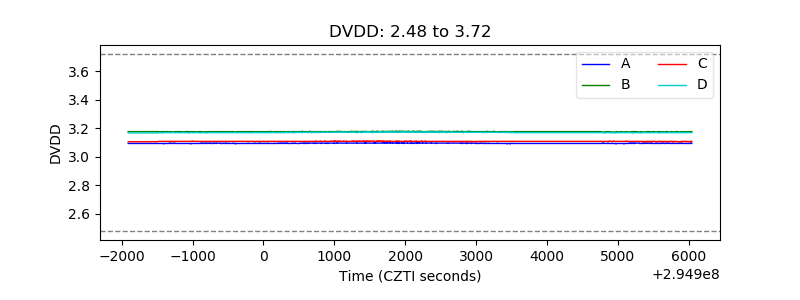 |
| Temperature 1 |  |
| Veto HV Monitor | 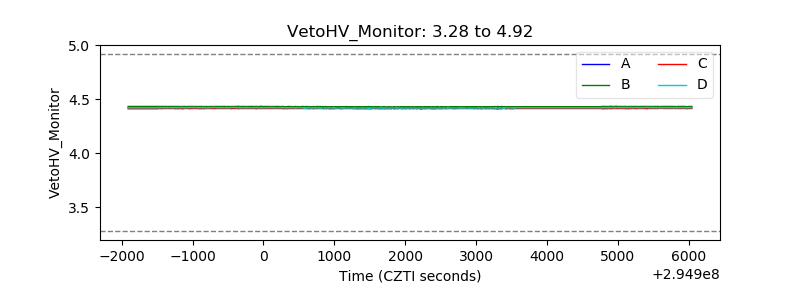 |
| Veto LLD | 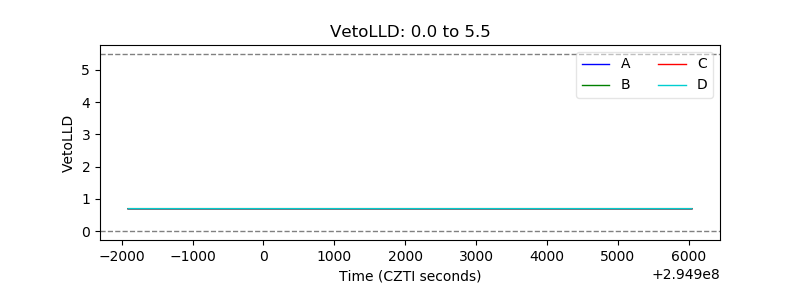 |
| Alpha Counter | 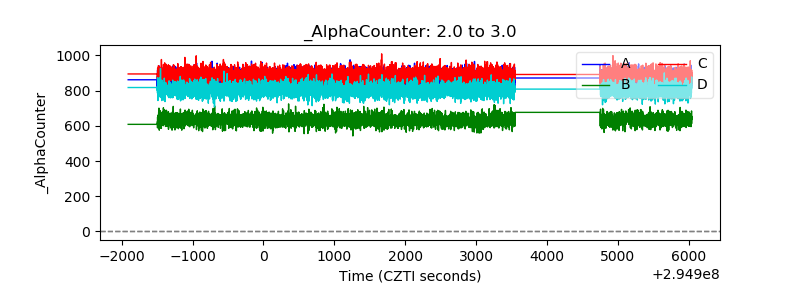 |
| _CPM_Rate | 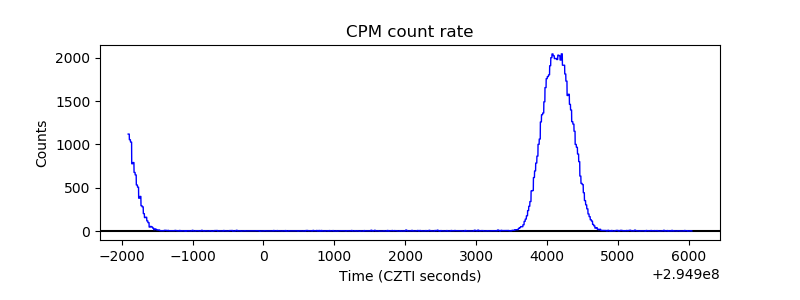 |
| CZT Counter |  |
| +2.5 Volts monitor |  |
| +5 Volts monitor |  |
| _ROLL_ROT | 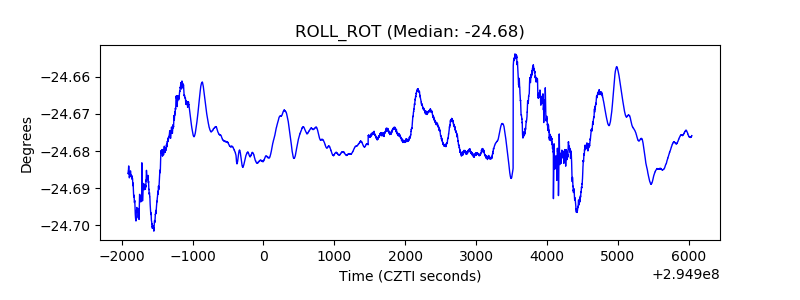 |
| _Roll_DEC | 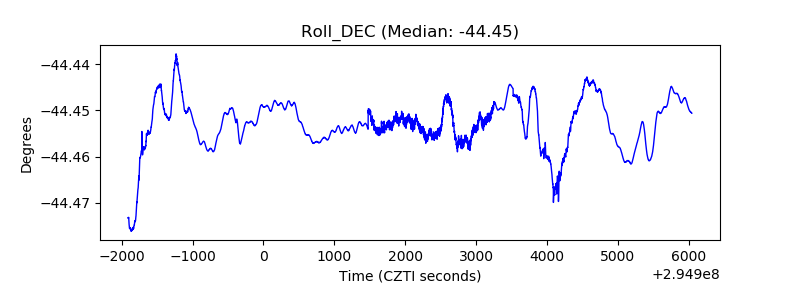 |
| _Roll_RA |  |
| Veto Counter | 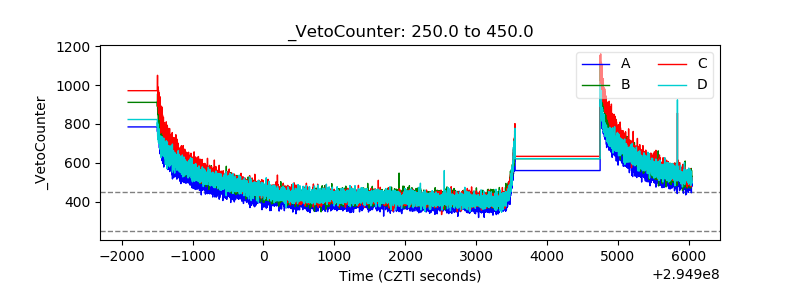 |