| Param | Original file | Final file |
|---|---|---|
| Filename | modeM0/AS1A05_062T01_9000002892_19496cztM0_level2.evt | modeM0/AS1A05_062T01_9000002892_19496cztM0_level2_quad_clean.evt |
| Size (bytes) | 383,218,560 | 65,612,160 |
| Size | 365.5 MB | 62.6 MB |
| Events in quadrant A | 2,492,104 | 422,385 |
| Events in quadrant B | 2,664,271 | 429,402 |
| Events in quadrant C | 2,994,421 | 403,400 |
| Events in quadrant D | 3,128,599 | 394,755 |
| Mode M9 | |||
|---|---|---|---|
| Quadrant | BADHDUFLAG | Total packets | Discarded packets |
| A | 0 | 12 | 3 |
| B | 0 | 12 | 3 |
| C | 0 | 11 | 2 |
| D | 0 | 12 | 3 |
| Mode SS | |||
|---|---|---|---|
| Quadrant | BADHDUFLAG | Total packets | Discarded packets |
| A | 0 | 108 | 12 |
| B | 0 | 105 | 9 |
| C | 0 | 107 | 7 |
| D | 0 | 106 | 10 |
| Mode M0 | |||
|---|---|---|---|
| Quadrant | BADHDUFLAG | Total packets | Discarded packets |
| A | 0 | 11384 | 1129 |
| B | 0 | 11857 | 1109 |
| C | 0 | 13243 | 1326 |
| D | 0 | 13693 | 1251 |
| Quadrant | Total seconds | Saturated seconds | Saturation percentage |
|---|---|---|---|
| A | 4800 | 40 | 0.833333% |
| B | 4811 | 76 | 1.579713% |
| C | 4796 | 107 | 2.231026% |
| D | 4793 | 81 | 1.689965% |
Noise dominated data is calculated using 1-second bins in cleaned event files. If a bin has >2000 counts, and if more than 50% of those come from <1% of pixels, then it is considered to be noise-dominated and hence unusable.
| Quadrant | # 1 sec bins | Bins with >0 counts | Bins with >2000 counts | High rate bins dominated by noise | Noise dominated (total time) | Noise dominated (detector-on time) | Marked lightcurve |
|---|---|---|---|---|---|---|---|
| A | 6937 | 4880 | 1 | 1 | 0.01% | 0.02% | 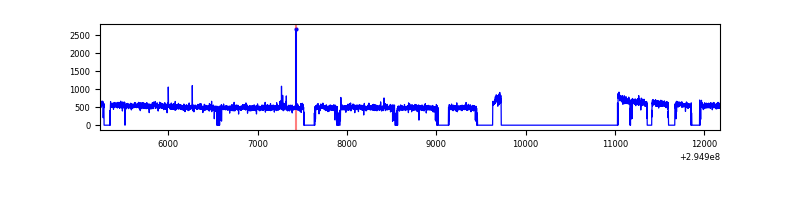 |
| B | 6937 | 4902 | 19 | 19 | 0.27% | 0.39% | 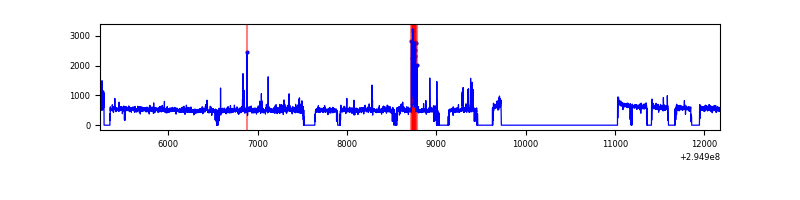 |
| C | 6937 | 4874 | 22 | 22 | 0.32% | 0.45% | 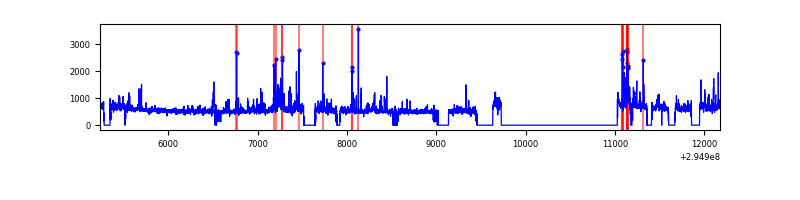 |
| D | 6937 | 4876 | 39 | 39 | 0.56% | 0.80% | 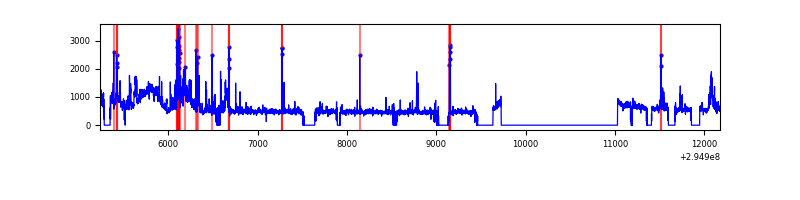 |
Top three noisy pixels from each quadrant. If the there are fewer than three noisy pixels in the level2.evt file, extra rows are filled as -1
| Pixel properties | Quadrant properties | ||||||
|---|---|---|---|---|---|---|---|
| Quadrant | DetID | PixID | Counts | Sigma | Mean | Median | Sigma |
| A | 5 | 16 | 8722 | 63.0 | 641 | 630 | 128.4 |
| A | 11 | 29 | 7453 | 53.12 | 641 | 630 | 128.4 |
| A | 13 | 254 | 6769 | 47.8 | 641 | 630 | 128.4 |
| B | 7 | 220 | 69669 | 582.86 | 630 | 616 | 118.5 |
| B | 0 | 189 | 46383 | 386.31 | 630 | 616 | 118.5 |
| B | 0 | 198 | 34835 | 288.83 | 630 | 616 | 118.5 |
| C | 5 | 112 | 239442 | 1692.88 | 611 | 615 | 141.1 |
| C | 9 | 221 | 216703 | 1531.7 | 611 | 615 | 141.1 |
| C | 14 | 238 | 97016 | 683.32 | 611 | 615 | 141.1 |
| D | 7 | 238 | 644784 | 4277.06 | 624 | 607 | 150.6 |
| D | 12 | 218 | 49987 | 327.86 | 624 | 607 | 150.6 |
| D | 1 | 52 | 32496 | 211.73 | 624 | 607 | 150.6 |
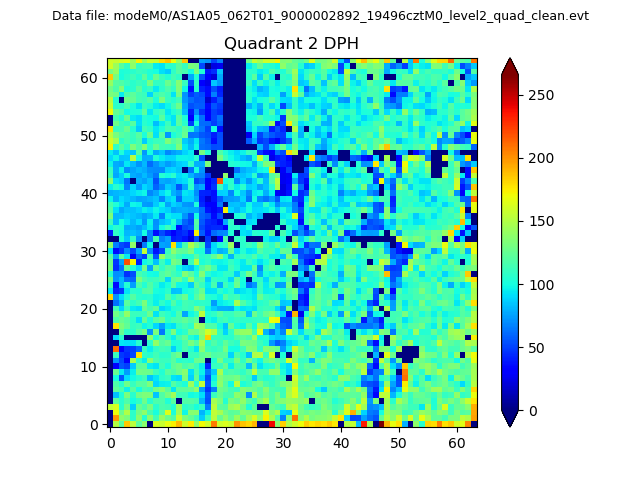
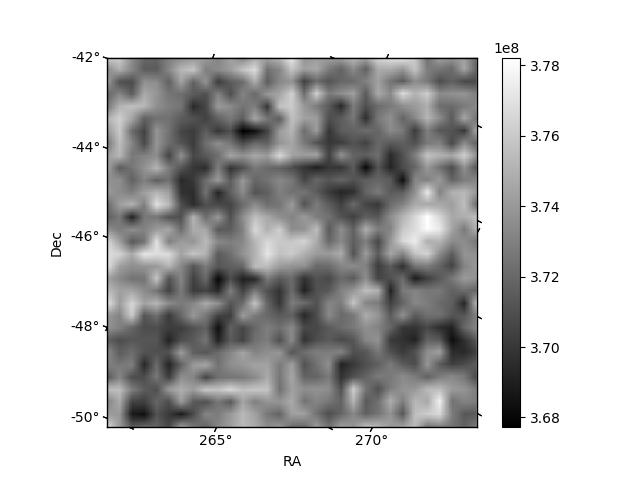
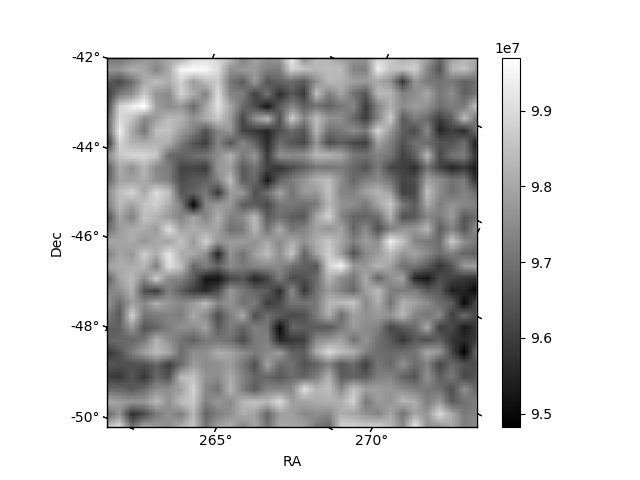
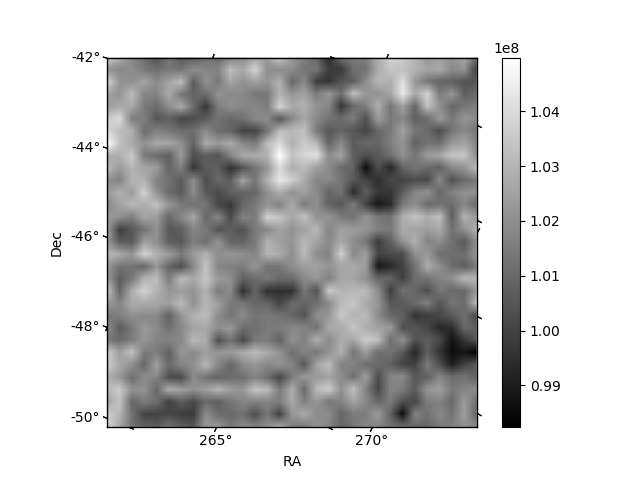
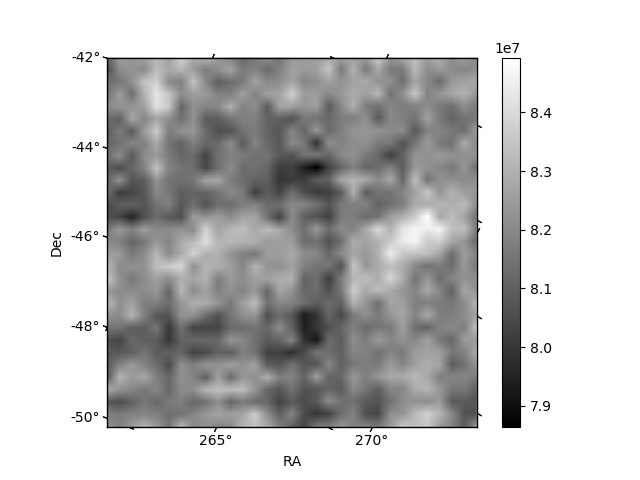
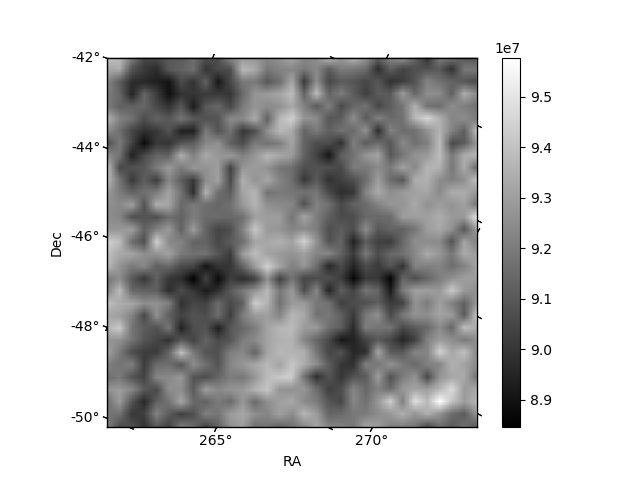
Histogram calculated using DETX and DETY for each event in the final _common_clean file
| Quadrant A | 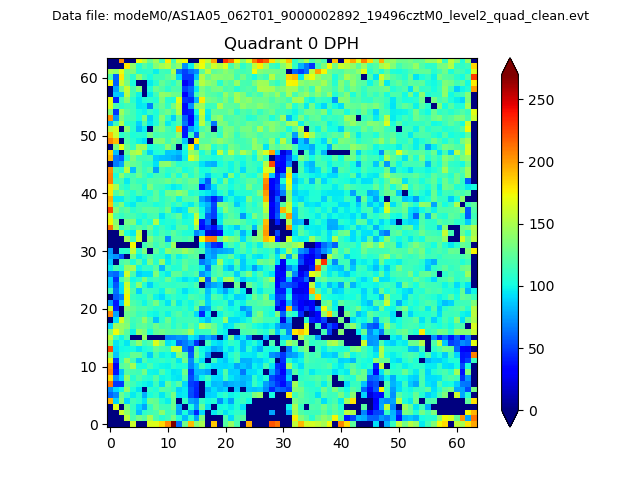 |
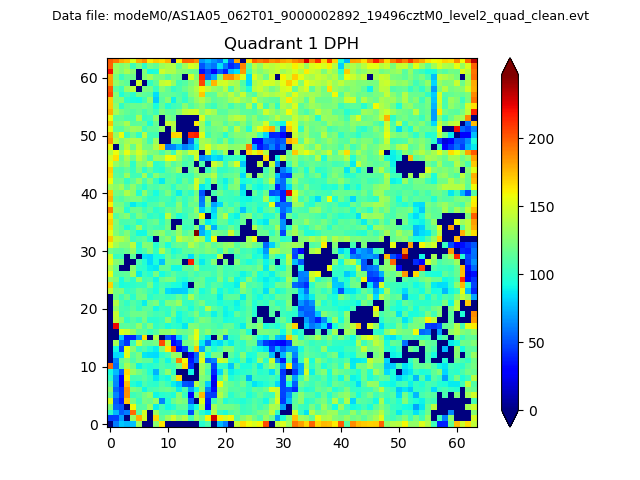 |
Quadrant B |
|---|---|---|---|
| Quadrant D | 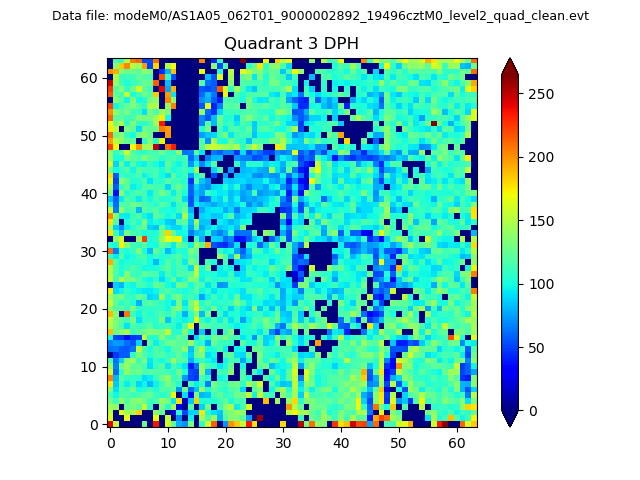 |
 |
Quadrant C |
| Plot type | Count rate plots | Images |
|---|---|---|
| Comparison with Poisson distribution Blue bars denote a histogram of data divided into 1 sec bins. Red curve is a Poisson curve with rate = median count rate of data. |
 |
 |
| Quadrant-wise count rates Data is divided into 100 sec bins |
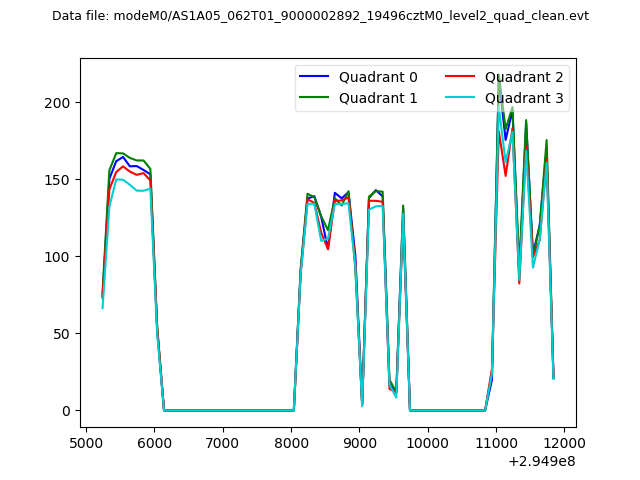 |
|
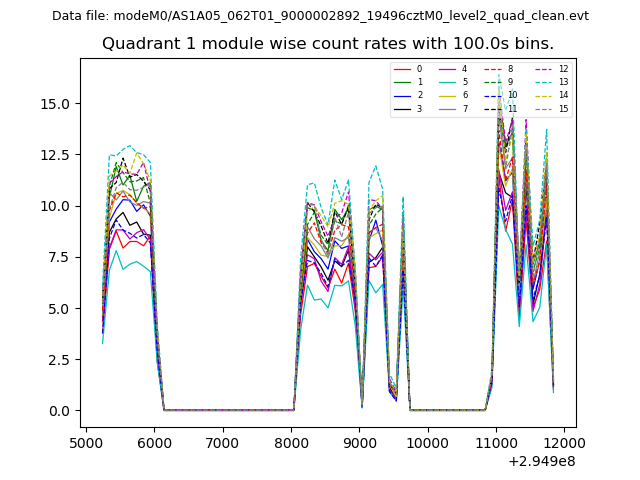
| Module-wise count rates for Quadrant A Data is divided into 100 sec bins |
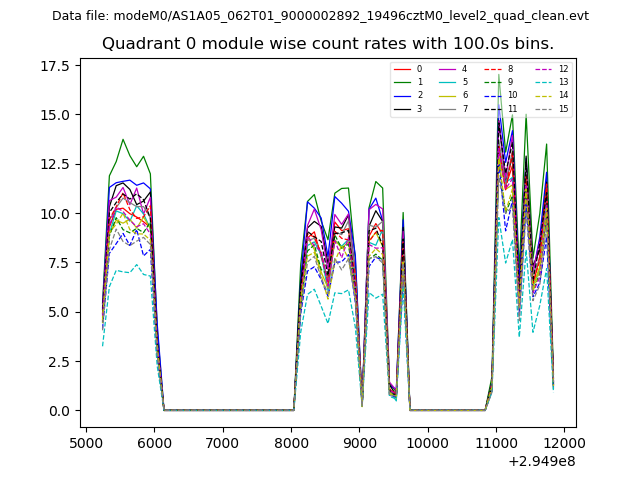 |
 |
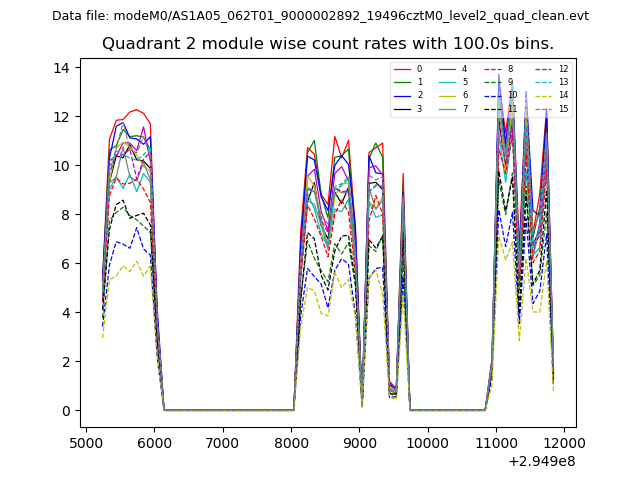
| Module-wise count rates for Quadrant B Data is divided into 100 sec bins |
 |
 |
| Module-wise count rates for Quadrant C Data is divided into 100 sec bins |
 |
 |
| Module-wise count rates for Quadrant D Data is divided into 100 sec bins |
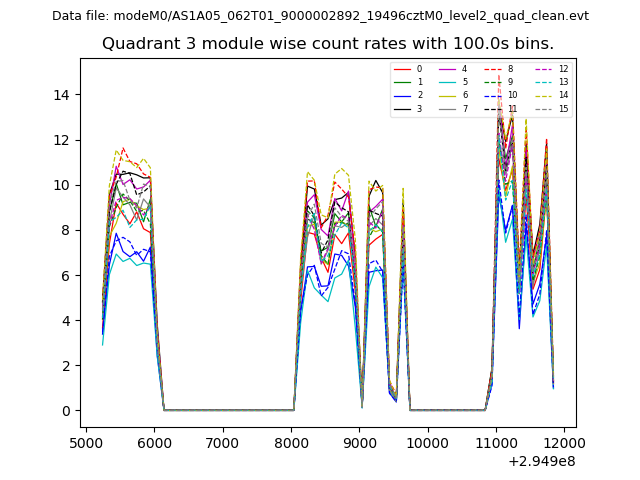 |
 |
| Parameter | Plot |
|---|---|
| CZT HV Monitor | 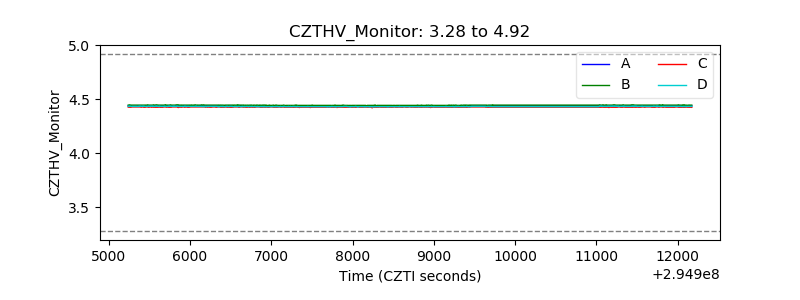 |
| D_VDD | 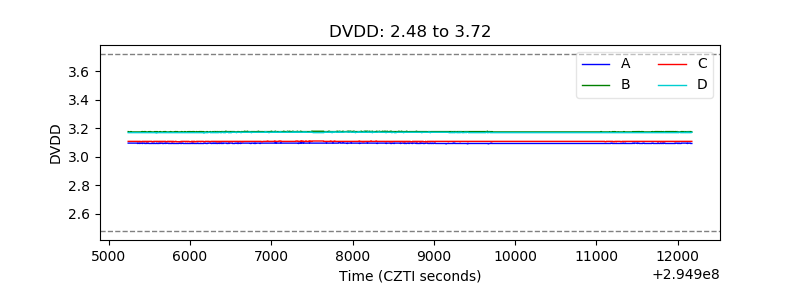 |
| Temperature 1 | 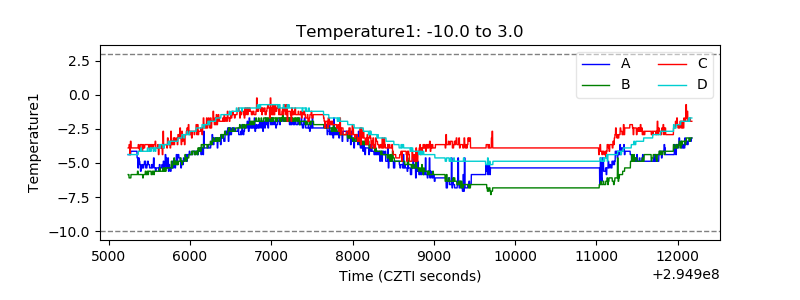 |
| Veto HV Monitor | 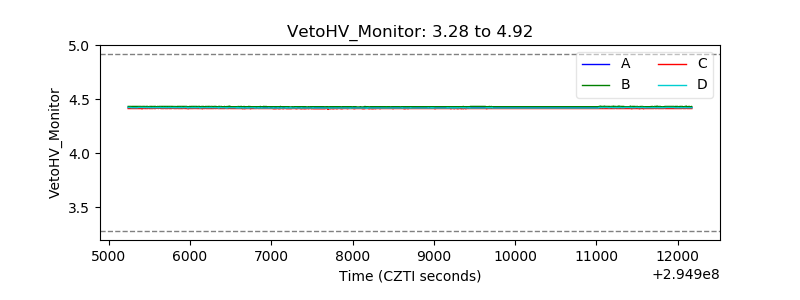 |
| Veto LLD |  |
| Alpha Counter | 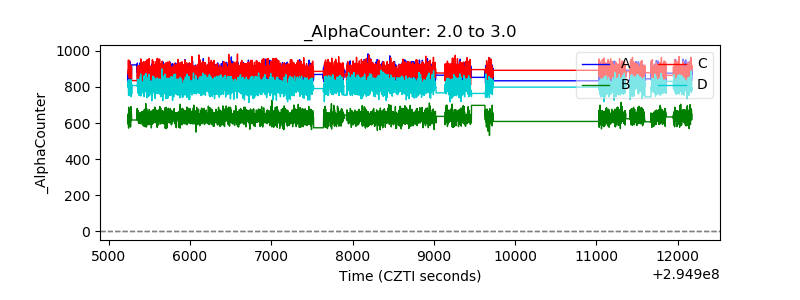 |
| _CPM_Rate | 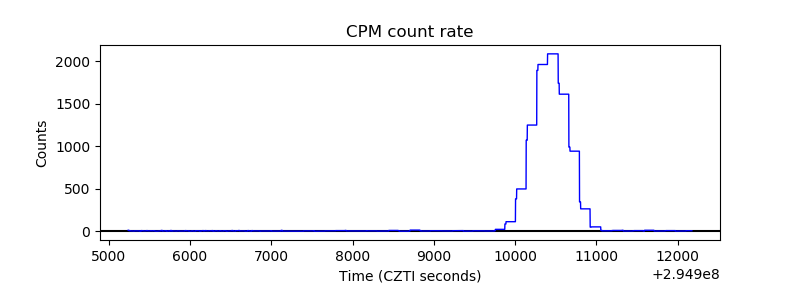 |
| CZT Counter | 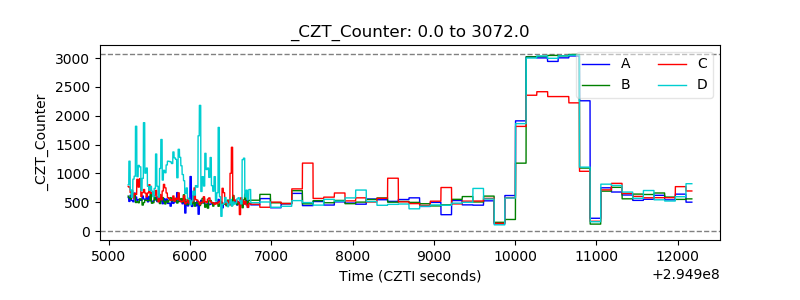 |
| +2.5 Volts monitor |  |
| +5 Volts monitor | 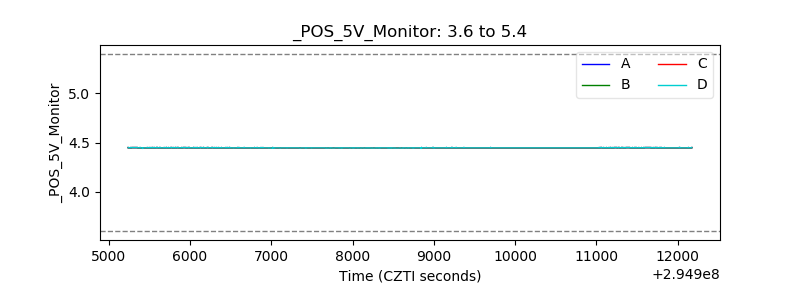 |
| _ROLL_ROT | 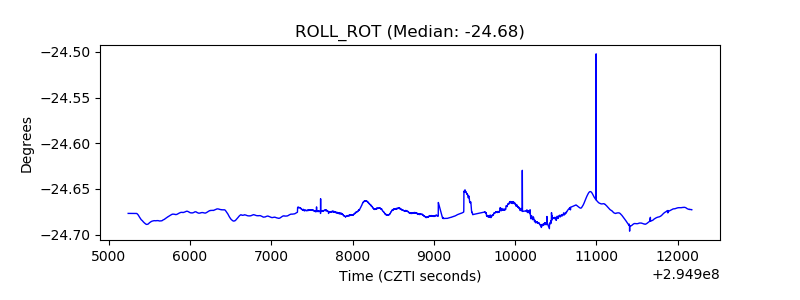 |
| _Roll_DEC | 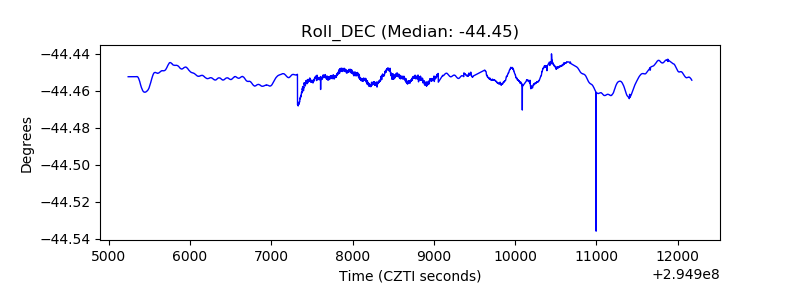 |
| _Roll_RA | 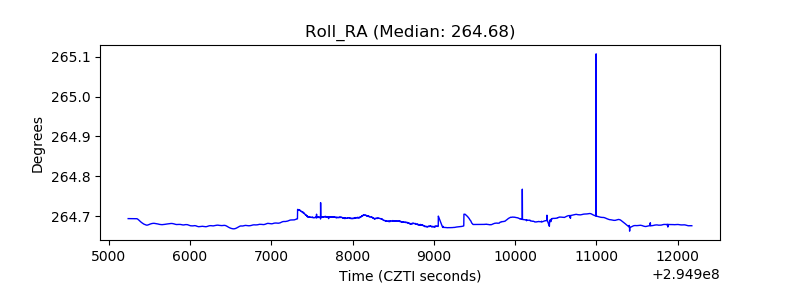 |
| Veto Counter | 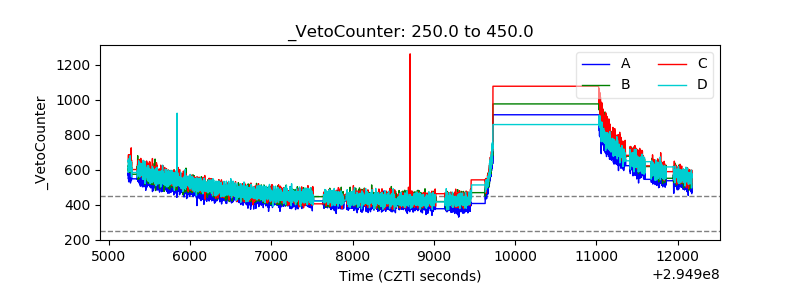 |