| Param | Original file | Final file |
|---|---|---|
| Filename | modeM0/AS1A05_062T01_9000002892_19499cztM0_level2.evt | modeM0/AS1A05_062T01_9000002892_19499cztM0_level2_quad_clean.evt |
| Size (bytes) | 296,256,960 | 38,027,520 |
| Size | 282.5 MB | 36.3 MB |
| Events in quadrant A | 1,837,685 | 228,322 |
| Events in quadrant B | 2,026,866 | 227,941 |
| Events in quadrant C | 2,364,719 | 216,607 |
| Events in quadrant D | 2,487,046 | 212,990 |
| Mode SS | |||
|---|---|---|---|
| Quadrant | BADHDUFLAG | Total packets | Discarded packets |
| A | 0 | 74 | 0 |
| B | 0 | 74 | 0 |
| C | 0 | 74 | 0 |
| D | 0 | 74 | 0 |
| Mode M0 | |||
|---|---|---|---|
| Quadrant | BADHDUFLAG | Total packets | Discarded packets |
| A | 0 | 7734 | 1 |
| B | 0 | 8313 | 1 |
| C | 0 | 9399 | 1 |
| D | 0 | 9818 | 1 |
| Quadrant | Total seconds | Saturated seconds | Saturation percentage |
|---|---|---|---|
| A | 3752 | 5 | 0.133262% |
| B | 3753 | 29 | 0.772715% |
| C | 3753 | 73 | 1.945111% |
| D | 3753 | 63 | 1.678657% |
Noise dominated data is calculated using 1-second bins in cleaned event files. If a bin has >2000 counts, and if more than 50% of those come from <1% of pixels, then it is considered to be noise-dominated and hence unusable.
| Quadrant | # 1 sec bins | Bins with >0 counts | Bins with >2000 counts | High rate bins dominated by noise | Noise dominated (total time) | Noise dominated (detector-on time) | Marked lightcurve |
|---|---|---|---|---|---|---|---|
| A | 3752 | 3752 | 0 | 0 | 0.00% | 0.00% | 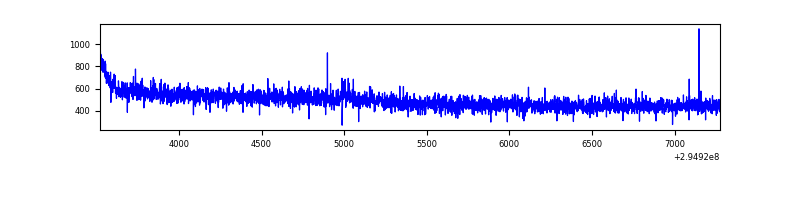 |
| B | 3753 | 3753 | 15 | 15 | 0.40% | 0.40% | 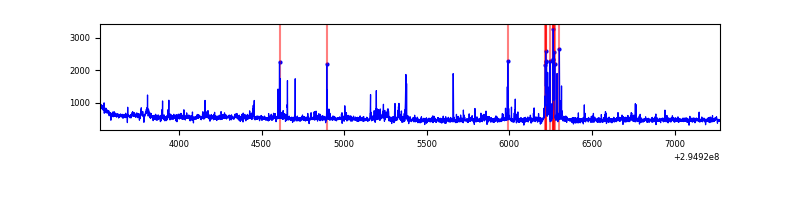 |
| C | 3753 | 3753 | 31 | 31 | 0.83% | 0.83% | 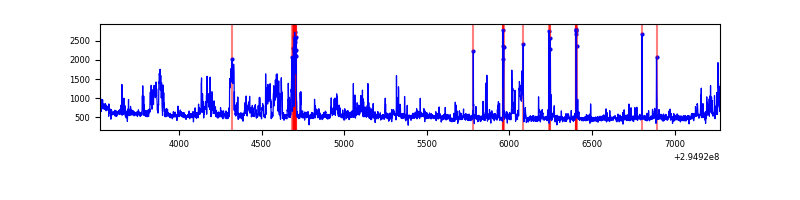 |
| D | 3753 | 3753 | 53 | 53 | 1.41% | 1.41% | 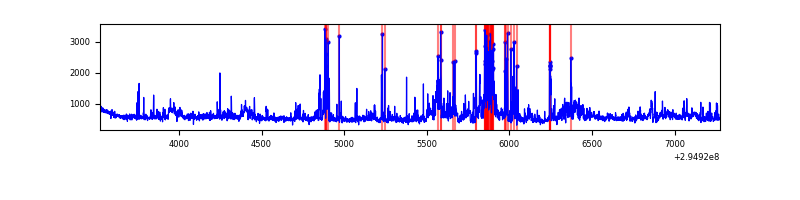 |
Top three noisy pixels from each quadrant. If the there are fewer than three noisy pixels in the level2.evt file, extra rows are filled as -1
| Pixel properties | Quadrant properties | ||||||
|---|---|---|---|---|---|---|---|
| Quadrant | DetID | PixID | Counts | Sigma | Mean | Median | Sigma |
| A | 11 | 47 | 7317 | 70.89 | 474 | 465 | 96.7 |
| A | 13 | 254 | 5410 | 51.16 | 474 | 465 | 96.7 |
| A | 0 | 226 | 4138 | 38.0 | 474 | 465 | 96.7 |
| B | 7 | 220 | 65525 | 730.35 | 470 | 458 | 89.1 |
| B | 0 | 244 | 22973 | 252.72 | 470 | 458 | 89.1 |
| B | 4 | 80 | 18572 | 203.32 | 470 | 458 | 89.1 |
| C | 7 | 247 | 261782 | 2514.05 | 446 | 450 | 103.9 |
| C | 5 | 112 | 157531 | 1511.14 | 446 | 450 | 103.9 |
| C | 3 | 233 | 88509 | 847.14 | 446 | 450 | 103.9 |
| D | 1 | 52 | 448920 | 3982.21 | 457 | 444 | 112.6 |
| D | 7 | 238 | 189185 | 1675.91 | 457 | 444 | 112.6 |
| D | 12 | 218 | 82063 | 724.73 | 457 | 444 | 112.6 |
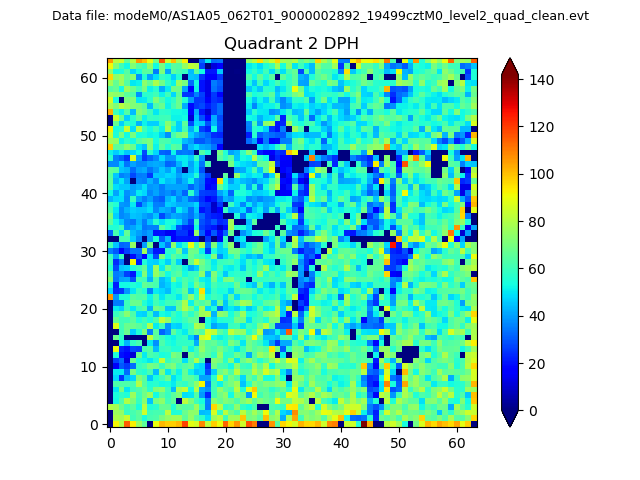
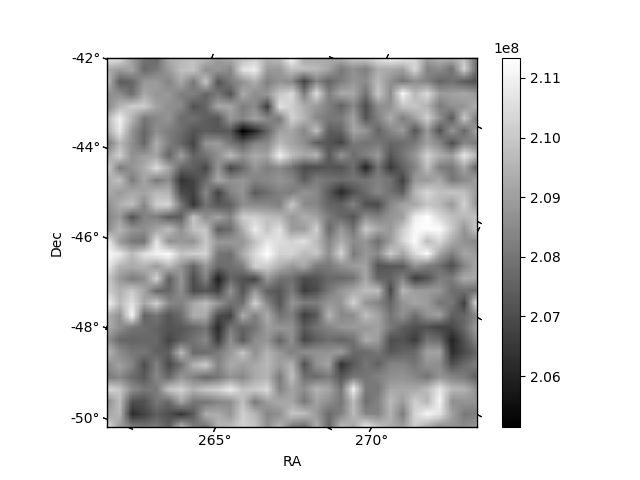
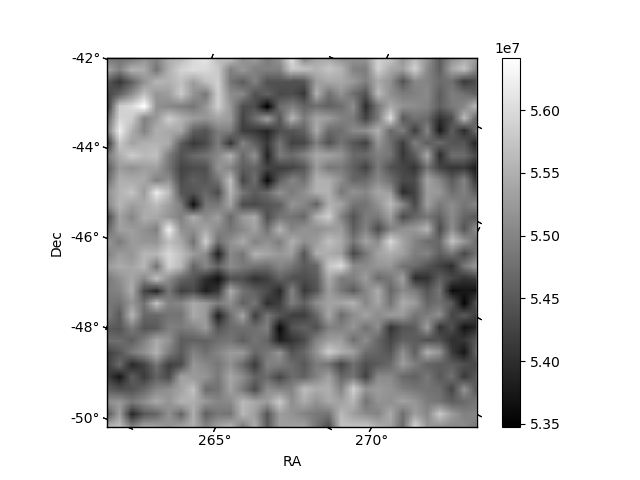
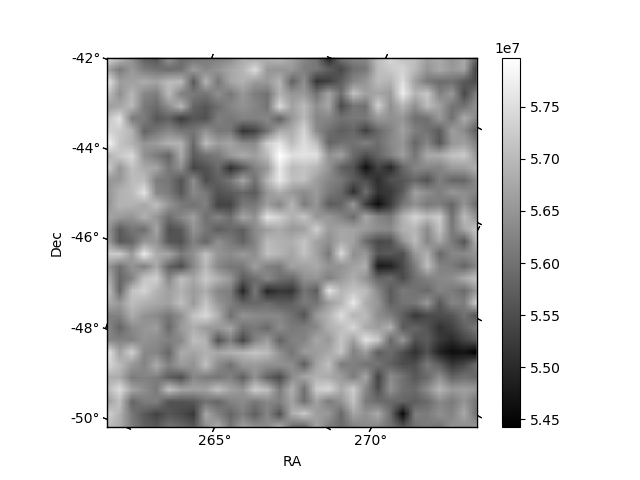
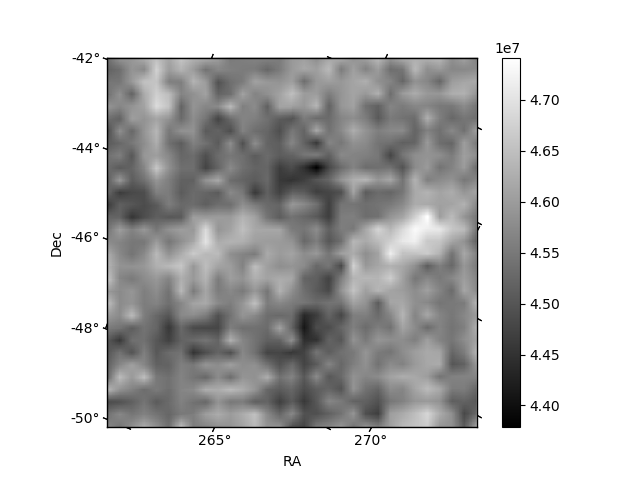
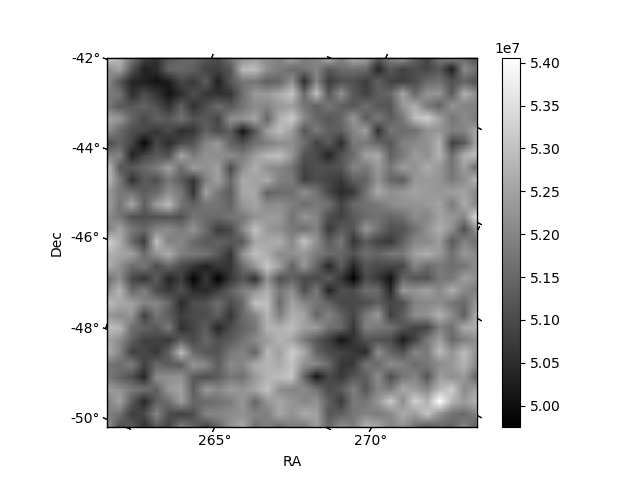
Histogram calculated using DETX and DETY for each event in the final _common_clean file
| Quadrant A | 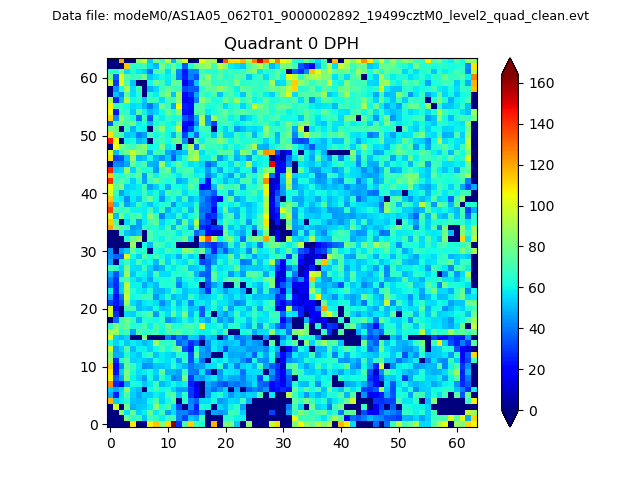 |
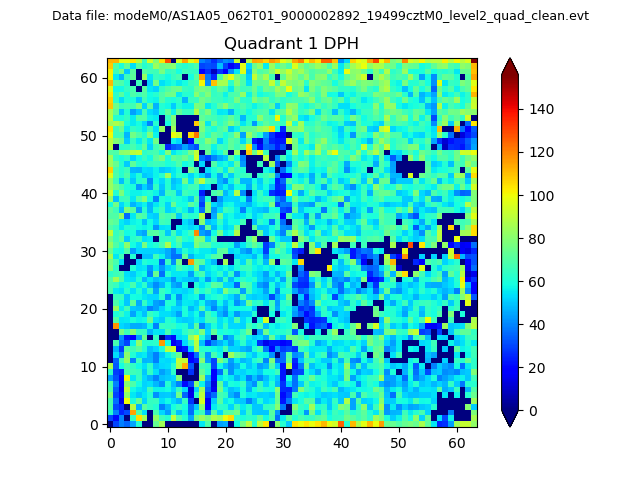 |
Quadrant B |
|---|---|---|---|
| Quadrant D | 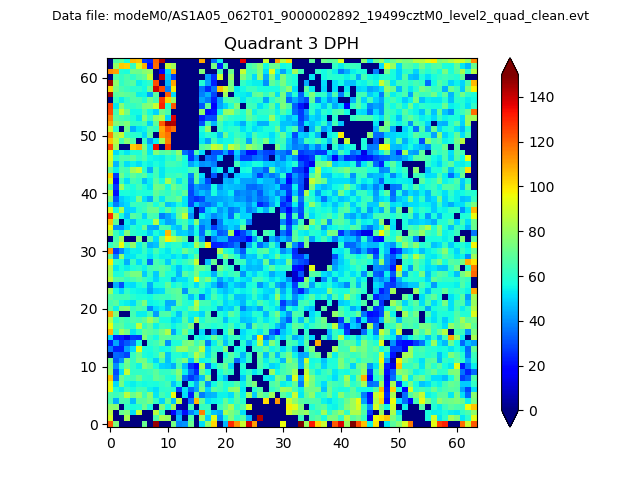 |
 |
Quadrant C |
| Plot type | Count rate plots | Images |
|---|---|---|
| Comparison with Poisson distribution Blue bars denote a histogram of data divided into 1 sec bins. Red curve is a Poisson curve with rate = median count rate of data. |
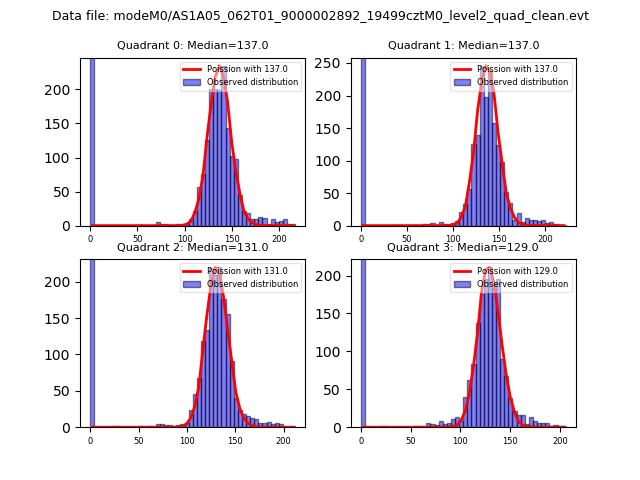 |
 |
| Quadrant-wise count rates Data is divided into 100 sec bins |
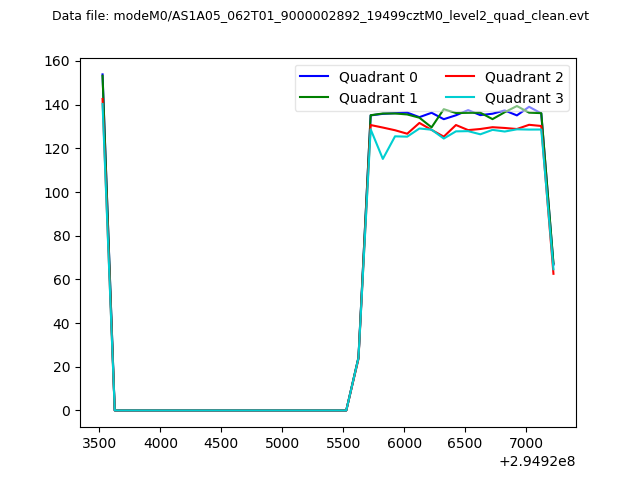 |
|
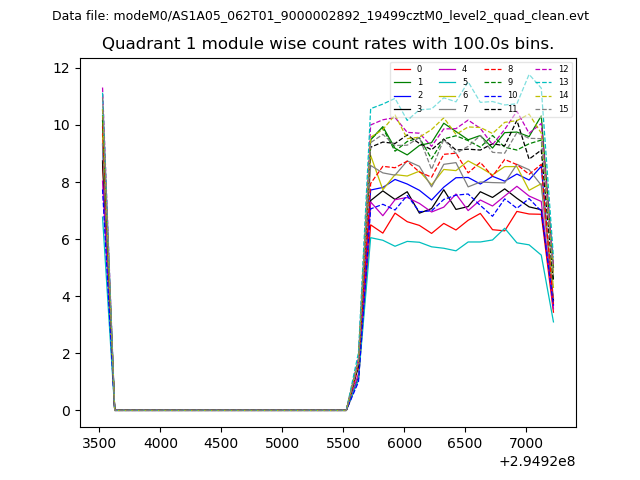
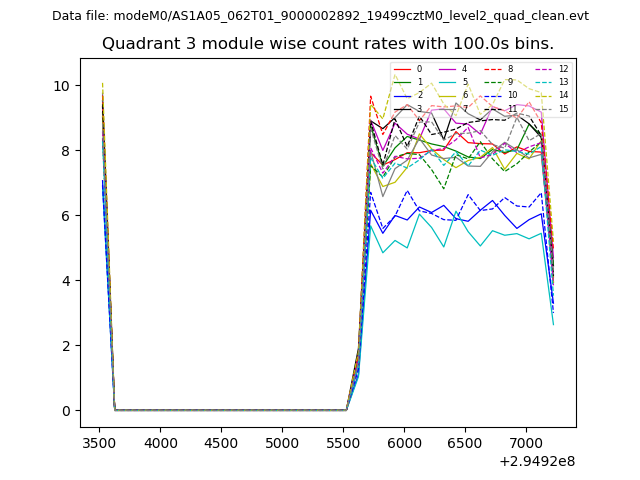
| Module-wise count rates for Quadrant A Data is divided into 100 sec bins |
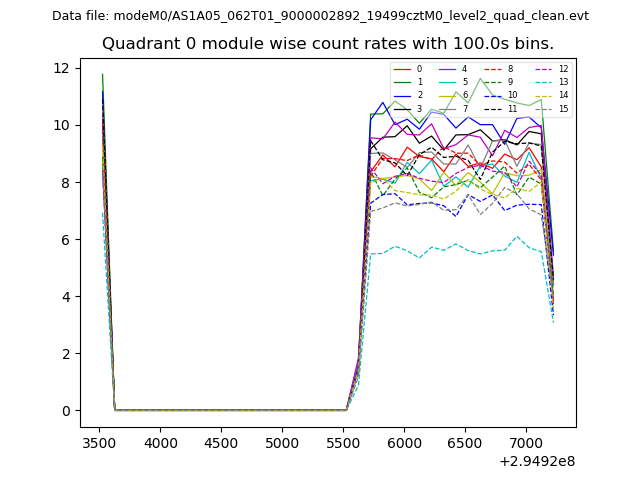 |
 |
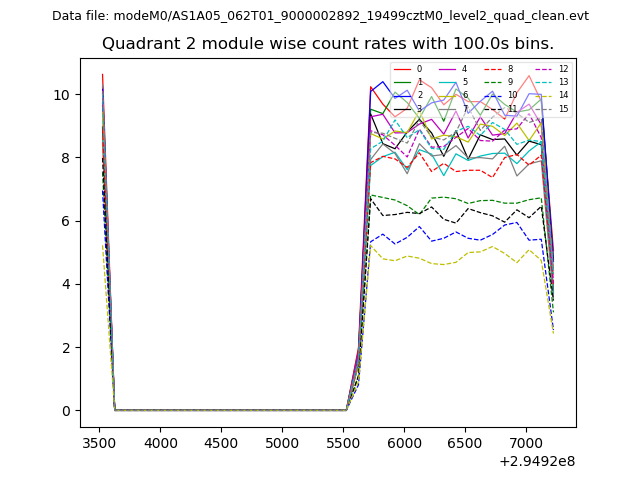
| Module-wise count rates for Quadrant B Data is divided into 100 sec bins |
 |
 |
| Module-wise count rates for Quadrant C Data is divided into 100 sec bins |
 |
 |
| Module-wise count rates for Quadrant D Data is divided into 100 sec bins |
 |
 |
| Parameter | Plot |
|---|---|
| CZT HV Monitor | 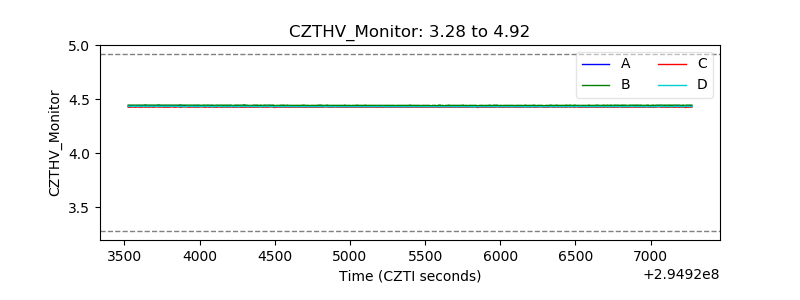 |
| D_VDD | 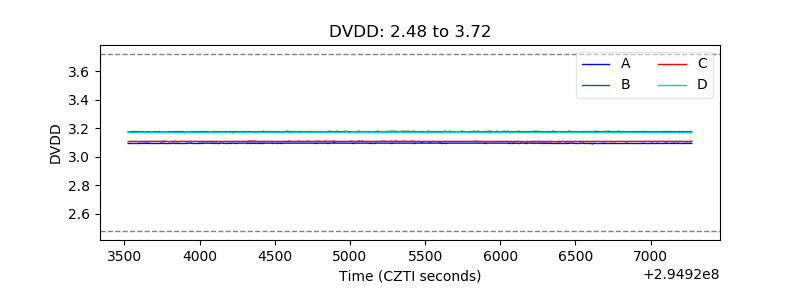 |
| Temperature 1 | 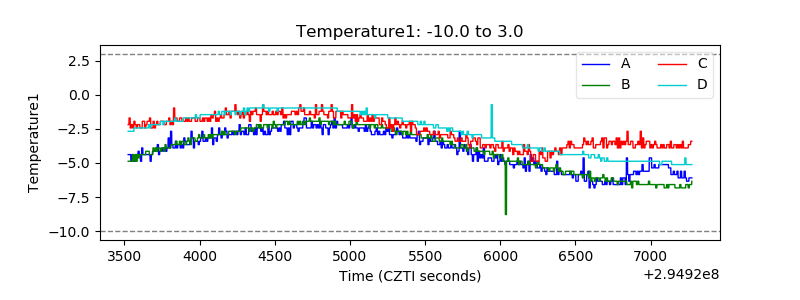 |
| Veto HV Monitor | 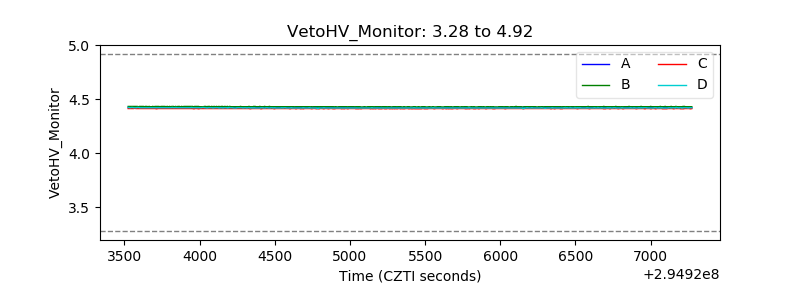 |
| Veto LLD | 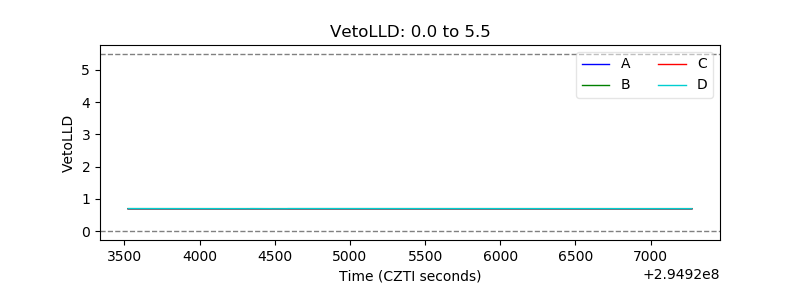 |
| Alpha Counter | 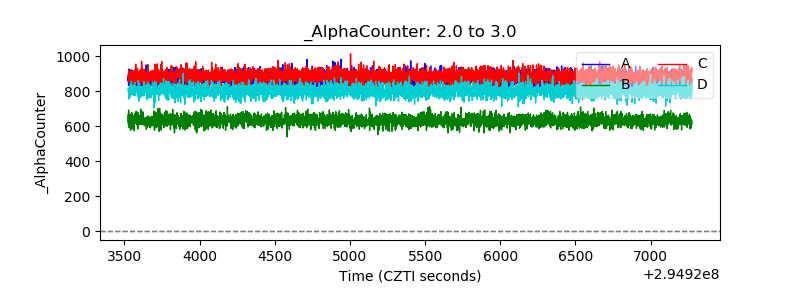 |
| _CPM_Rate | 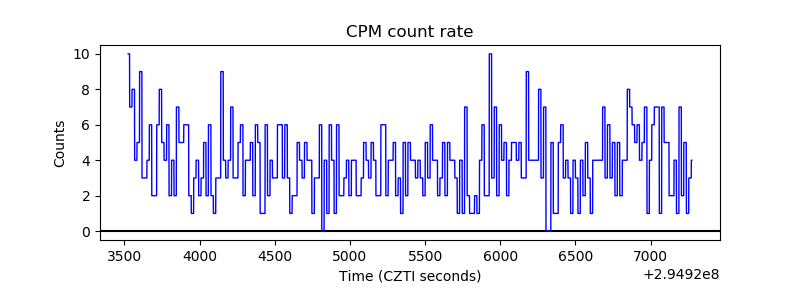 |
| CZT Counter | 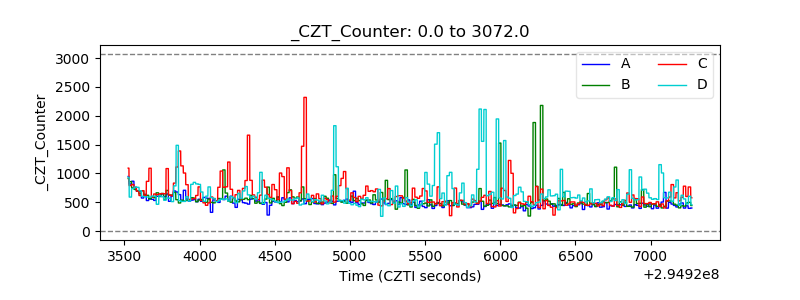 |
| +2.5 Volts monitor | 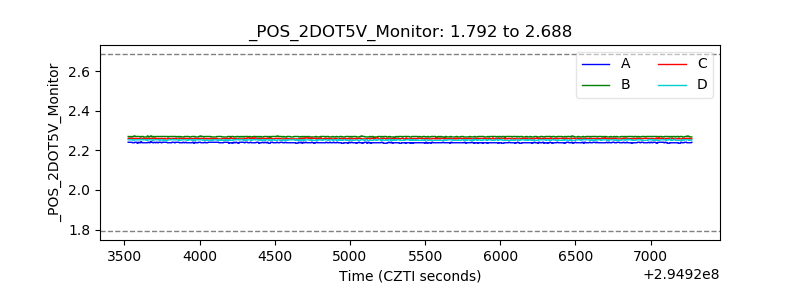 |
| +5 Volts monitor | 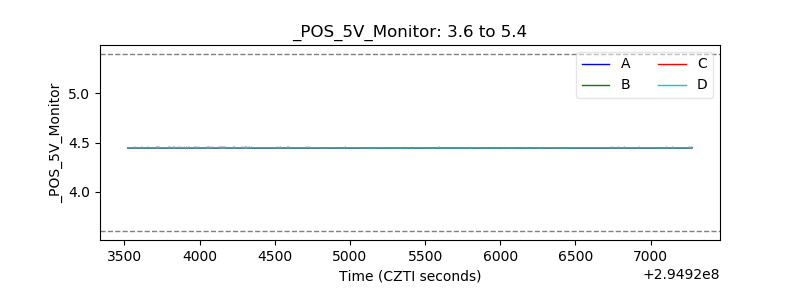 |
| _ROLL_ROT | 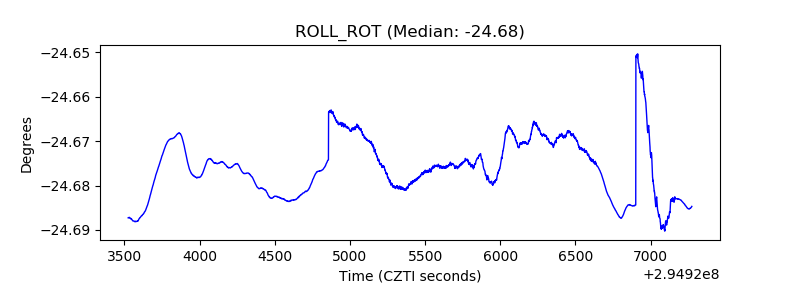 |
| _Roll_DEC | 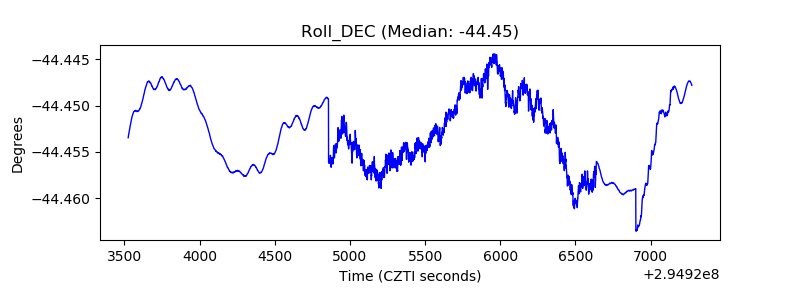 |
| _Roll_RA | 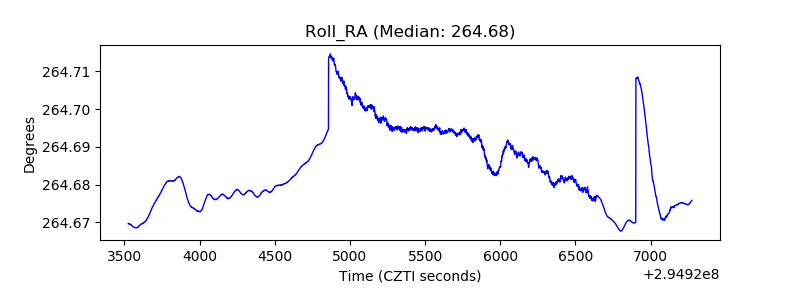 |
| Veto Counter | 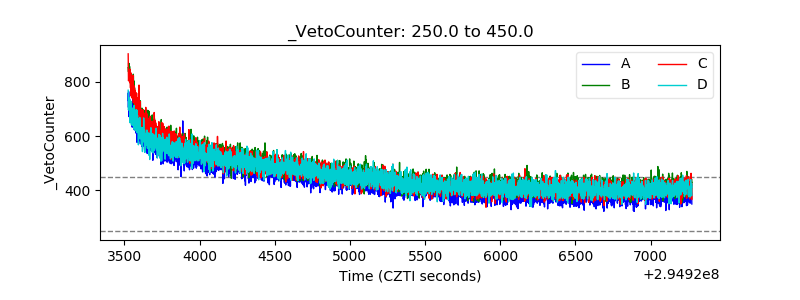 |