| Param | Original file | Final file |
|---|---|---|
| Filename | modeM0/AS1A05_062T01_9000002892_19500cztM0_level2.evt | modeM0/AS1A05_062T01_9000002892_19500cztM0_level2_quad_clean.evt |
| Size (bytes) | 1,388,376,000 | 214,960,320 |
| Size | 1.3 GB | 205.0 MB |
| Events in quadrant A | 9,173,846 | 1,355,093 |
| Events in quadrant B | 9,866,204 | 1,370,396 |
| Events in quadrant C | 10,649,204 | 1,298,501 |
| Events in quadrant D | 11,174,551 | 1,277,265 |
| Mode M9 | |||
|---|---|---|---|
| Quadrant | BADHDUFLAG | Total packets | Discarded packets |
| A | 0 | 38 | 0 |
| B | 0 | 38 | 0 |
| C | 0 | 38 | 0 |
| D | 0 | 38 | 0 |
| Mode SS | |||
|---|---|---|---|
| Quadrant | BADHDUFLAG | Total packets | Discarded packets |
| A | 0 | 356 | 0 |
| B | 0 | 356 | 0 |
| C | 0 | 356 | 0 |
| D | 0 | 356 | 0 |
| Mode M0 | |||
|---|---|---|---|
| Quadrant | BADHDUFLAG | Total packets | Discarded packets |
| A | 0 | 37739 | 3 |
| B | 0 | 40022 | 3 |
| C | 0 | 42555 | 3 |
| D | 0 | 44540 | 3 |
| Quadrant | Total seconds | Saturated seconds | Saturation percentage |
|---|---|---|---|
| A | 17537 | 366 | 2.087016% |
| B | 17538 | 382 | 2.178127% |
| C | 17538 | 470 | 2.679895% |
| D | 17538 | 572 | 3.261489% |
Noise dominated data is calculated using 1-second bins in cleaned event files. If a bin has >2000 counts, and if more than 50% of those come from <1% of pixels, then it is considered to be noise-dominated and hence unusable.
| Quadrant | # 1 sec bins | Bins with >0 counts | Bins with >2000 counts | High rate bins dominated by noise | Noise dominated (total time) | Noise dominated (detector-on time) | Marked lightcurve |
|---|---|---|---|---|---|---|---|
| A | 21322 | 17538 | 106 | 106 | 0.50% | 0.60% | 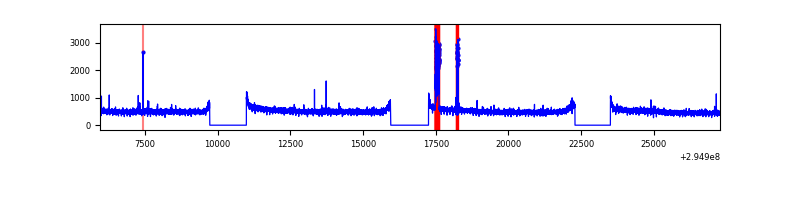 |
| B | 21323 | 17539 | 68 | 68 | 0.32% | 0.39% | 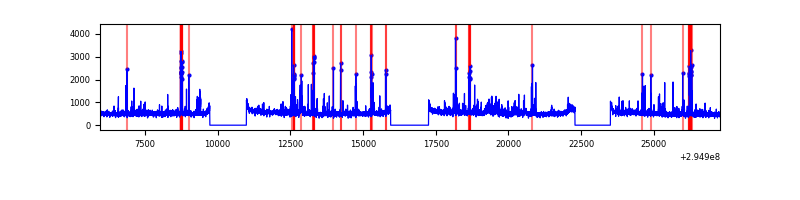 |
| C | 21323 | 17539 | 72 | 72 | 0.34% | 0.41% | 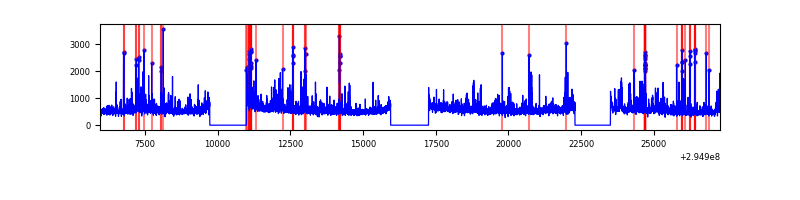 |
| D | 21323 | 17540 | 297 | 297 | 1.39% | 1.69% | 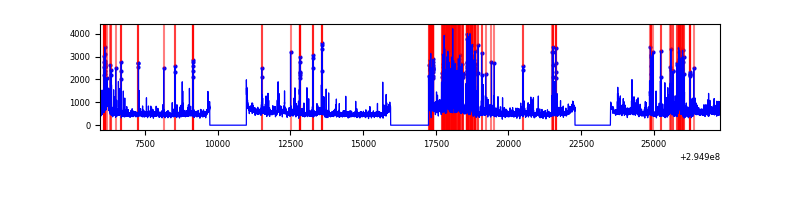 |
Top three noisy pixels from each quadrant. If the there are fewer than three noisy pixels in the level2.evt file, extra rows are filled as -1
| Pixel properties | Quadrant properties | ||||||
|---|---|---|---|---|---|---|---|
| Quadrant | DetID | PixID | Counts | Sigma | Mean | Median | Sigma |
| A | 5 | 16 | 291555 | 631.58 | 2299 | 2259 | 458.0 |
| A | 13 | 254 | 25813 | 51.42 | 2299 | 2259 | 458.0 |
| A | 0 | 226 | 20014 | 38.76 | 2299 | 2259 | 458.0 |
| B | 0 | 189 | 254962 | 602.66 | 2271 | 2219 | 419.4 |
| B | 7 | 220 | 210308 | 496.19 | 2271 | 2219 | 419.4 |
| B | 4 | 171 | 167073 | 393.09 | 2271 | 2219 | 419.4 |
| C | 5 | 112 | 610533 | 1221.96 | 2182 | 2202 | 497.8 |
| C | 9 | 221 | 504669 | 1009.31 | 2182 | 2202 | 497.8 |
| C | 3 | 233 | 362998 | 724.74 | 2182 | 2202 | 497.8 |
| D | 12 | 218 | 851945 | 1596.85 | 2224 | 2168 | 532.2 |
| D | 7 | 238 | 841385 | 1577.01 | 2224 | 2168 | 532.2 |
| D | 1 | 52 | 788421 | 1477.48 | 2224 | 2168 | 532.2 |
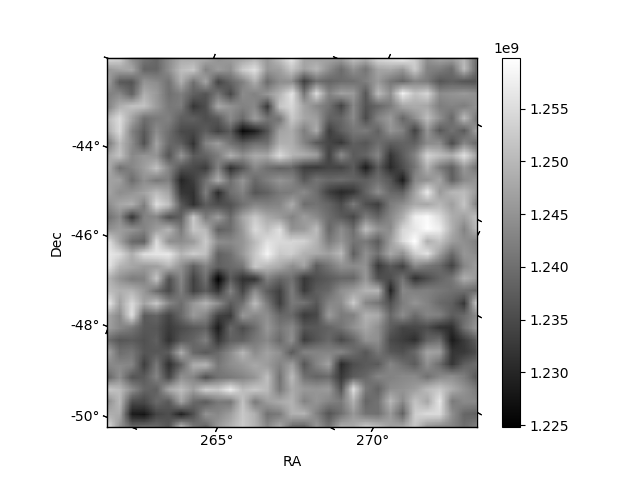
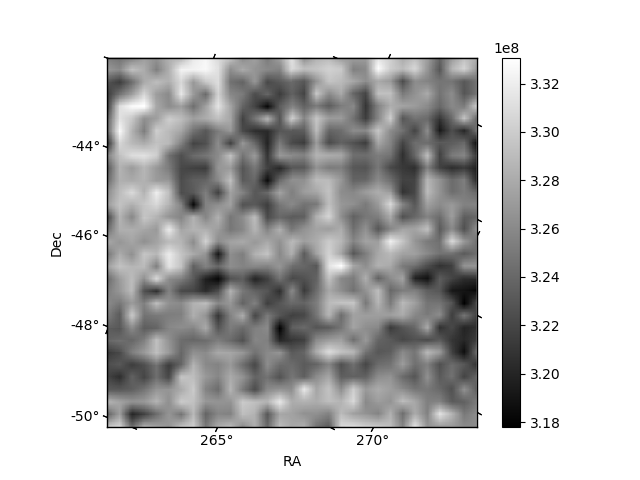
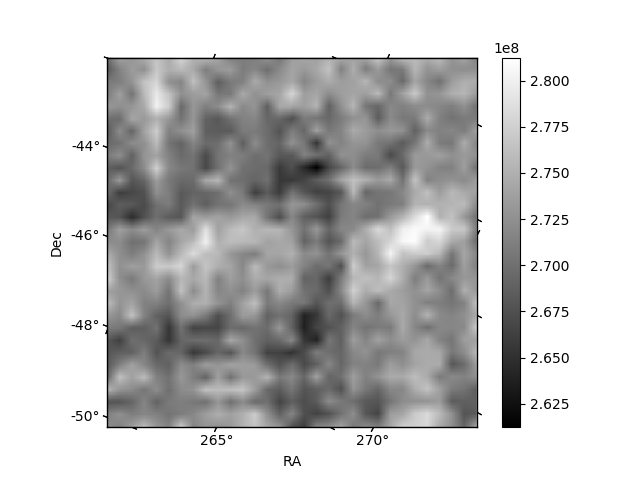
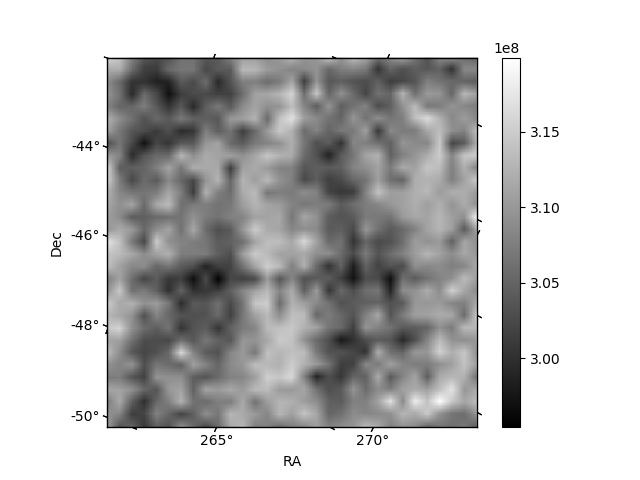
Histogram calculated using DETX and DETY for each event in the final _common_clean file
| Quadrant A | 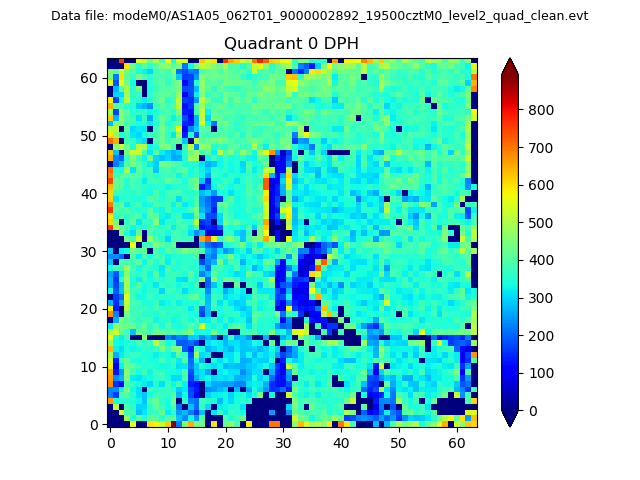 |
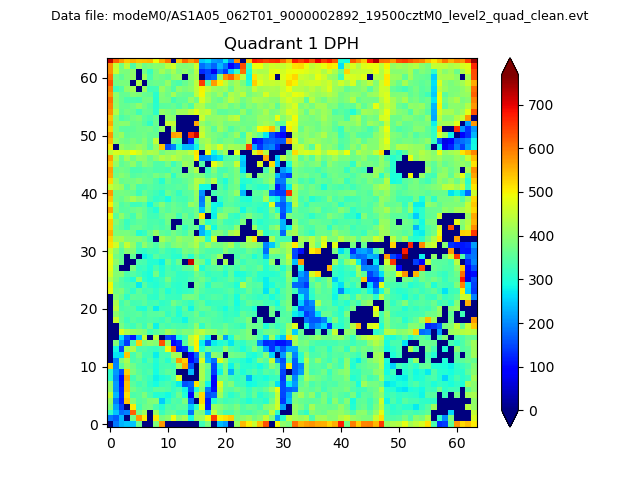 |
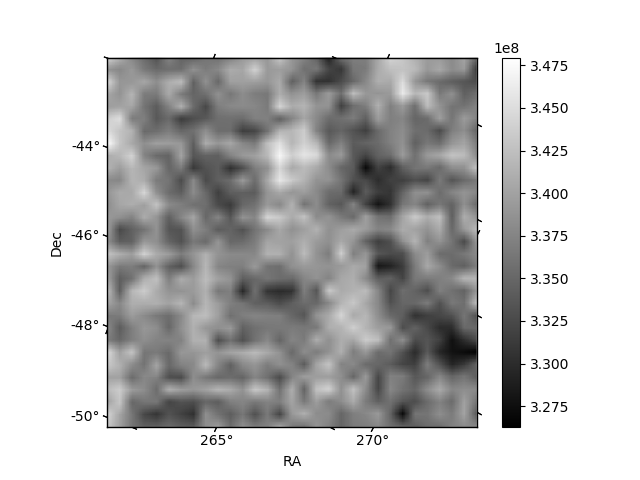
Quadrant B |
|---|---|---|---|
| Quadrant D | 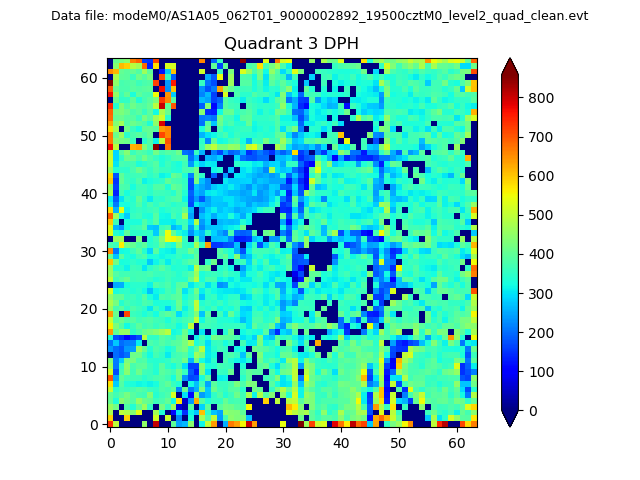 |
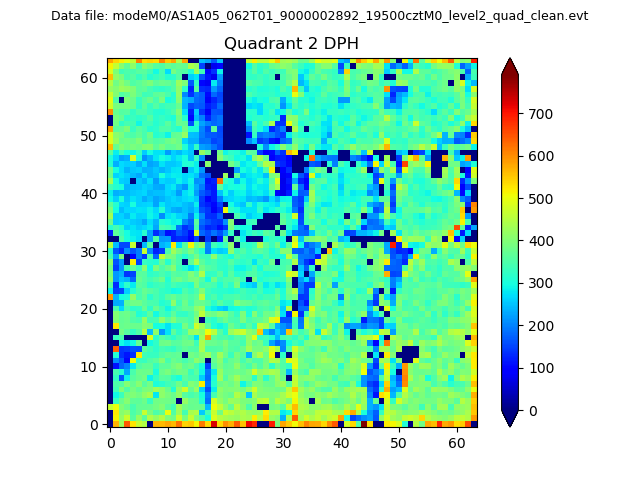 |
Quadrant C |
| Plot type | Count rate plots | Images |
|---|---|---|
| Comparison with Poisson distribution Blue bars denote a histogram of data divided into 1 sec bins. Red curve is a Poisson curve with rate = median count rate of data. |
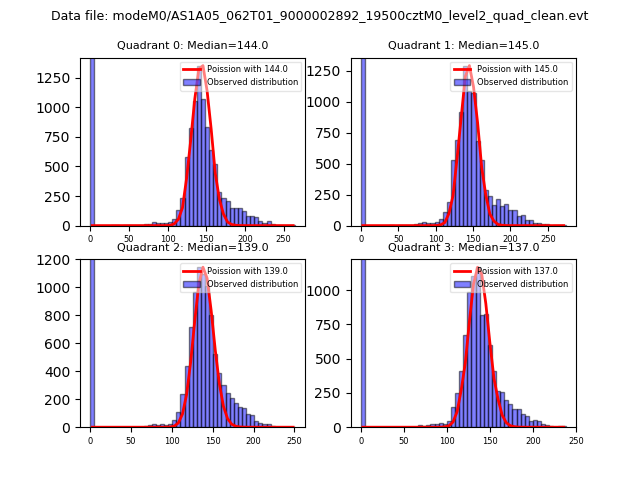 |
 |
| Quadrant-wise count rates Data is divided into 100 sec bins |
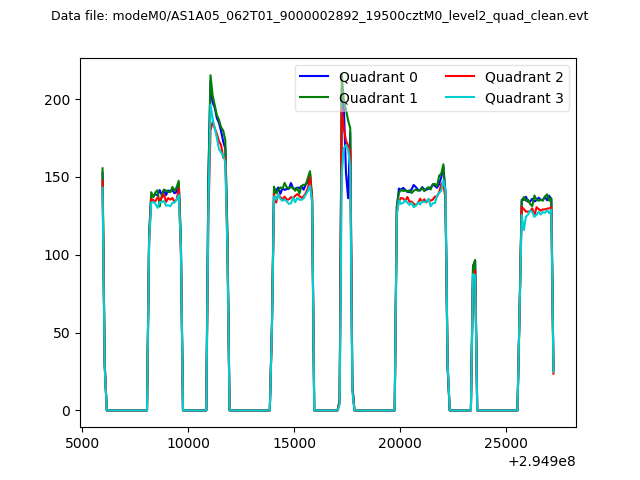 |
|
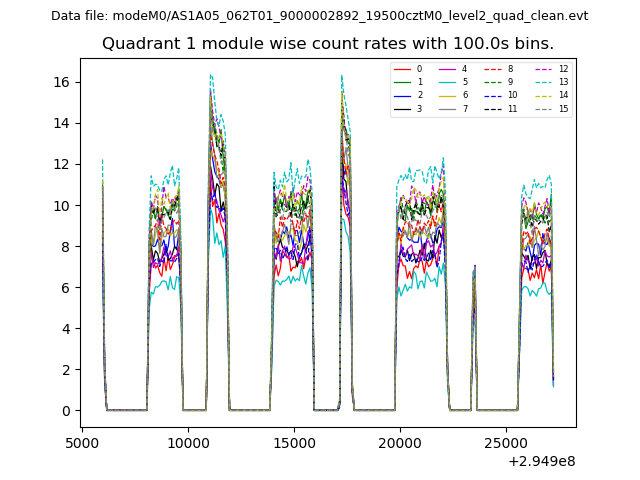
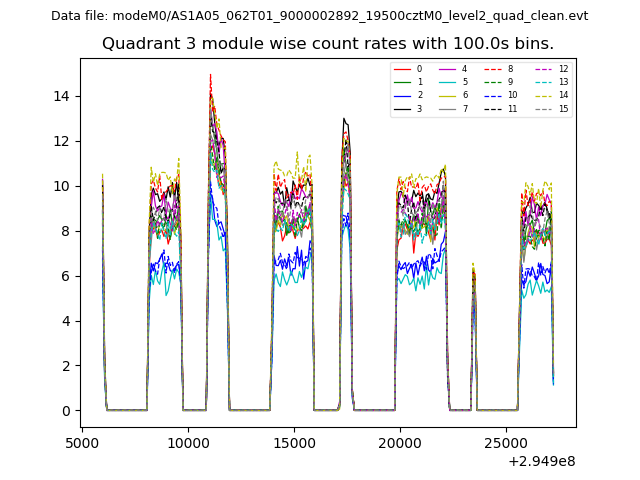
| Module-wise count rates for Quadrant A Data is divided into 100 sec bins |
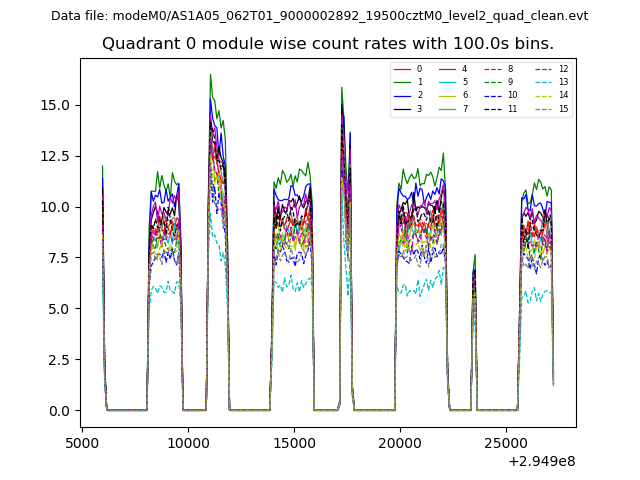 |
 |
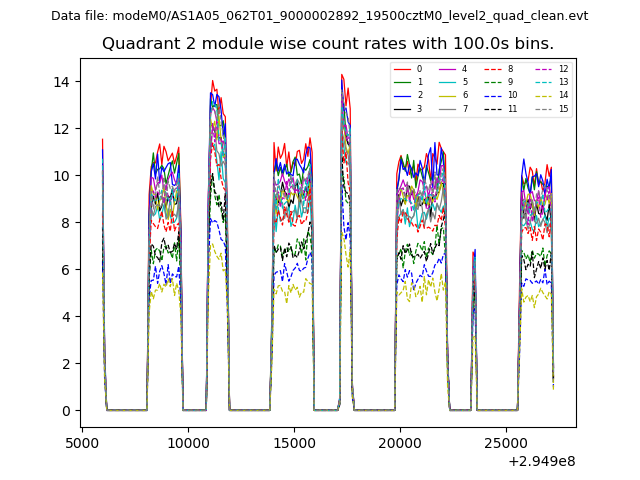
| Module-wise count rates for Quadrant B Data is divided into 100 sec bins |
 |
 |
| Module-wise count rates for Quadrant C Data is divided into 100 sec bins |
 |
 |
| Module-wise count rates for Quadrant D Data is divided into 100 sec bins |
 |
 |
| Parameter | Plot |
|---|---|
| CZT HV Monitor | 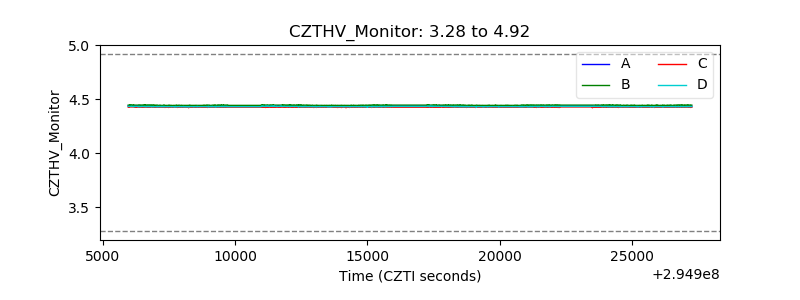 |
| D_VDD | 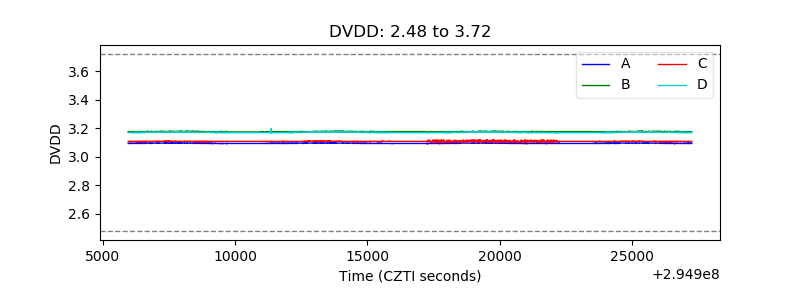 |
| Temperature 1 | 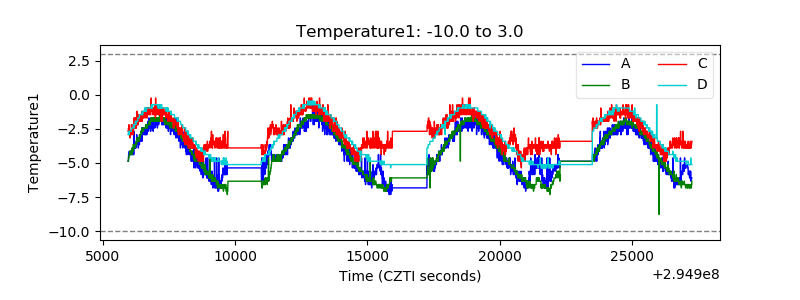 |
| Veto HV Monitor | 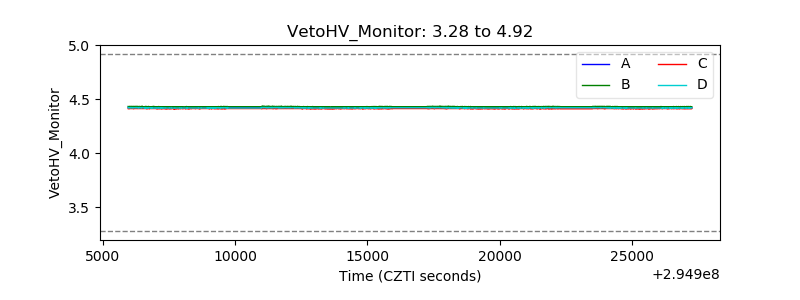 |
| Veto LLD | 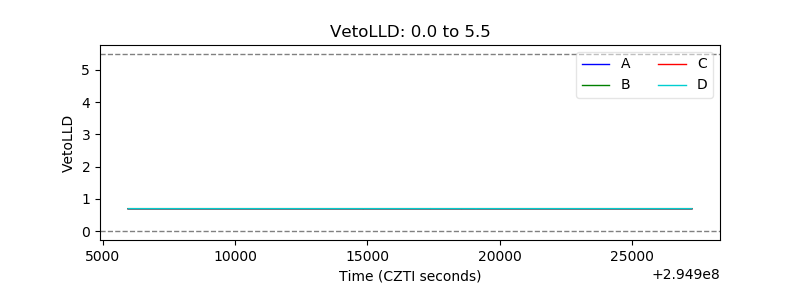 |
| Alpha Counter | 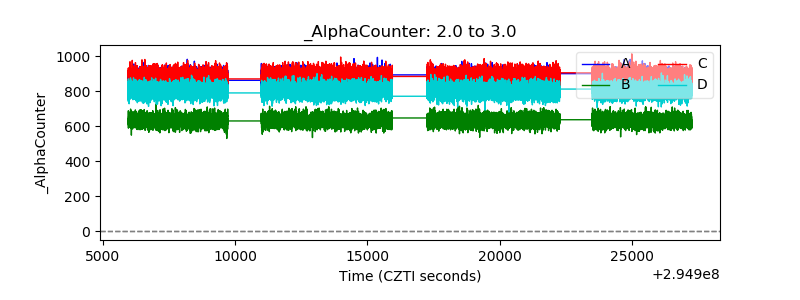 |
| _CPM_Rate | 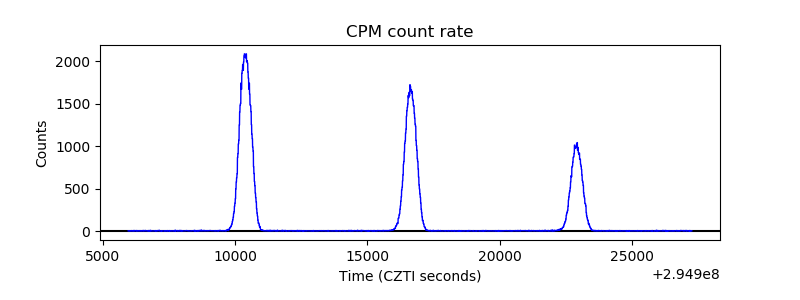 |
| CZT Counter | 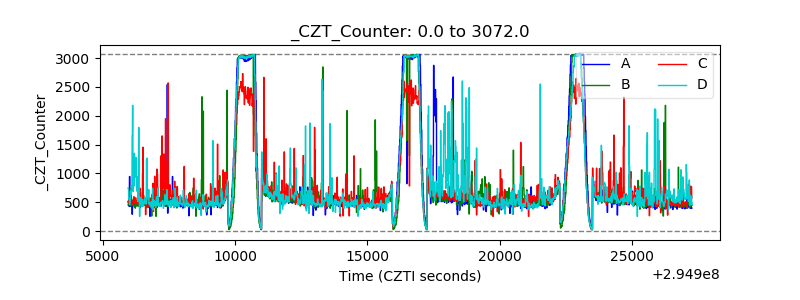 |
| +2.5 Volts monitor |  |
| +5 Volts monitor |  |
| _ROLL_ROT | 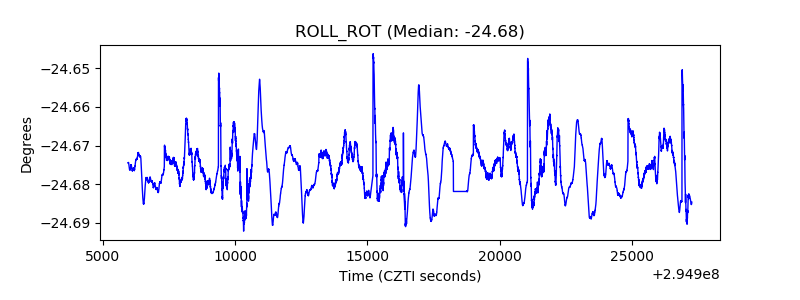 |
| _Roll_DEC | 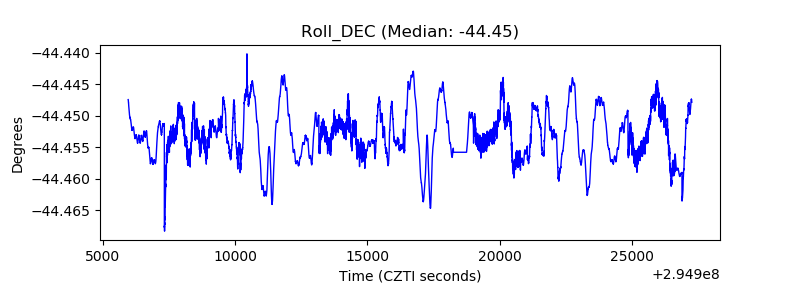 |
| _Roll_RA | 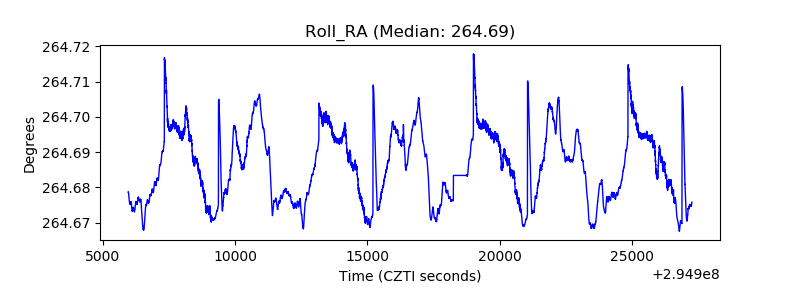 |
| Veto Counter | 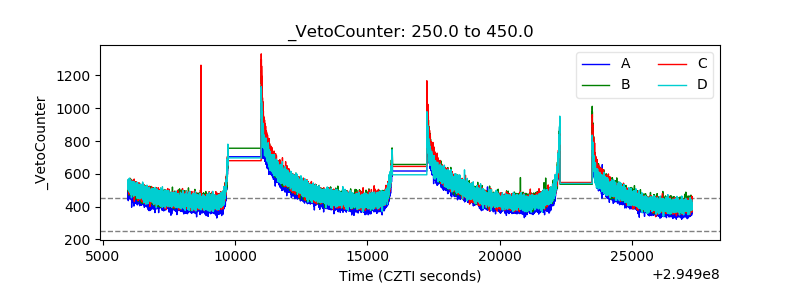 |