| Param | Original file | Final file |
|---|---|---|
| Filename | modeM0/AS1A05_175T01_9000002894_19500cztM0_level2.evt | modeM0/AS1A05_175T01_9000002894_19500cztM0_level2_quad_clean.evt |
| Size (bytes) | 529,128,000 | 93,320,640 |
| Size | 504.6 MB | 89.0 MB |
| Events in quadrant A | 3,487,967 | 600,680 |
| Events in quadrant B | 3,675,232 | 600,750 |
| Events in quadrant C | 4,201,140 | 566,759 |
| Events in quadrant D | 4,178,461 | 563,853 |
| Mode M9 | |||
|---|---|---|---|
| Quadrant | BADHDUFLAG | Total packets | Discarded packets |
| A | 0 | 16 | 0 |
| B | 0 | 16 | 0 |
| C | 0 | 16 | 0 |
| D | 0 | 16 | 0 |
| Mode M0 | |||
|---|---|---|---|
| Quadrant | BADHDUFLAG | Total packets | Discarded packets |
| A | 0 | 14870 | 2 |
| B | 0 | 15351 | 2 |
| C | 0 | 16779 | 3 |
| D | 0 | 17029 | 2 |
| Mode SS | |||
|---|---|---|---|
| Quadrant | BADHDUFLAG | Total packets | Discarded packets |
| A | 0 | 146 | 0 |
| B | 0 | 146 | 0 |
| C | 0 | 146 | 0 |
| D | 0 | 146 | 0 |
| Quadrant | Total seconds | Saturated seconds | Saturation percentage |
|---|---|---|---|
| A | 7095 | 246 | 3.467230% |
| B | 7095 | 305 | 4.298802% |
| C | 7094 | 370 | 5.215675% |
| D | 7094 | 287 | 4.045672% |
Noise dominated data is calculated using 1-second bins in cleaned event files. If a bin has >2000 counts, and if more than 50% of those come from <1% of pixels, then it is considered to be noise-dominated and hence unusable.
| Quadrant | # 1 sec bins | Bins with >0 counts | Bins with >2000 counts | High rate bins dominated by noise | Noise dominated (total time) | Noise dominated (detector-on time) | Marked lightcurve |
|---|---|---|---|---|---|---|---|
| A | 8755 | 7095 | 0 | 0 | 0.00% | 0.00% | 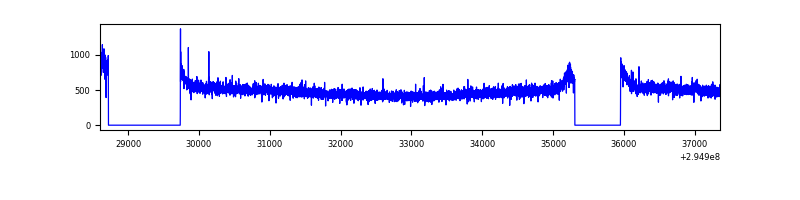 |
| B | 8755 | 7095 | 20 | 20 | 0.23% | 0.28% | 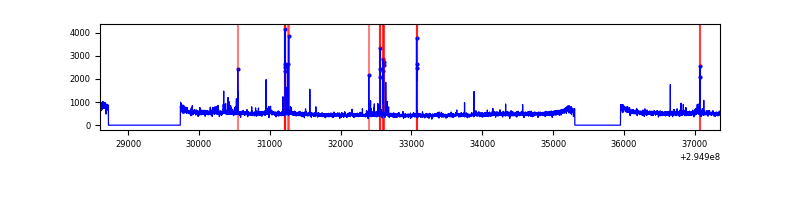 |
| C | 8754 | 7094 | 39 | 39 | 0.45% | 0.55% | 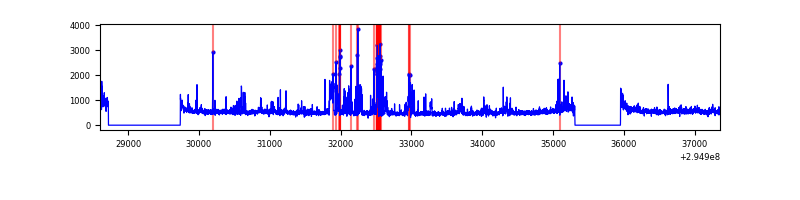 |
| D | 8754 | 7094 | 53 | 53 | 0.61% | 0.75% | 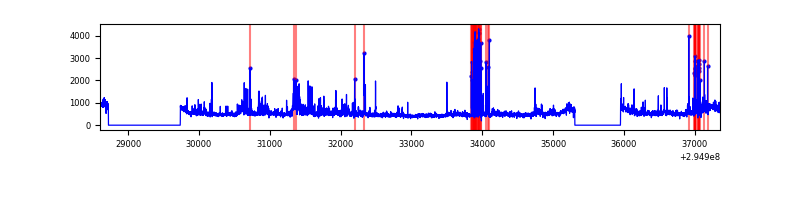 |
Top three noisy pixels from each quadrant. If the there are fewer than three noisy pixels in the level2.evt file, extra rows are filled as -1
| Pixel properties | Quadrant properties | ||||||
|---|---|---|---|---|---|---|---|
| Quadrant | DetID | PixID | Counts | Sigma | Mean | Median | Sigma |
| A | 11 | 47 | 11697 | 59.38 | 901 | 880 | 182.1 |
| A | 0 | 226 | 7848 | 38.25 | 901 | 880 | 182.1 |
| A | 13 | 254 | 7260 | 35.02 | 901 | 880 | 182.1 |
| B | 3 | 64 | 66500 | 387.04 | 887 | 864 | 169.6 |
| B | 0 | 182 | 50765 | 294.25 | 887 | 864 | 169.6 |
| B | 4 | 171 | 45949 | 265.85 | 887 | 864 | 169.6 |
| C | 7 | 247 | 305286 | 1537.71 | 852 | 857 | 198.0 |
| C | 5 | 112 | 217297 | 1093.27 | 852 | 857 | 198.0 |
| C | 3 | 233 | 152122 | 764.06 | 852 | 857 | 198.0 |
| D | 1 | 52 | 534578 | 2531.71 | 873 | 847 | 210.8 |
| D | 7 | 238 | 181304 | 855.98 | 873 | 847 | 210.8 |
| D | 2 | 16 | 137250 | 647.02 | 873 | 847 | 210.8 |
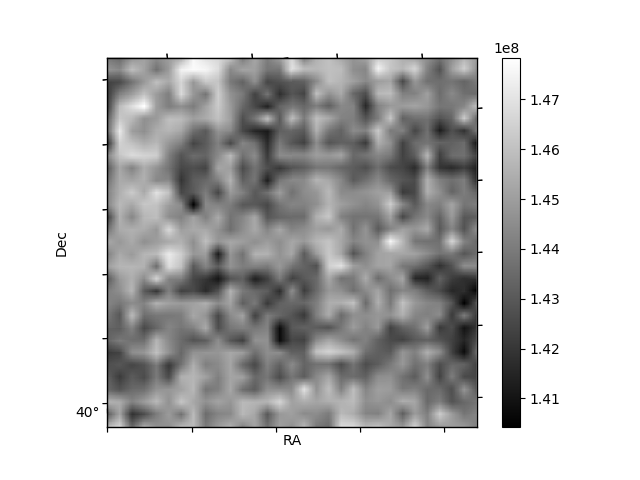
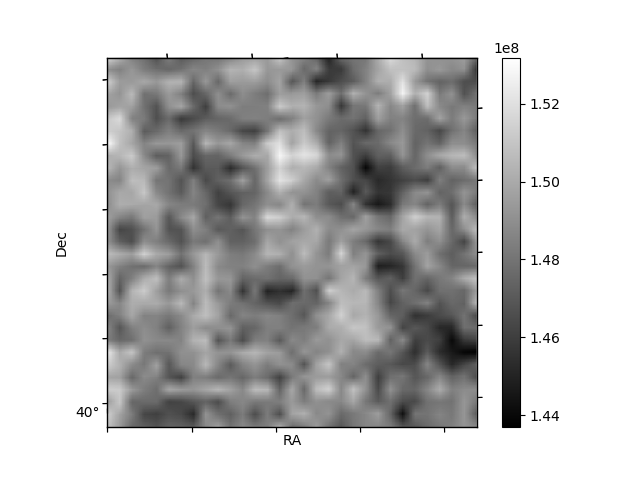
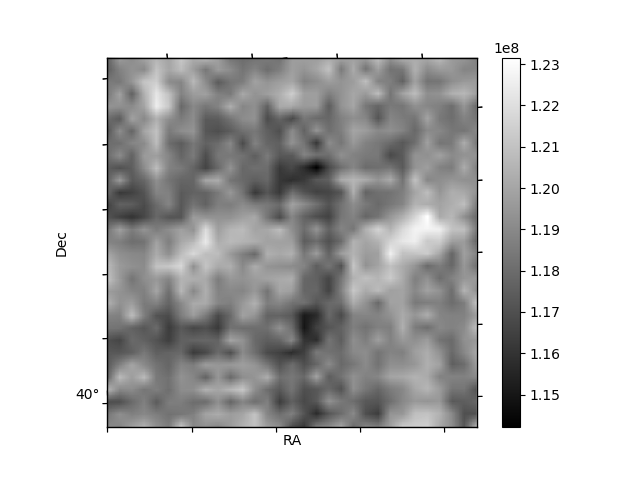
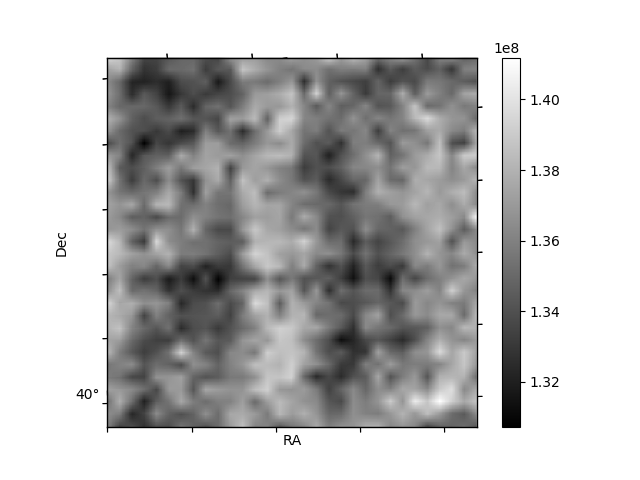
Histogram calculated using DETX and DETY for each event in the final _common_clean file
| Quadrant A | 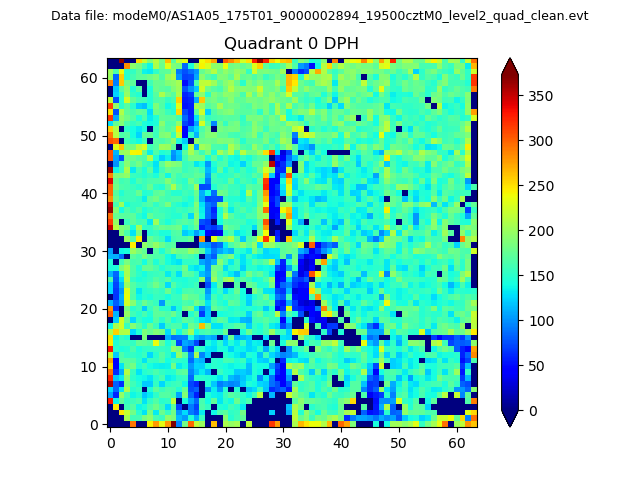 |
 |
Quadrant B |
|---|---|---|---|
| Quadrant D | 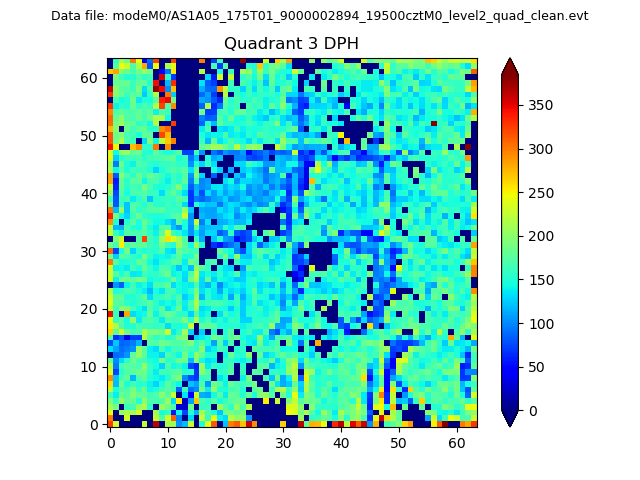 |
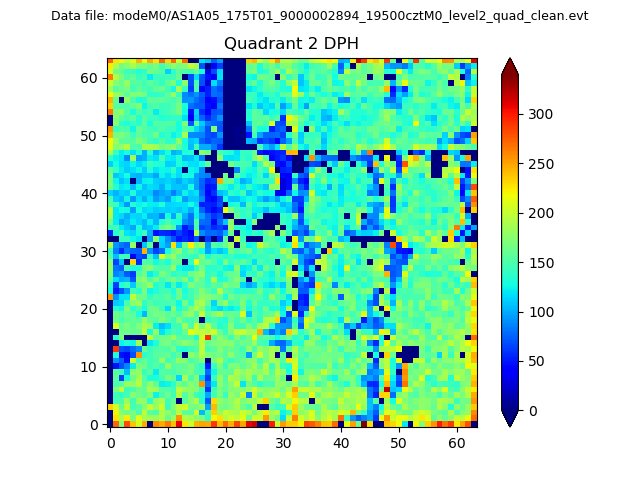 |
Quadrant C |
| Plot type | Count rate plots | Images |
|---|---|---|
| Comparison with Poisson distribution Blue bars denote a histogram of data divided into 1 sec bins. Red curve is a Poisson curve with rate = median count rate of data. |
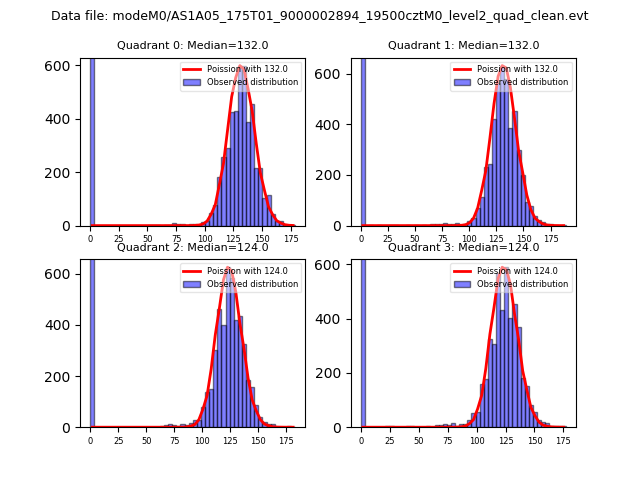 |
 |
| Quadrant-wise count rates Data is divided into 100 sec bins |
 |
|
| Module-wise count rates for Quadrant A Data is divided into 100 sec bins |
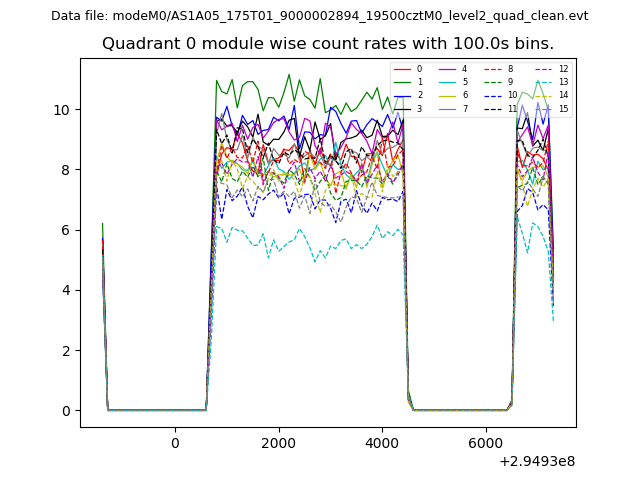 |
 |
| Module-wise count rates for Quadrant B Data is divided into 100 sec bins |
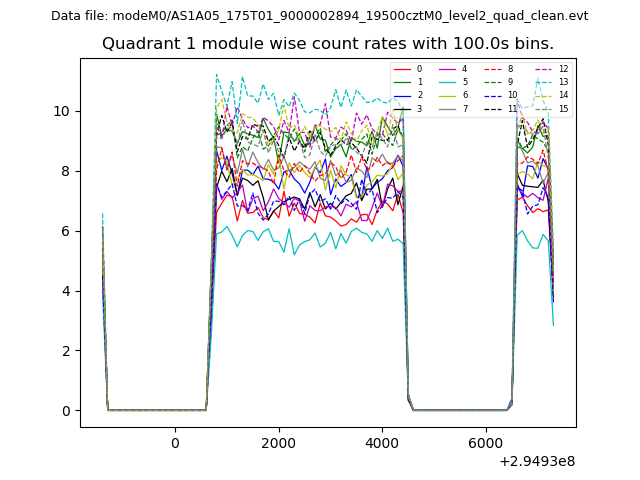 |
 |
| Module-wise count rates for Quadrant C Data is divided into 100 sec bins |
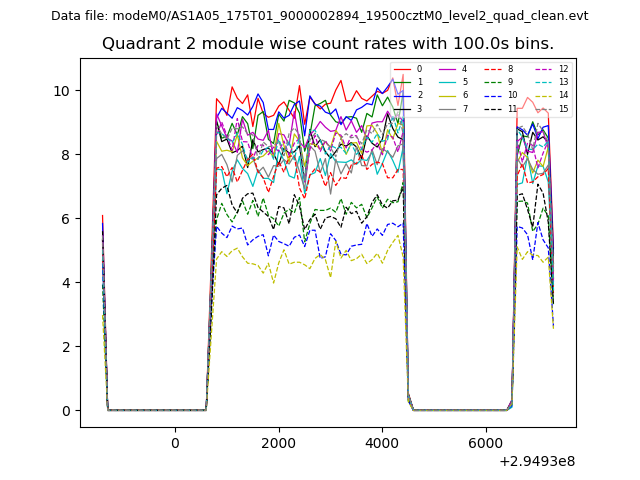 |
 |
| Module-wise count rates for Quadrant D Data is divided into 100 sec bins |
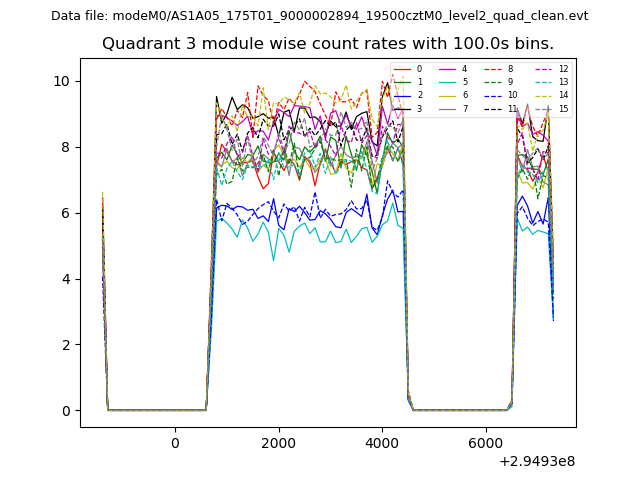 |
 |
| Parameter | Plot |
|---|---|
| CZT HV Monitor | 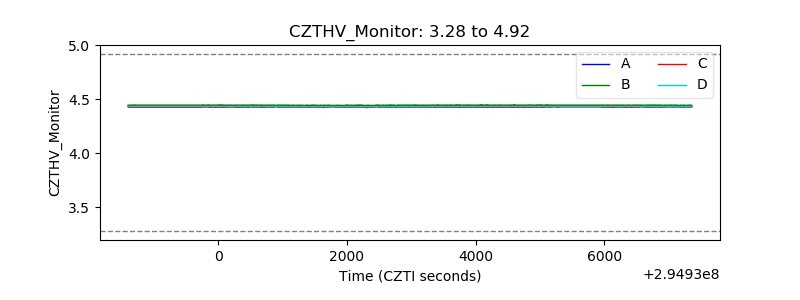 |
| D_VDD | 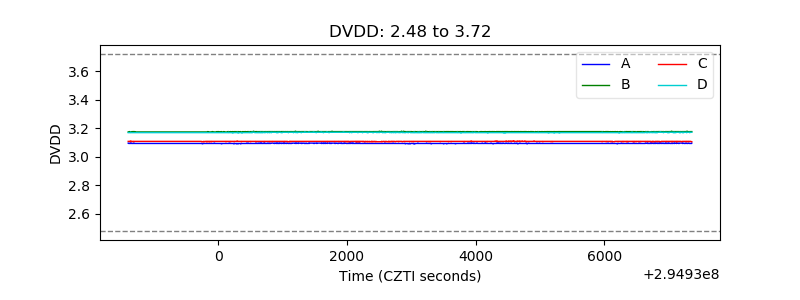 |
| Temperature 1 | 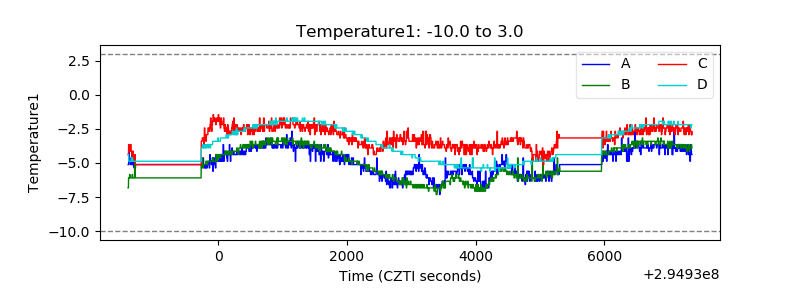 |
| Veto HV Monitor | 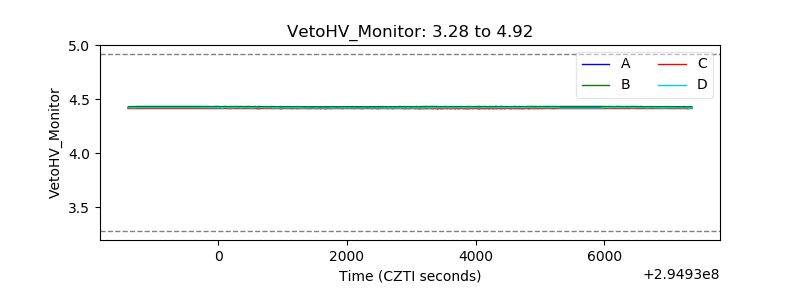 |
| Veto LLD | 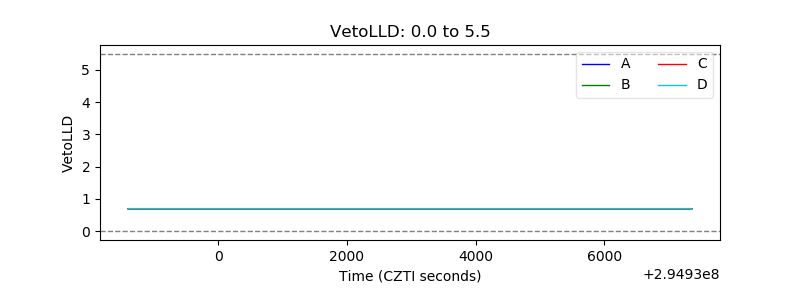 |
| Alpha Counter | 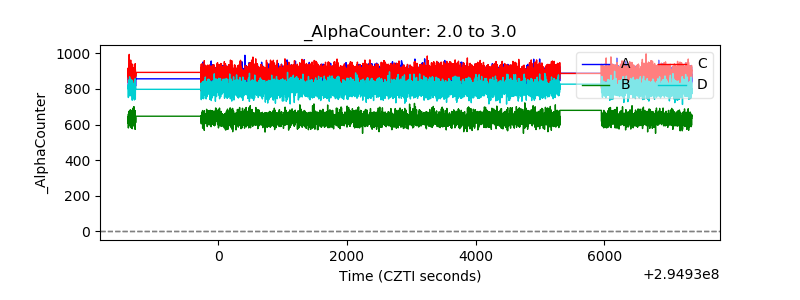 |
| _CPM_Rate | 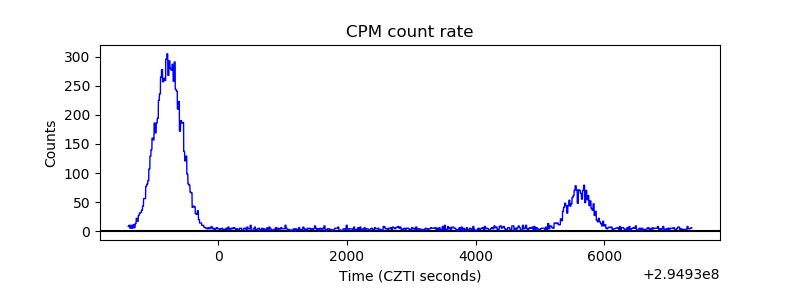 |
| CZT Counter | 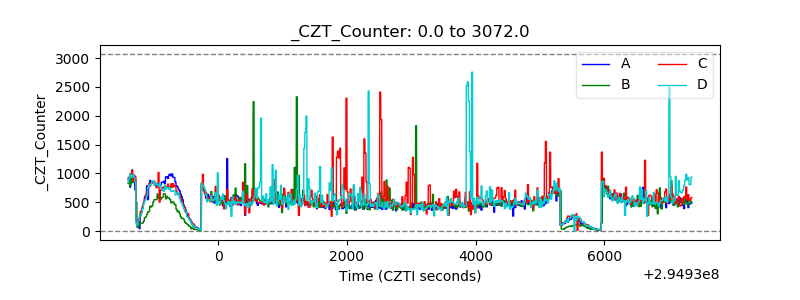 |
| +2.5 Volts monitor |  |
| +5 Volts monitor |  |
| _ROLL_ROT | 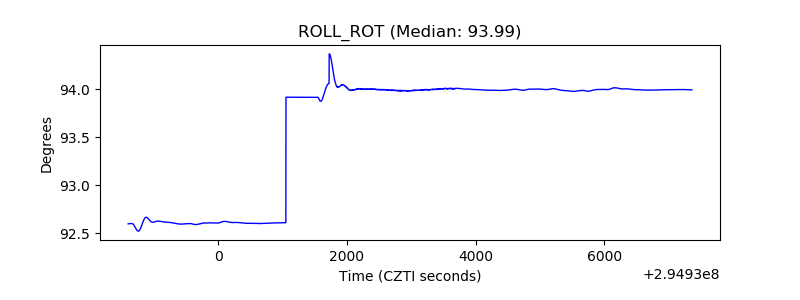 |
| _Roll_DEC | 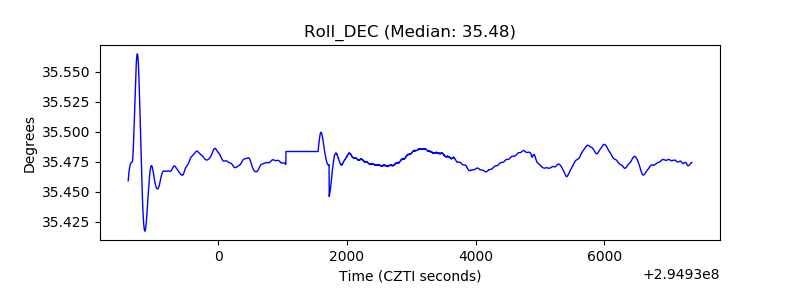 |
| _Roll_RA | 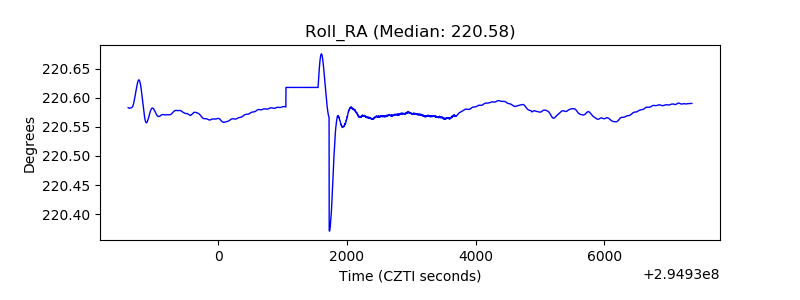 |
| Veto Counter | 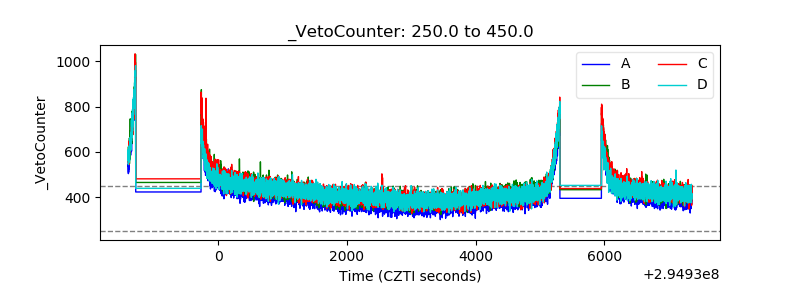 |