| Param | Original file | Final file |
|---|---|---|
| Filename | modeM0/AS1A05_175T01_9000002894_19501cztM0_level2.evt | modeM0/AS1A05_175T01_9000002894_19501cztM0_level2_quad_clean.evt |
| Size (bytes) | 505,529,280 | 98,380,800 |
| Size | 482.1 MB | 93.8 MB |
| Events in quadrant A | 3,249,315 | 642,376 |
| Events in quadrant B | 3,428,667 | 641,113 |
| Events in quadrant C | 3,690,507 | 612,988 |
| Events in quadrant D | 4,475,108 | 604,330 |
| Mode M9 | |||
|---|---|---|---|
| Quadrant | BADHDUFLAG | Total packets | Discarded packets |
| A | 0 | 3 | 0 |
| B | 0 | 3 | 0 |
| C | 0 | 3 | 0 |
| D | 0 | 3 | 0 |
| Mode M0 | |||
|---|---|---|---|
| Quadrant | BADHDUFLAG | Total packets | Discarded packets |
| A | 0 | 14136 | 1 |
| B | 0 | 14556 | 1 |
| C | 0 | 15112 | 1 |
| D | 0 | 18015 | 1 |
| Mode SS | |||
|---|---|---|---|
| Quadrant | BADHDUFLAG | Total packets | Discarded packets |
| A | 0 | 140 | 0 |
| B | 0 | 140 | 0 |
| C | 0 | 140 | 0 |
| D | 0 | 140 | 0 |
| Quadrant | Total seconds | Saturated seconds | Saturation percentage |
|---|---|---|---|
| A | 6867 | 89 | 1.296054% |
| B | 6868 | 132 | 1.921957% |
| C | 6868 | 177 | 2.577169% |
| D | 6868 | 160 | 2.329645% |
Noise dominated data is calculated using 1-second bins in cleaned event files. If a bin has >2000 counts, and if more than 50% of those come from <1% of pixels, then it is considered to be noise-dominated and hence unusable.
| Quadrant | # 1 sec bins | Bins with >0 counts | Bins with >2000 counts | High rate bins dominated by noise | Noise dominated (total time) | Noise dominated (detector-on time) | Marked lightcurve |
|---|---|---|---|---|---|---|---|
| A | 7192 | 6868 | 0 | 0 | 0.00% | 0.00% | 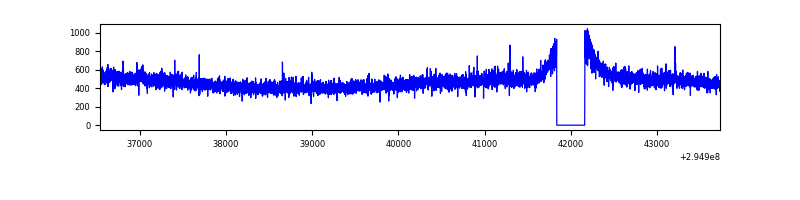 |
| B | 7193 | 6869 | 19 | 19 | 0.26% | 0.28% | 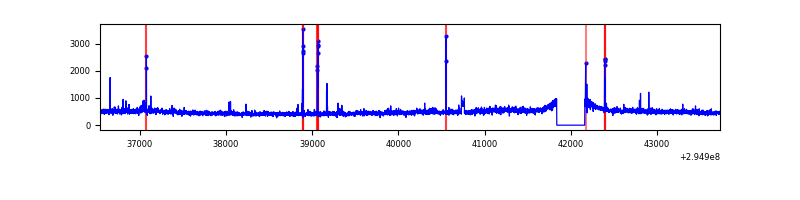 |
| C | 7193 | 6869 | 16 | 16 | 0.22% | 0.23% | 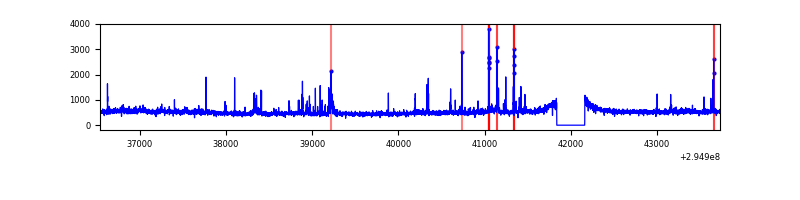 |
| D | 7193 | 6869 | 48 | 48 | 0.67% | 0.70% | 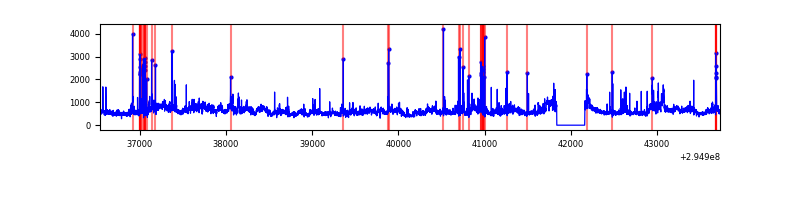 |
Top three noisy pixels from each quadrant. If the there are fewer than three noisy pixels in the level2.evt file, extra rows are filled as -1
| Pixel properties | Quadrant properties | ||||||
|---|---|---|---|---|---|---|---|
| Quadrant | DetID | PixID | Counts | Sigma | Mean | Median | Sigma |
| A | 11 | 47 | 8556 | 45.61 | 838 | 818 | 169.7 |
| A | 0 | 226 | 7310 | 38.27 | 838 | 818 | 169.7 |
| A | 13 | 254 | 6952 | 36.15 | 838 | 818 | 169.7 |
| B | 3 | 64 | 77793 | 479.95 | 827 | 805 | 160.4 |
| B | 0 | 198 | 66381 | 408.8 | 827 | 805 | 160.4 |
| B | 4 | 171 | 28527 | 172.82 | 827 | 805 | 160.4 |
| C | 3 | 233 | 198413 | 1062.77 | 801 | 805 | 185.9 |
| C | 5 | 112 | 193488 | 1036.28 | 801 | 805 | 185.9 |
| C | 14 | 238 | 123407 | 659.37 | 801 | 805 | 185.9 |
| D | 1 | 52 | 920158 | 4668.6 | 813 | 789 | 196.9 |
| D | 2 | 16 | 389979 | 1976.32 | 813 | 789 | 196.9 |
| D | 7 | 238 | 43298 | 215.86 | 813 | 789 | 196.9 |
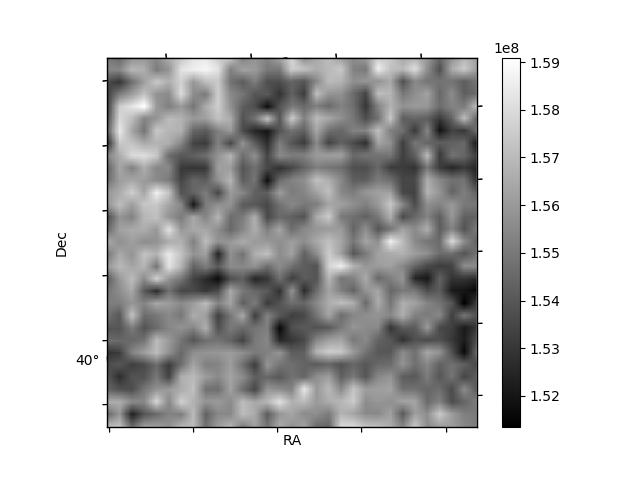
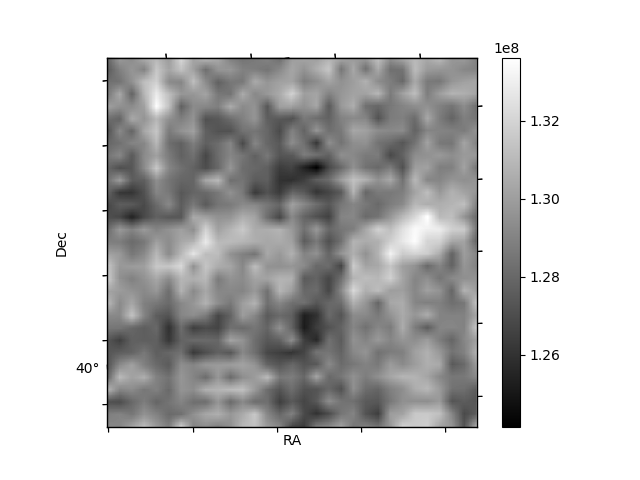
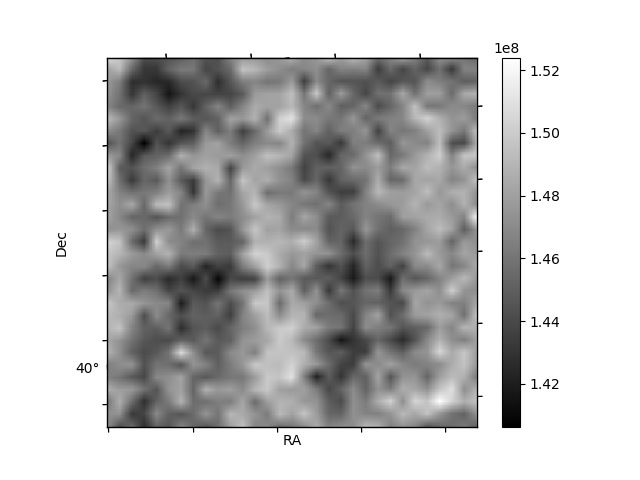
Histogram calculated using DETX and DETY for each event in the final _common_clean file
| Quadrant A | 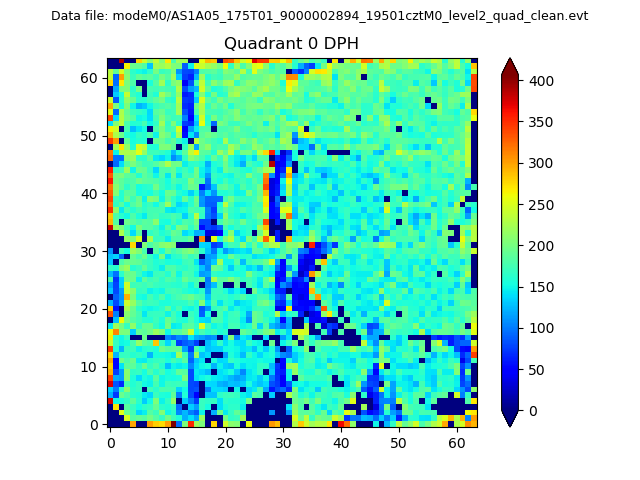 |
 |
Quadrant B |
|---|---|---|---|
| Quadrant D | 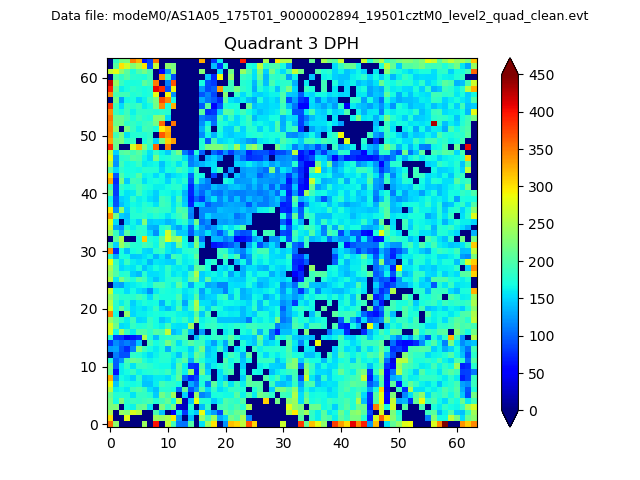 |
 |
Quadrant C |
| Plot type | Count rate plots | Images |
|---|---|---|
| Comparison with Poisson distribution Blue bars denote a histogram of data divided into 1 sec bins. Red curve is a Poisson curve with rate = median count rate of data. |
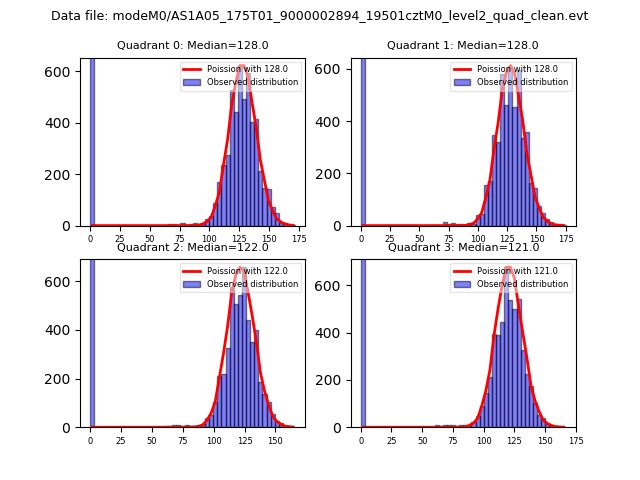 |
 |
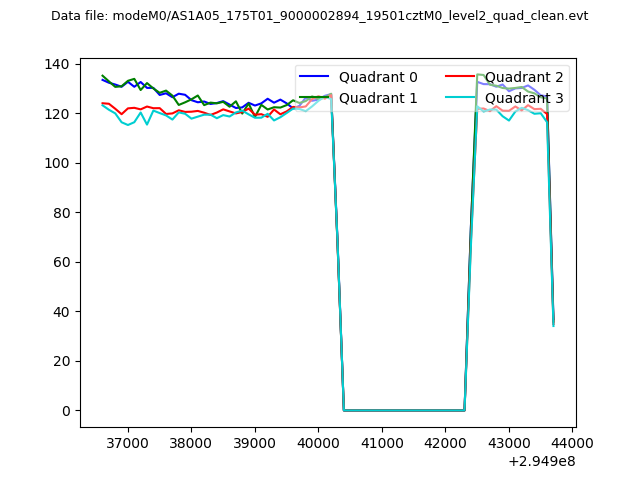
| Quadrant-wise count rates Data is divided into 100 sec bins |
 |
|
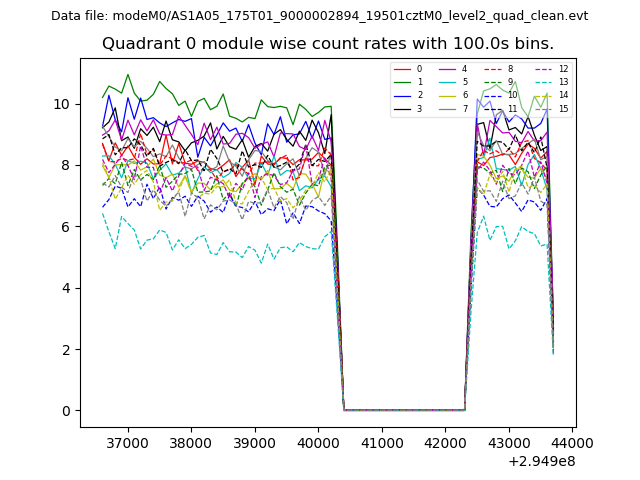
| Module-wise count rates for Quadrant A Data is divided into 100 sec bins |
 |
 |
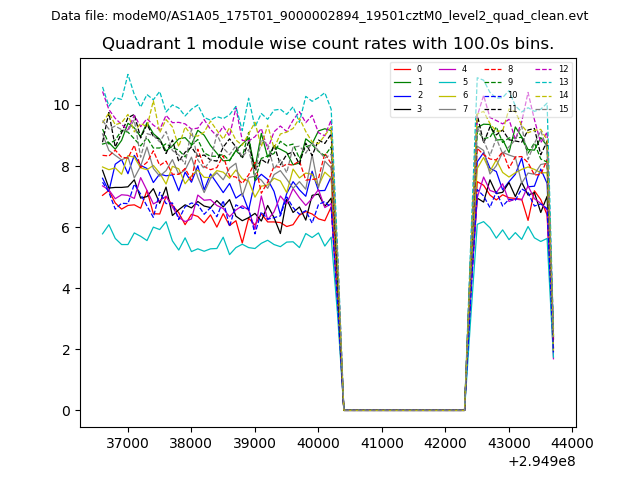
| Module-wise count rates for Quadrant B Data is divided into 100 sec bins |
 |
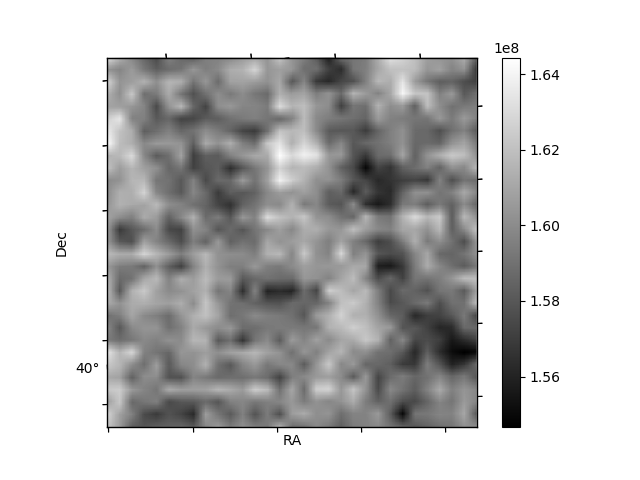 |
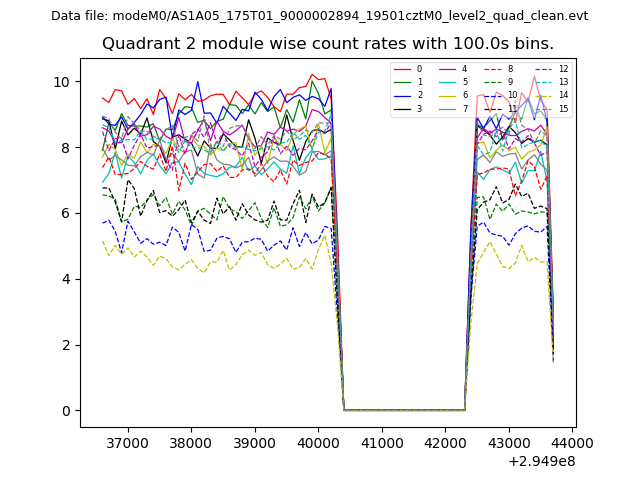
| Module-wise count rates for Quadrant C Data is divided into 100 sec bins |
 |
 |
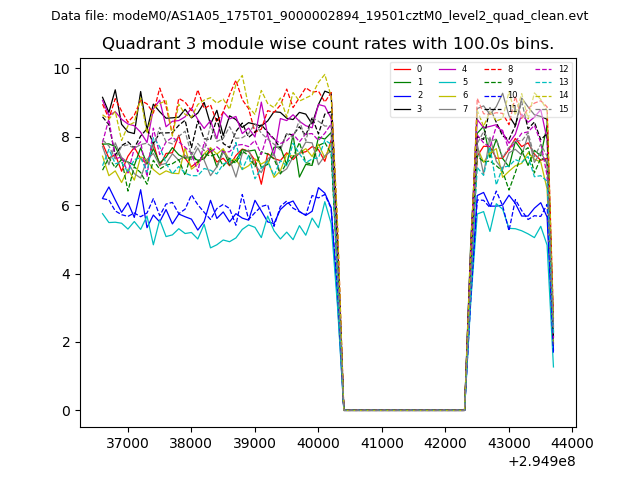
| Module-wise count rates for Quadrant D Data is divided into 100 sec bins |
 |
 |
| Parameter | Plot |
|---|---|
| CZT HV Monitor | 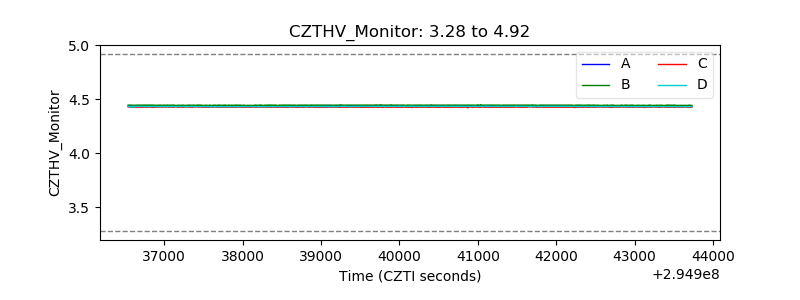 |
| D_VDD | 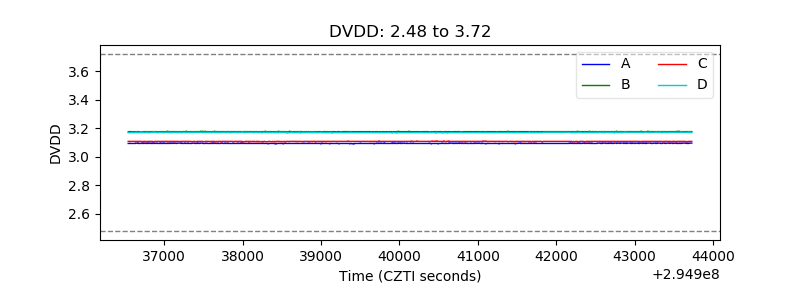 |
| Temperature 1 | 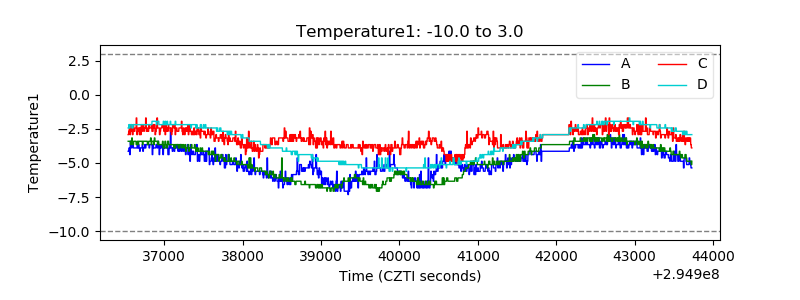 |
| Veto HV Monitor | 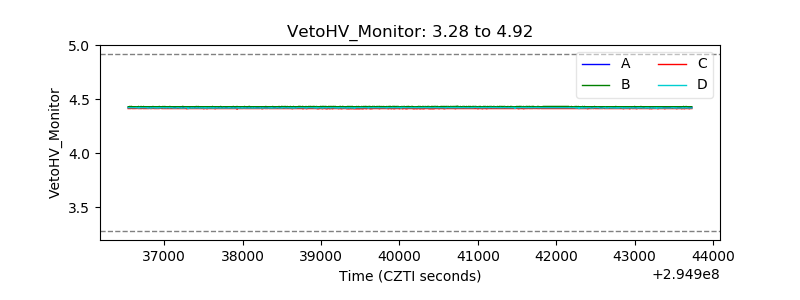 |
| Veto LLD | 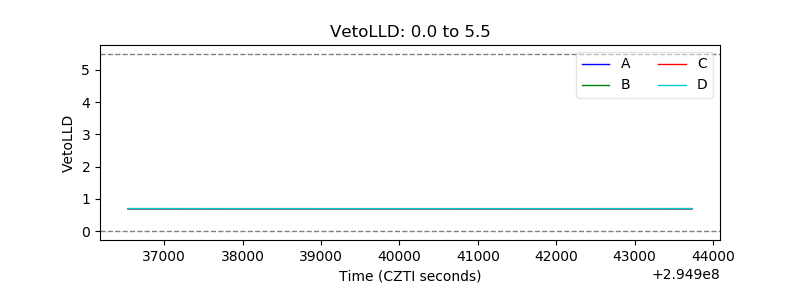 |
| Alpha Counter | 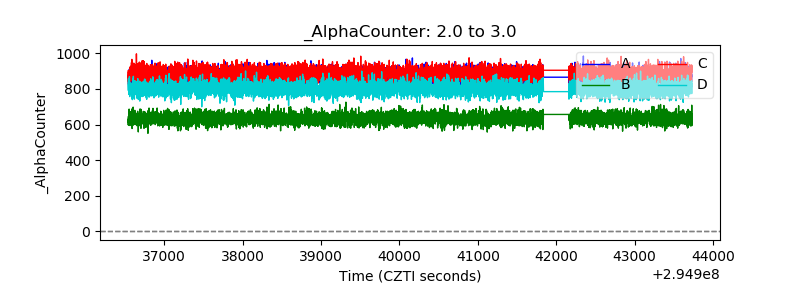 |
| _CPM_Rate | 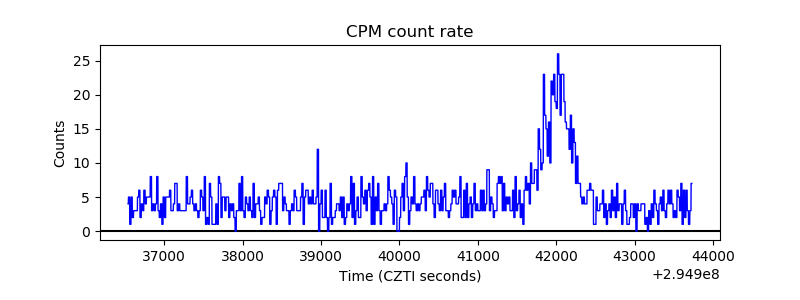 |
| CZT Counter | 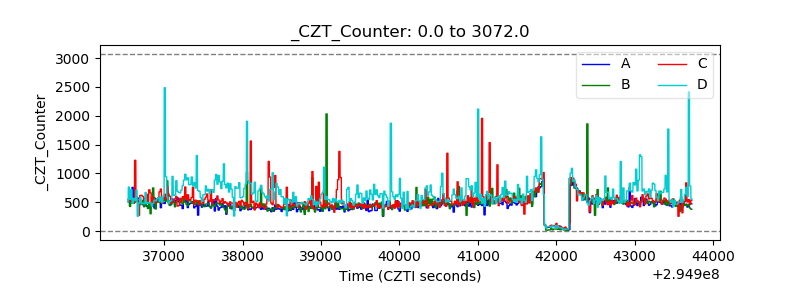 |
| +2.5 Volts monitor |  |
| +5 Volts monitor |  |
| _ROLL_ROT | 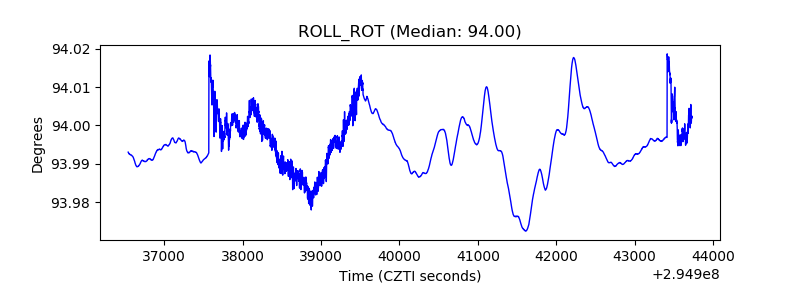 |
| _Roll_DEC | 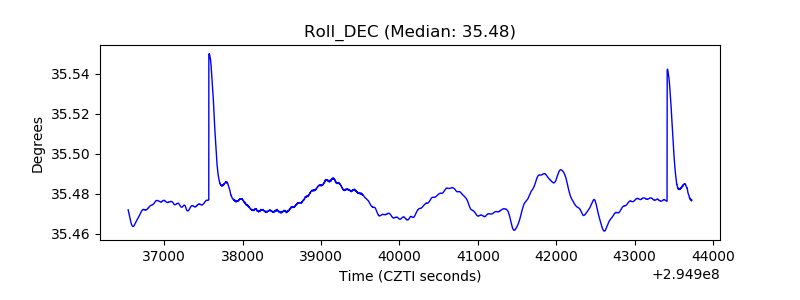 |
| _Roll_RA | 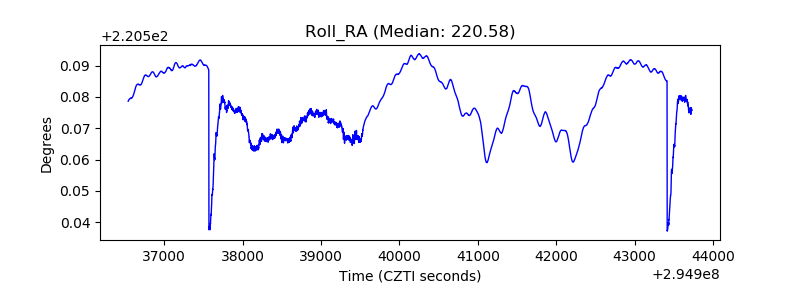 |
| Veto Counter | 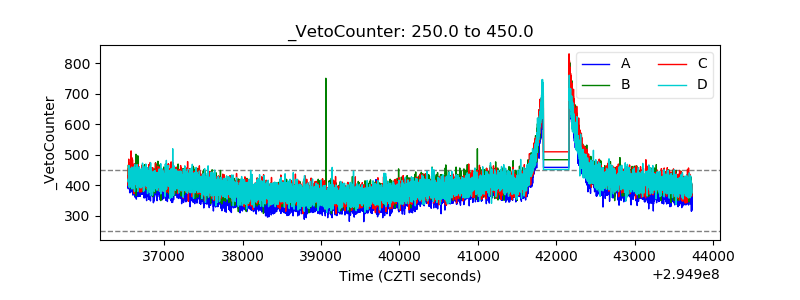 |