| Param | Original file | Final file |
|---|---|---|
| Filename | modeM0/AS1A05_175T01_9000002894_19502cztM0_level2.evt | modeM0/AS1A05_175T01_9000002894_19502cztM0_level2_quad_clean.evt |
| Size (bytes) | 544,754,880 | 104,083,200 |
| Size | 519.5 MB | 99.3 MB |
| Events in quadrant A | 3,745,208 | 669,564 |
| Events in quadrant B | 3,805,407 | 671,655 |
| Events in quadrant C | 4,269,892 | 639,643 |
| Events in quadrant D | 4,154,822 | 635,828 |
| Mode M9 | |||
|---|---|---|---|
| Quadrant | BADHDUFLAG | Total packets | Discarded packets |
| A | 0 | 6 | 0 |
| B | 0 | 6 | 0 |
| C | 0 | 6 | 0 |
| D | 0 | 6 | 0 |
| Mode M0 | |||
|---|---|---|---|
| Quadrant | BADHDUFLAG | Total packets | Discarded packets |
| A | 0 | 16184 | 2 |
| B | 0 | 16314 | 2 |
| C | 0 | 17336 | 3 |
| D | 0 | 17483 | 2 |
| Mode SS | |||
|---|---|---|---|
| Quadrant | BADHDUFLAG | Total packets | Discarded packets |
| A | 0 | 160 | 0 |
| B | 0 | 160 | 0 |
| C | 0 | 160 | 0 |
| D | 0 | 160 | 0 |
| Quadrant | Total seconds | Saturated seconds | Saturation percentage |
|---|---|---|---|
| A | 7697 | 156 | 2.026764% |
| B | 7698 | 202 | 2.624058% |
| C | 7697 | 330 | 4.287385% |
| D | 7697 | 185 | 2.403534% |
Noise dominated data is calculated using 1-second bins in cleaned event files. If a bin has >2000 counts, and if more than 50% of those come from <1% of pixels, then it is considered to be noise-dominated and hence unusable.
| Quadrant | # 1 sec bins | Bins with >0 counts | Bins with >2000 counts | High rate bins dominated by noise | Noise dominated (total time) | Noise dominated (detector-on time) | Marked lightcurve |
|---|---|---|---|---|---|---|---|
| A | 8312 | 7699 | 0 | 0 | 0.00% | 0.00% | 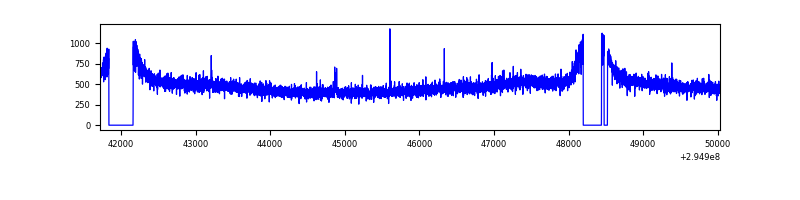 |
| B | 8313 | 7701 | 7 | 7 | 0.08% | 0.09% | 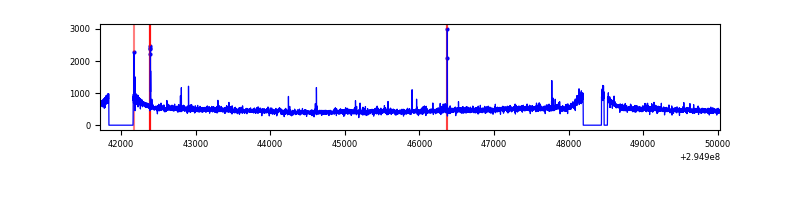 |
| C | 8312 | 7700 | 31 | 31 | 0.37% | 0.40% | 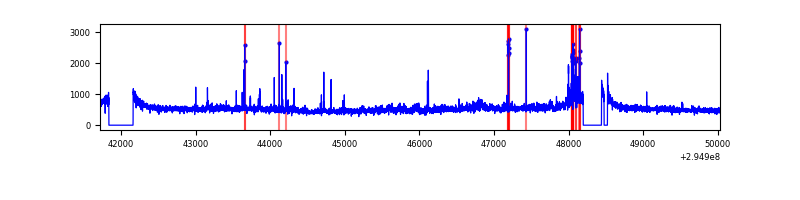 |
| D | 8312 | 7699 | 25 | 25 | 0.30% | 0.32% | 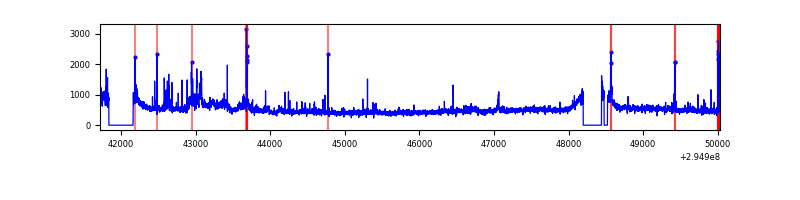 |
Top three noisy pixels from each quadrant. If the there are fewer than three noisy pixels in the level2.evt file, extra rows are filled as -1
| Pixel properties | Quadrant properties | ||||||
|---|---|---|---|---|---|---|---|
| Quadrant | DetID | PixID | Counts | Sigma | Mean | Median | Sigma |
| A | 11 | 47 | 35132 | 175.05 | 960 | 937 | 195.3 |
| A | 3 | 137 | 8174 | 37.05 | 960 | 937 | 195.3 |
| A | 0 | 226 | 8054 | 36.43 | 960 | 937 | 195.3 |
| B | 3 | 64 | 32447 | 172.03 | 947 | 920 | 183.3 |
| B | 0 | 198 | 27562 | 145.37 | 947 | 920 | 183.3 |
| B | 12 | 111 | 22991 | 120.43 | 947 | 920 | 183.3 |
| C | 3 | 233 | 395473 | 1827.7 | 914 | 920 | 215.9 |
| C | 5 | 112 | 145200 | 668.35 | 914 | 920 | 215.9 |
| C | 14 | 238 | 140924 | 648.55 | 914 | 920 | 215.9 |
| D | 1 | 52 | 341903 | 1494.28 | 937 | 908 | 228.2 |
| D | 2 | 16 | 193448 | 843.73 | 937 | 908 | 228.2 |
| D | 7 | 238 | 35003 | 149.41 | 937 | 908 | 228.2 |
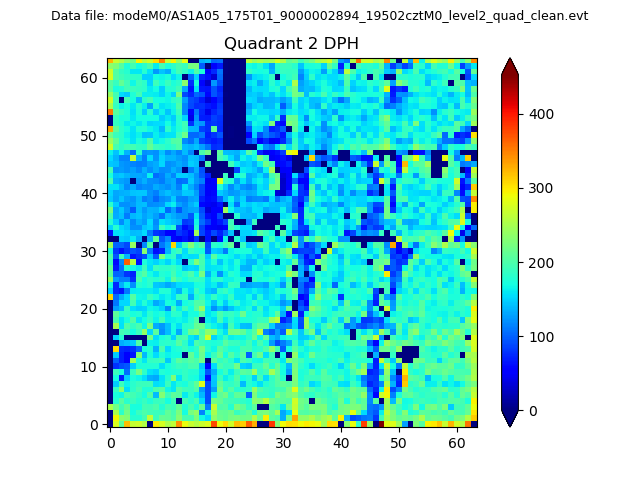
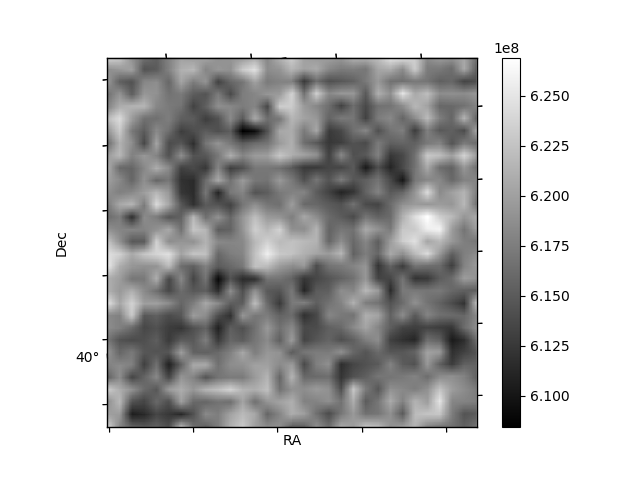
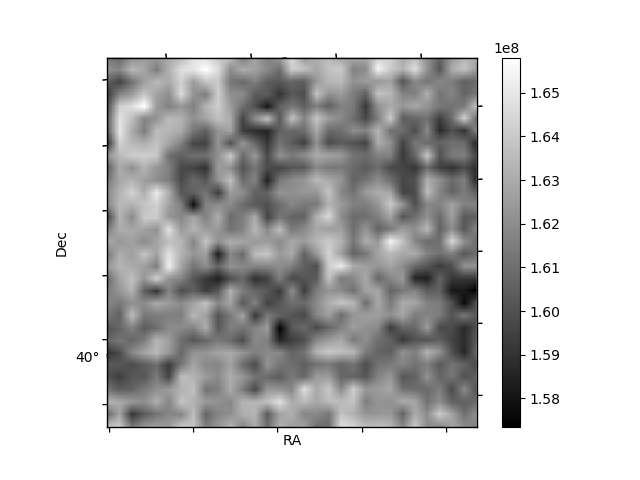
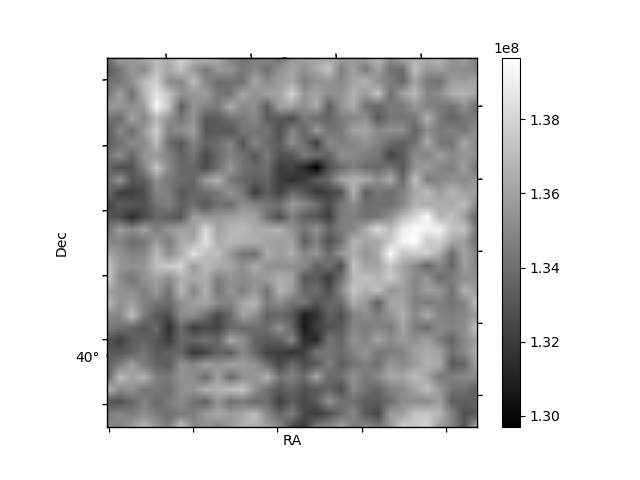
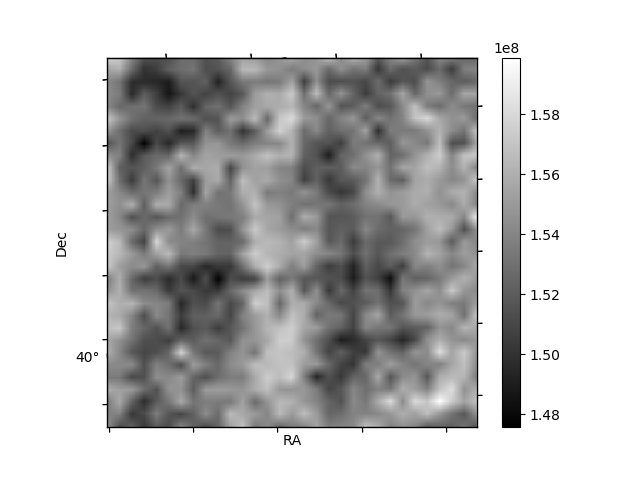
Histogram calculated using DETX and DETY for each event in the final _common_clean file
| Quadrant A | 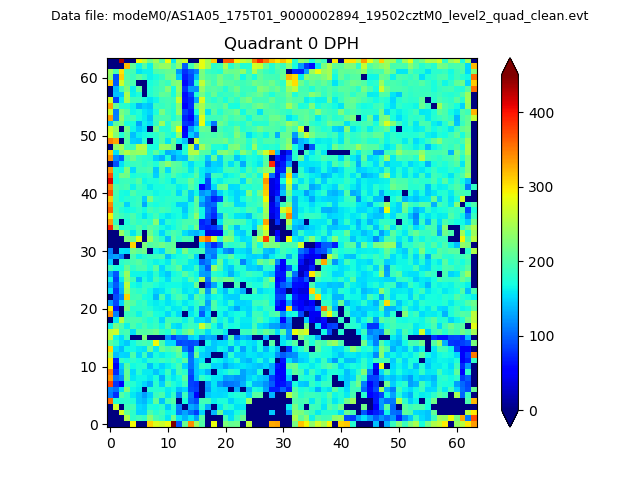 |
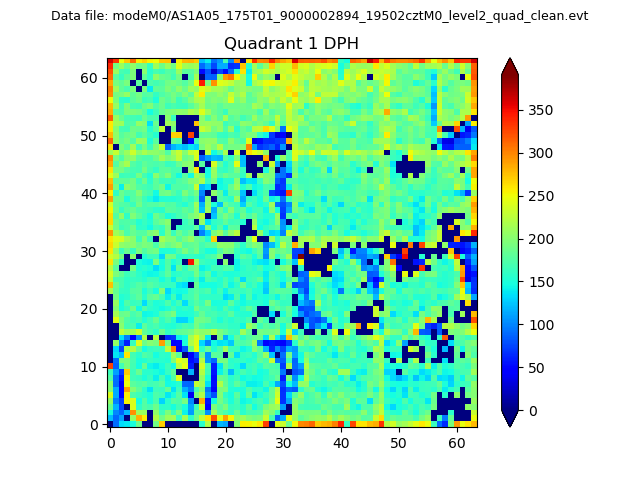 |
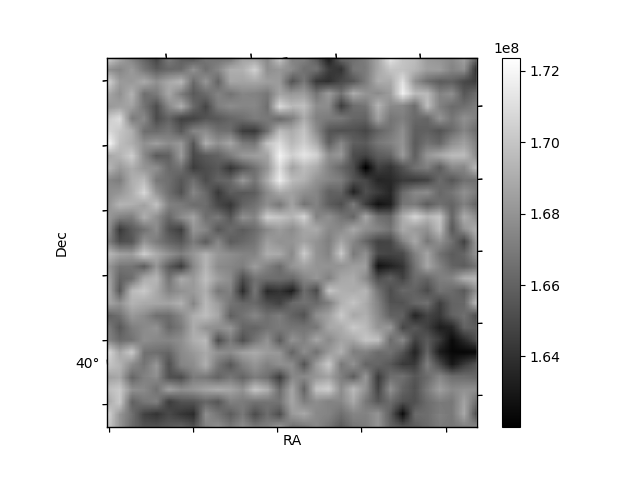
Quadrant B |
|---|---|---|---|
| Quadrant D | 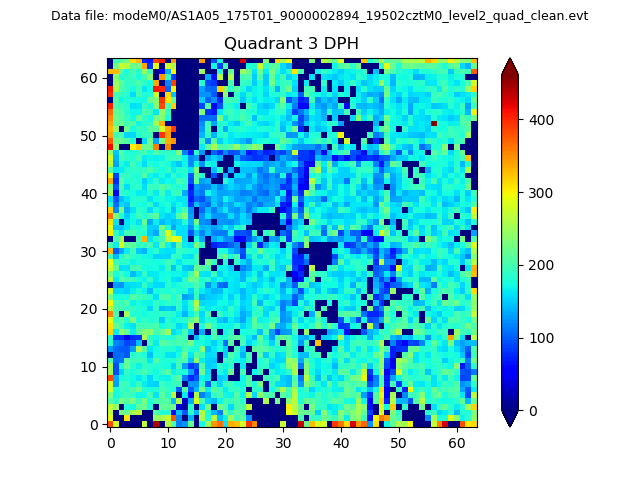 |
 |
Quadrant C |
| Plot type | Count rate plots | Images |
|---|---|---|
| Comparison with Poisson distribution Blue bars denote a histogram of data divided into 1 sec bins. Red curve is a Poisson curve with rate = median count rate of data. |
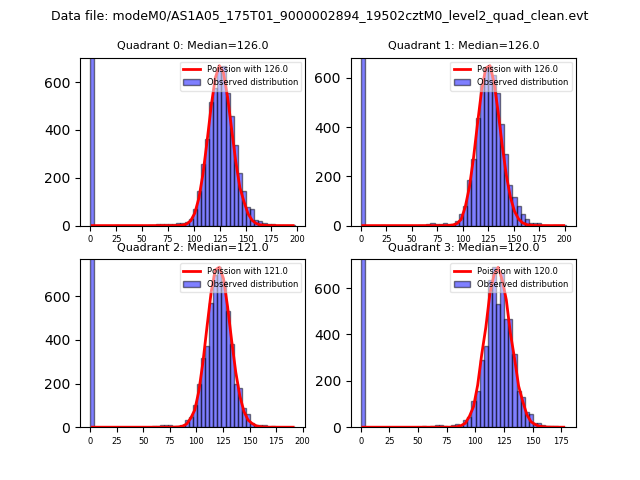 |
 |
| Quadrant-wise count rates Data is divided into 100 sec bins |
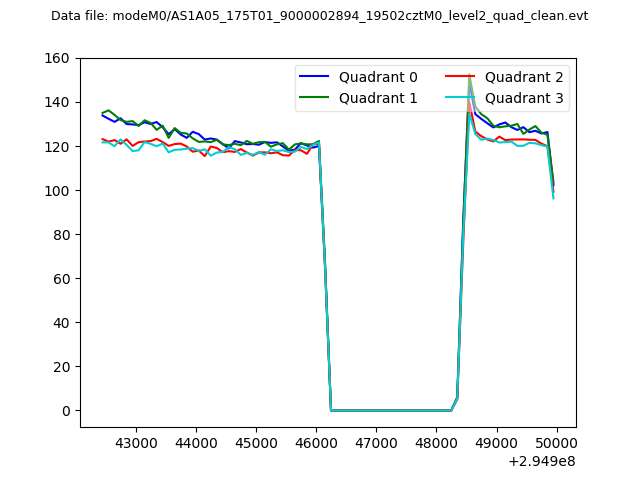 |
|
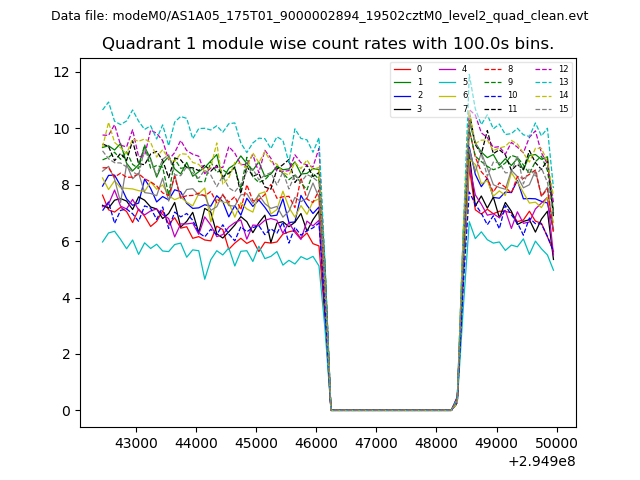
| Module-wise count rates for Quadrant A Data is divided into 100 sec bins |
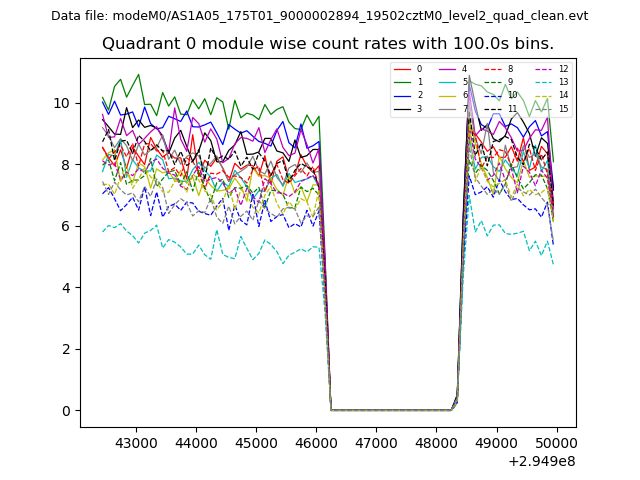 |
 |
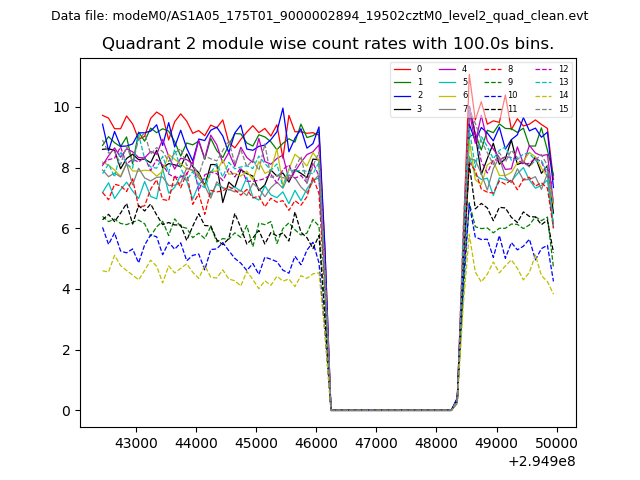
| Module-wise count rates for Quadrant B Data is divided into 100 sec bins |
 |
 |
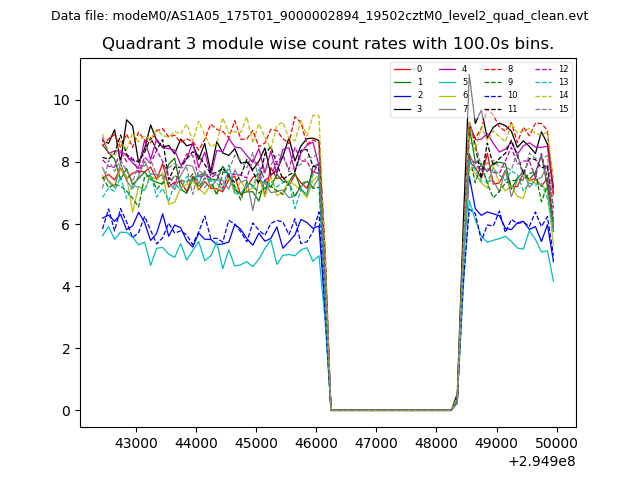
| Module-wise count rates for Quadrant C Data is divided into 100 sec bins |
 |
 |
| Module-wise count rates for Quadrant D Data is divided into 100 sec bins |
 |
 |
| Parameter | Plot |
|---|---|
| CZT HV Monitor | 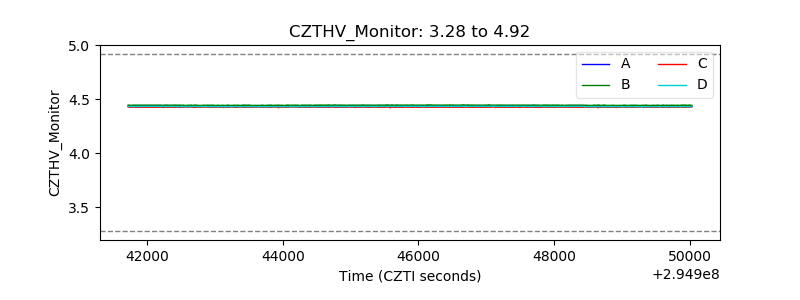 |
| D_VDD | 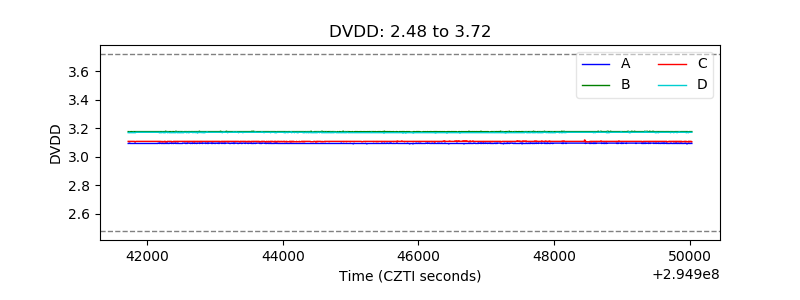 |
| Temperature 1 | 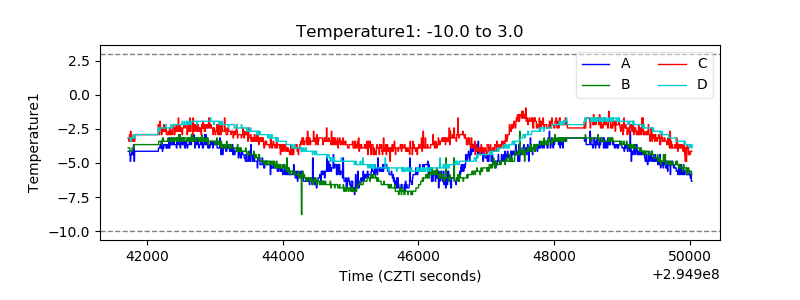 |
| Veto HV Monitor |  |
| Veto LLD | 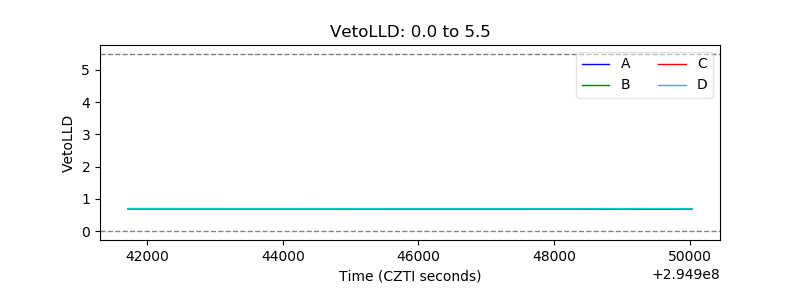 |
| Alpha Counter |  |
| _CPM_Rate |  |
| CZT Counter | 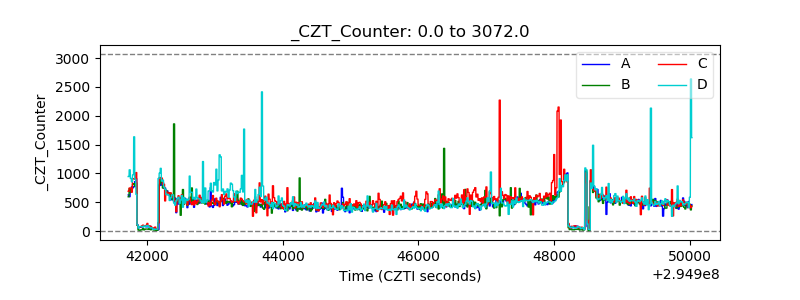 |
| +2.5 Volts monitor | 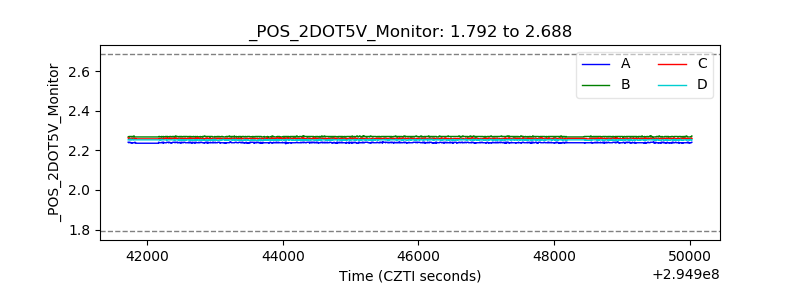 |
| +5 Volts monitor |  |
| _ROLL_ROT | 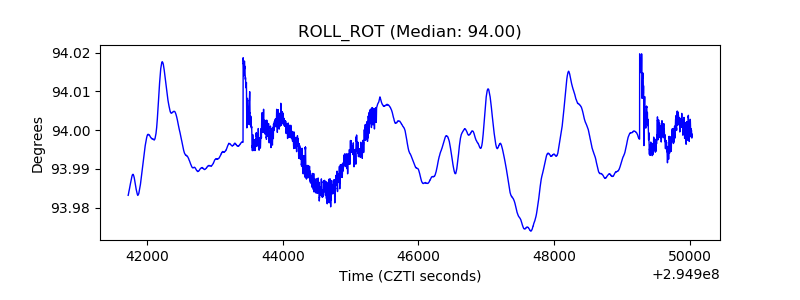 |
| _Roll_DEC | 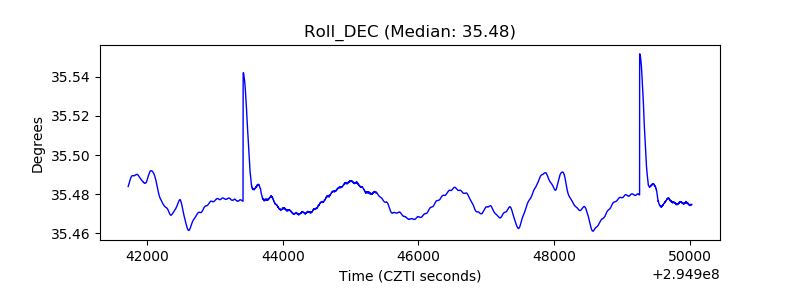 |
| _Roll_RA | 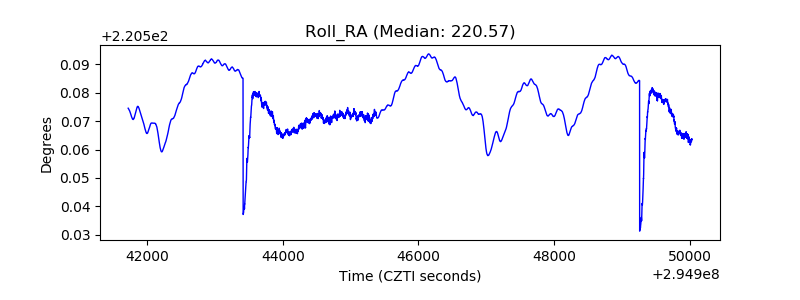 |
| Veto Counter | 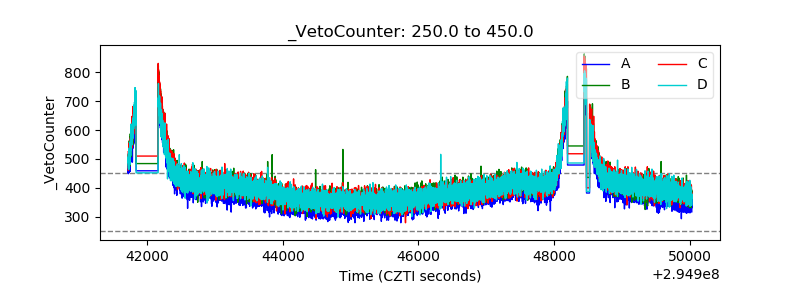 |