| Param | Original file | Final file |
|---|---|---|
| Filename | modeM0/AS1A05_175T01_9000002894_19505cztM0_level2.evt | modeM0/AS1A05_175T01_9000002894_19505cztM0_level2_quad_clean.evt |
| Size (bytes) | 1,270,232,640 | 242,064,000 |
| Size | 1.2 GB | 230.9 MB |
| Events in quadrant A | 8,494,973 | 1,543,634 |
| Events in quadrant B | 9,431,559 | 1,546,819 |
| Events in quadrant C | 9,180,549 | 1,495,063 |
| Events in quadrant D | 10,101,994 | 1,462,525 |
| Mode M9 | |||
|---|---|---|---|
| Quadrant | BADHDUFLAG | Total packets | Discarded packets |
| A | 0 | 18 | 0 |
| B | 0 | 18 | 0 |
| C | 0 | 18 | 0 |
| D | 0 | 18 | 0 |
| Mode M0 | |||
|---|---|---|---|
| Quadrant | BADHDUFLAG | Total packets | Discarded packets |
| A | 0 | 38115 | 4 |
| B | 0 | 40539 | 4 |
| C | 0 | 39141 | 4 |
| D | 0 | 43215 | 4 |
| Mode SS | |||
|---|---|---|---|
| Quadrant | BADHDUFLAG | Total packets | Discarded packets |
| A | 0 | 380 | 0 |
| B | 0 | 380 | 0 |
| C | 0 | 380 | 0 |
| D | 0 | 380 | 0 |
| Quadrant | Total seconds | Saturated seconds | Saturation percentage |
|---|---|---|---|
| A | 18621 | 82 | 0.440363% |
| B | 18622 | 360 | 1.933197% |
| C | 18622 | 205 | 1.100848% |
| D | 18622 | 544 | 2.921276% |
Noise dominated data is calculated using 1-second bins in cleaned event files. If a bin has >2000 counts, and if more than 50% of those come from <1% of pixels, then it is considered to be noise-dominated and hence unusable.
| Quadrant | # 1 sec bins | Bins with >0 counts | Bins with >2000 counts | High rate bins dominated by noise | Noise dominated (total time) | Noise dominated (detector-on time) | Marked lightcurve |
|---|---|---|---|---|---|---|---|
| A | 20431 | 18624 | 0 | 0 | 0.00% | 0.00% | 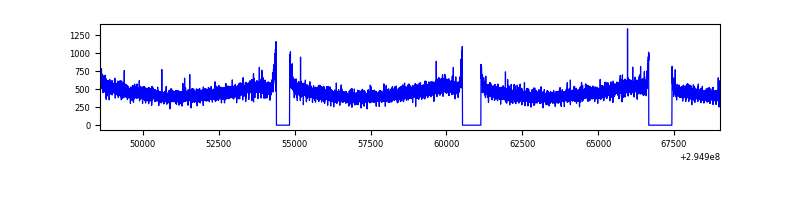 |
| B | 20432 | 18625 | 210 | 210 | 1.03% | 1.13% | 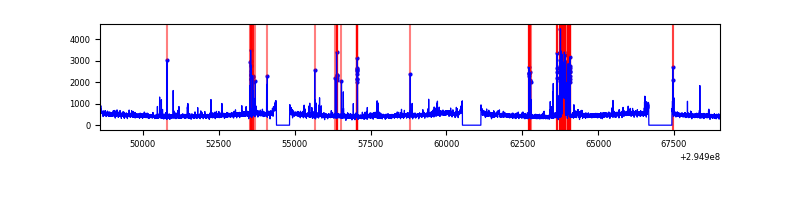 |
| C | 20432 | 18625 | 1 | 1 | 0.00% | 0.01% | 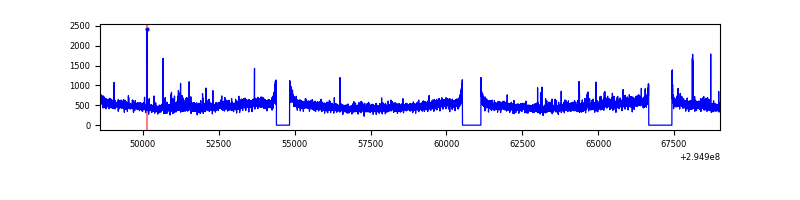 |
| D | 20432 | 18624 | 450 | 450 | 2.20% | 2.42% | 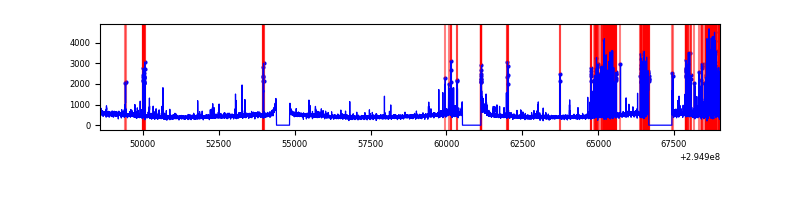 |
Top three noisy pixels from each quadrant. If the there are fewer than three noisy pixels in the level2.evt file, extra rows are filled as -1
| Pixel properties | Quadrant properties | ||||||
|---|---|---|---|---|---|---|---|
| Quadrant | DetID | PixID | Counts | Sigma | Mean | Median | Sigma |
| A | 11 | 47 | 38534 | 82.31 | 2193 | 2148 | 442.1 |
| A | 0 | 226 | 18773 | 37.61 | 2193 | 2148 | 442.1 |
| A | 3 | 137 | 18368 | 36.69 | 2193 | 2148 | 442.1 |
| B | 3 | 64 | 731675 | 1752.56 | 2174 | 2114 | 416.3 |
| B | 12 | 111 | 51721 | 119.17 | 2174 | 2114 | 416.3 |
| B | 11 | 111 | 45394 | 103.97 | 2174 | 2114 | 416.3 |
| C | 3 | 233 | 392761 | 790.4 | 2111 | 2124 | 494.2 |
| C | 14 | 238 | 326126 | 655.57 | 2111 | 2124 | 494.2 |
| C | 9 | 221 | 194453 | 389.15 | 2111 | 2124 | 494.2 |
| D | 1 | 52 | 946808 | 1846.61 | 2115 | 2054 | 511.6 |
| D | 12 | 218 | 702355 | 1368.8 | 2115 | 2054 | 511.6 |
| D | 2 | 16 | 164607 | 317.72 | 2115 | 2054 | 511.6 |
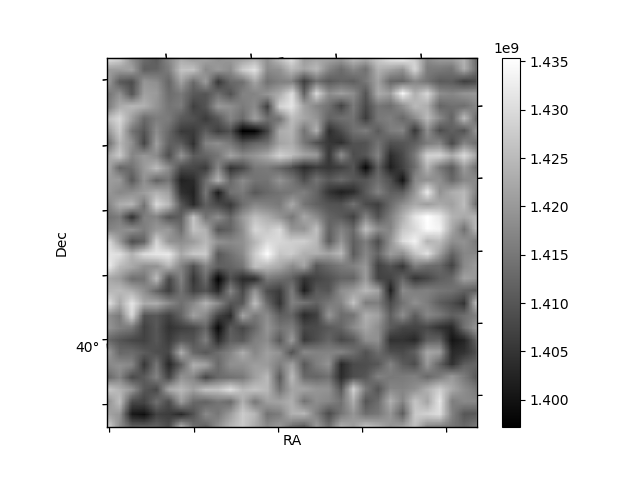
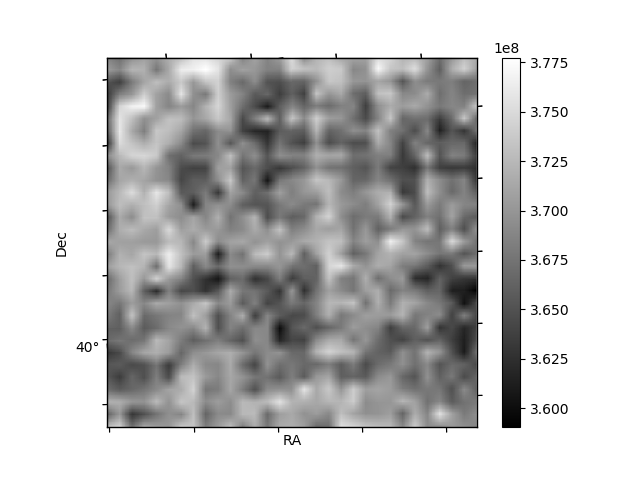
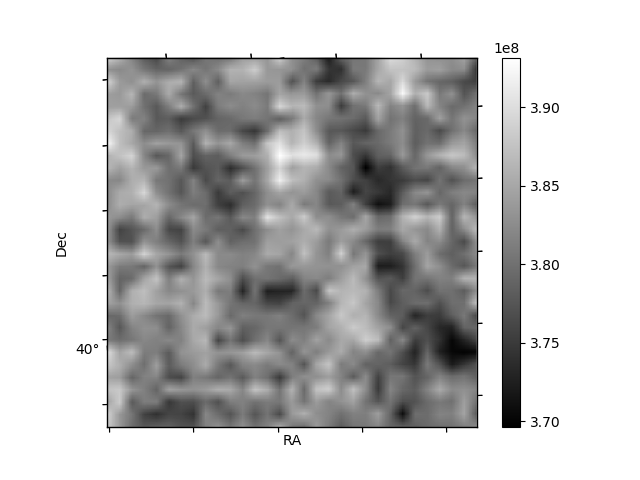
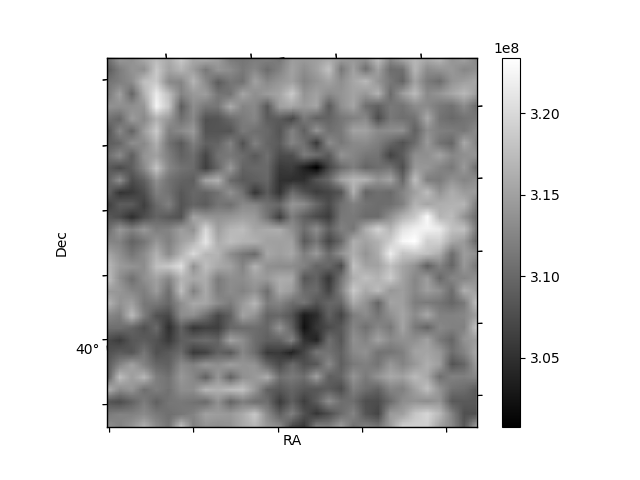
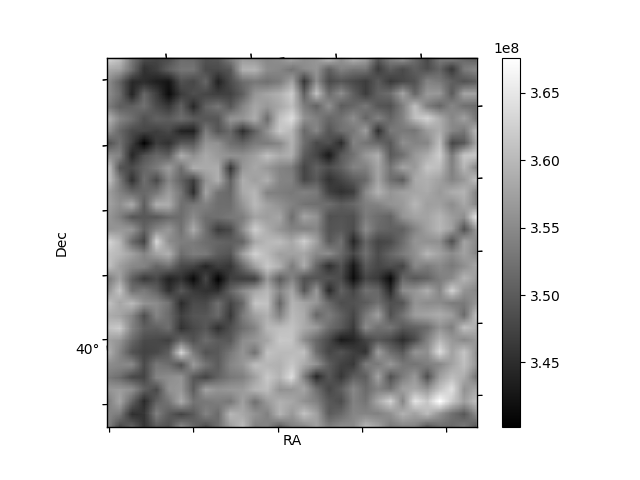
Histogram calculated using DETX and DETY for each event in the final _common_clean file
| Quadrant A | 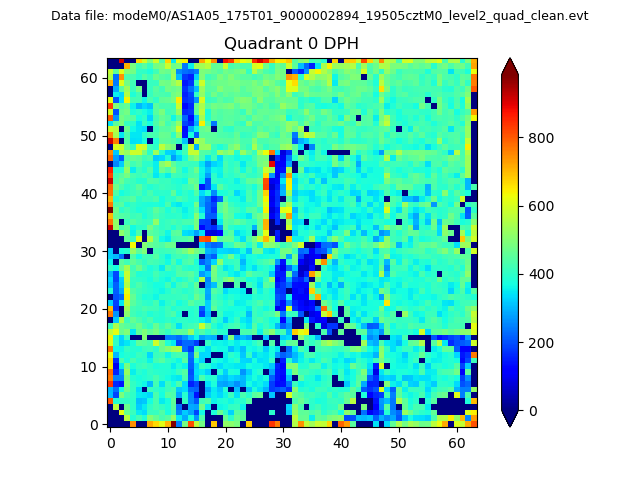 |
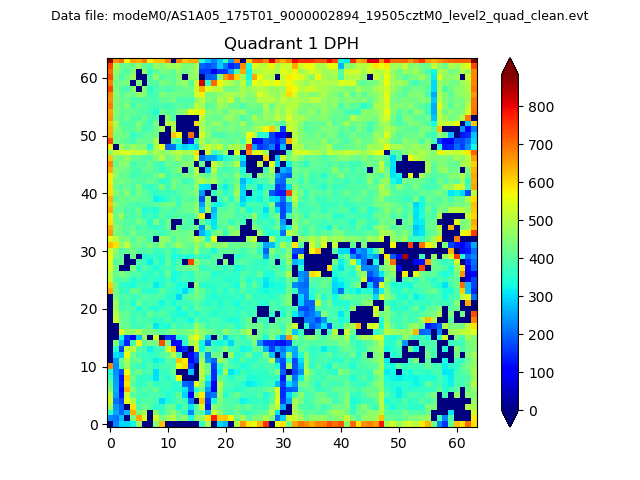 |
Quadrant B |
|---|---|---|---|
| Quadrant D |  |
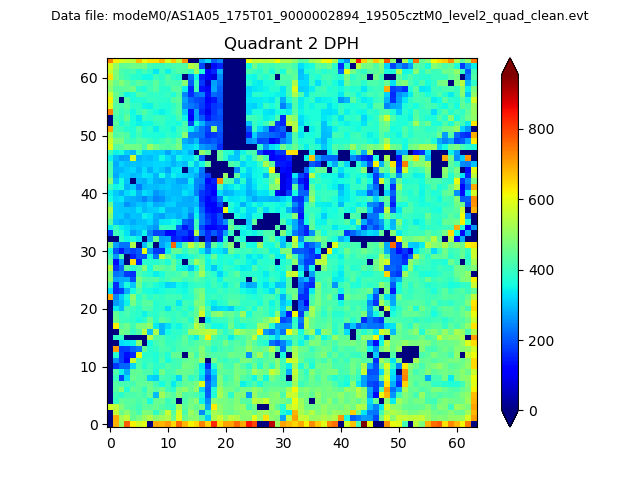 |
Quadrant C |
| Plot type | Count rate plots | Images |
|---|---|---|
| Comparison with Poisson distribution Blue bars denote a histogram of data divided into 1 sec bins. Red curve is a Poisson curve with rate = median count rate of data. |
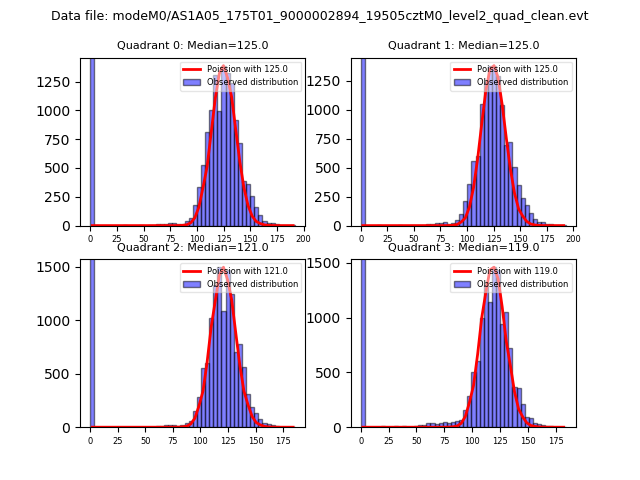 |
 |
| Quadrant-wise count rates Data is divided into 100 sec bins |
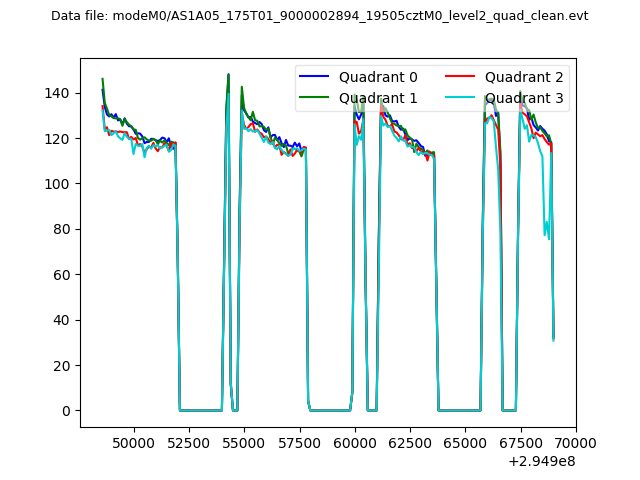 |
|
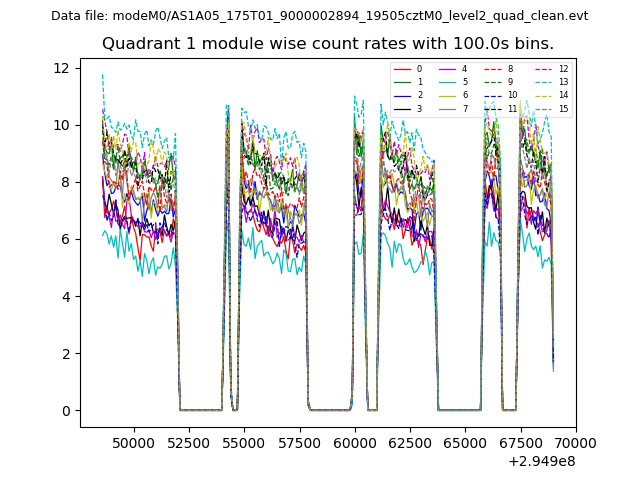
| Module-wise count rates for Quadrant A Data is divided into 100 sec bins |
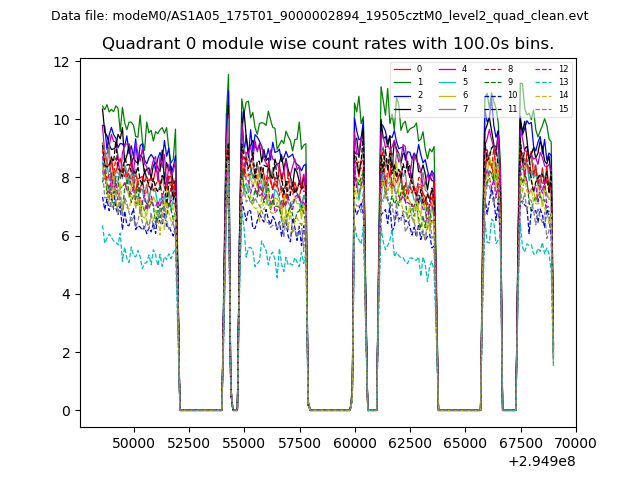 |
 |
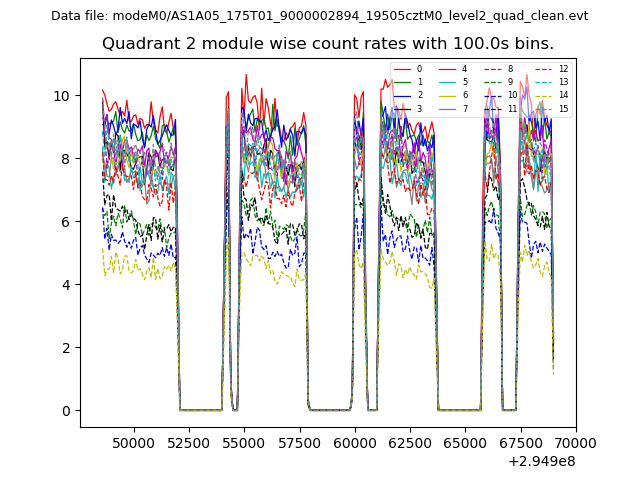
| Module-wise count rates for Quadrant B Data is divided into 100 sec bins |
 |
 |
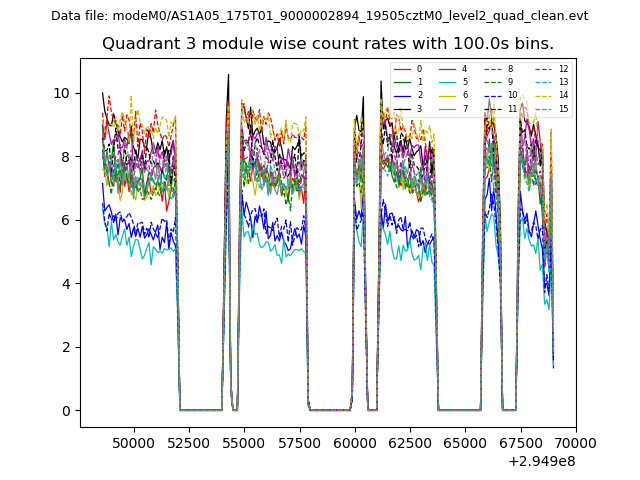
| Module-wise count rates for Quadrant C Data is divided into 100 sec bins |
 |
 |
| Module-wise count rates for Quadrant D Data is divided into 100 sec bins |
 |
 |
| Parameter | Plot |
|---|---|
| CZT HV Monitor | 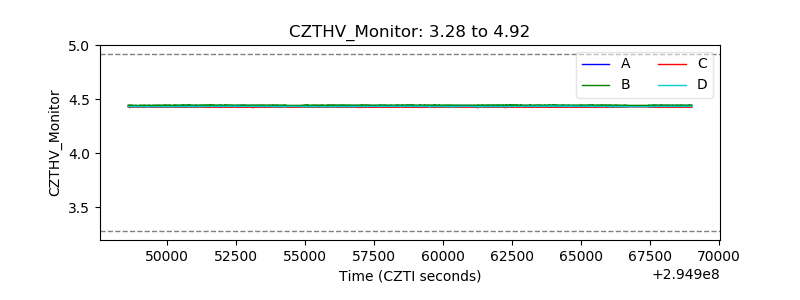 |
| D_VDD | 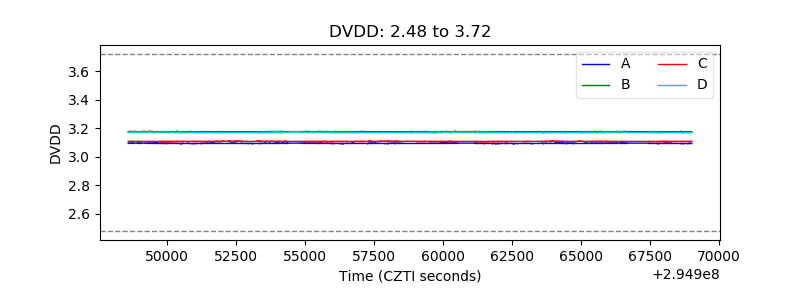 |
| Temperature 1 | 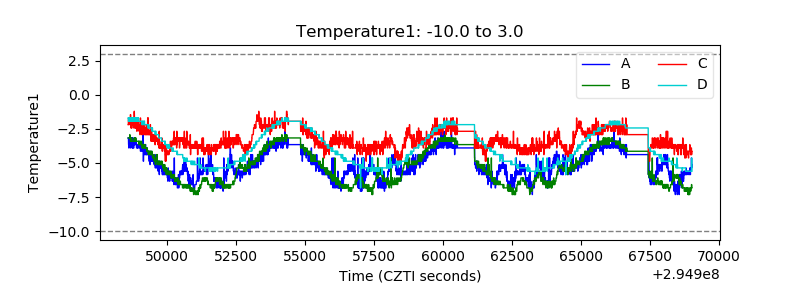 |
| Veto HV Monitor | 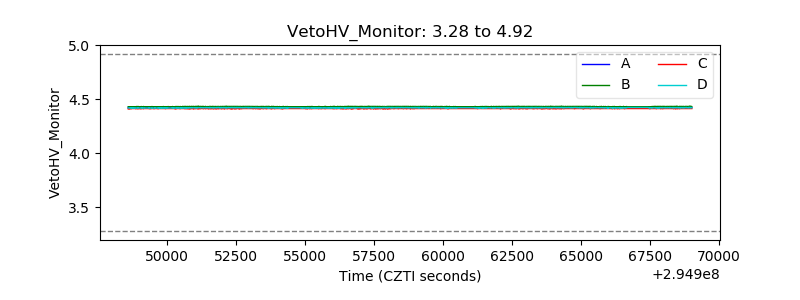 |
| Veto LLD | 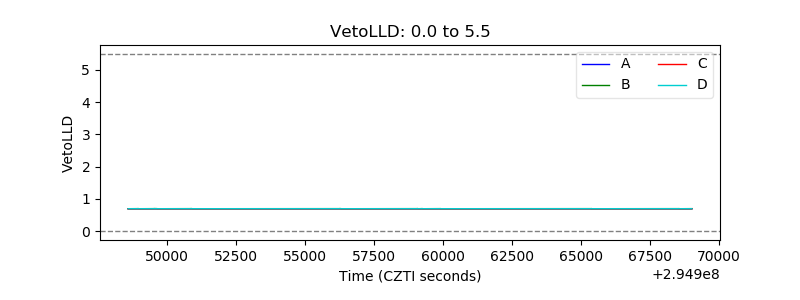 |
| Alpha Counter | 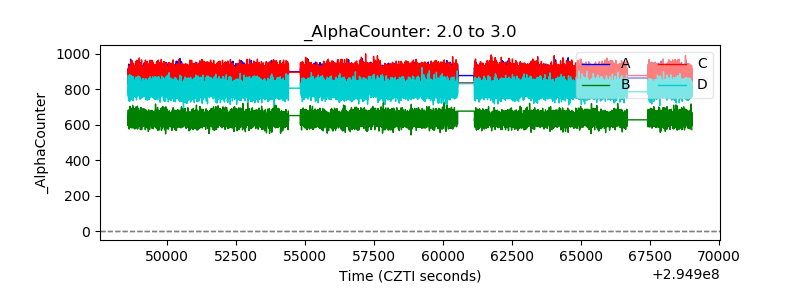 |
| _CPM_Rate | 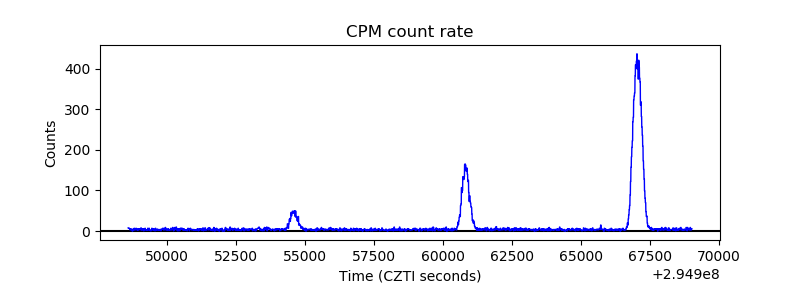 |
| CZT Counter |  |
| +2.5 Volts monitor |  |
| +5 Volts monitor |  |
| _ROLL_ROT | 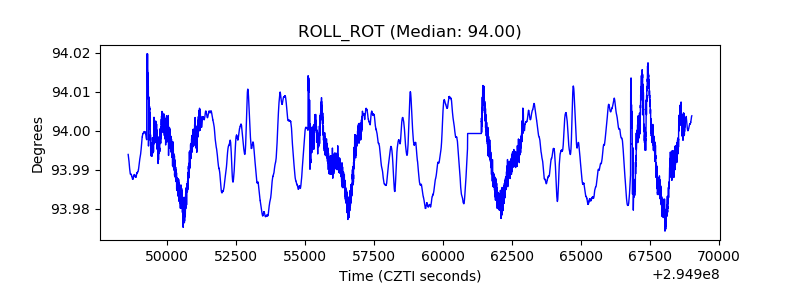 |
| _Roll_DEC | 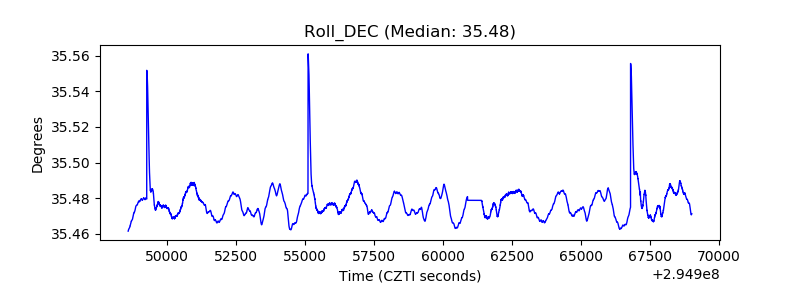 |
| _Roll_RA | 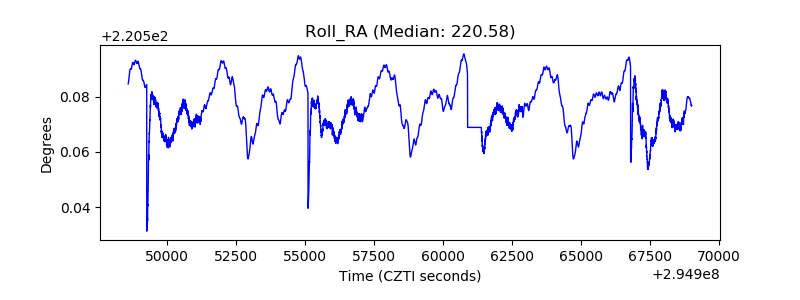 |
| Veto Counter | 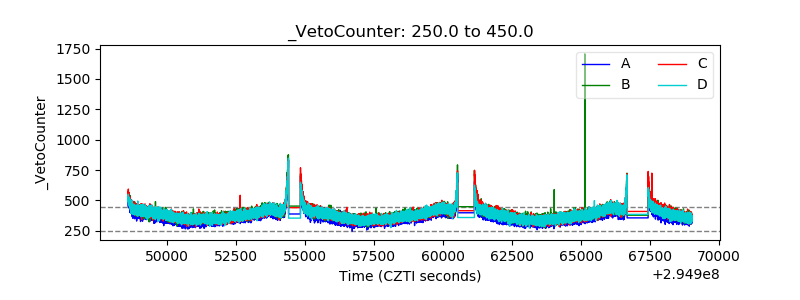 |