| Param | Original file | Final file |
|---|---|---|
| Filename | modeM0/AS1A05_175T01_9000002894_19506cztM0_level2.evt | modeM0/AS1A05_175T01_9000002894_19506cztM0_level2_quad_clean.evt |
| Size (bytes) | 550,748,160 | 100,445,760 |
| Size | 525.2 MB | 95.8 MB |
| Events in quadrant A | 3,267,366 | 654,188 |
| Events in quadrant B | 3,408,871 | 660,838 |
| Events in quadrant C | 3,562,477 | 632,083 |
| Events in quadrant D | 5,956,730 | 598,055 |
| Mode M9 | |||
|---|---|---|---|
| Quadrant | BADHDUFLAG | Total packets | Discarded packets |
| A | 0 | 17 | 0 |
| B | 0 | 17 | 0 |
| C | 0 | 17 | 0 |
| D | 0 | 17 | 0 |
| Mode M0 | |||
|---|---|---|---|
| Quadrant | BADHDUFLAG | Total packets | Discarded packets |
| A | 0 | 14561 | 2 |
| B | 0 | 14761 | 2 |
| C | 0 | 15100 | 2 |
| D | 0 | 22400 | 2 |
| Mode SS | |||
|---|---|---|---|
| Quadrant | BADHDUFLAG | Total packets | Discarded packets |
| A | 0 | 146 | 0 |
| B | 0 | 146 | 0 |
| C | 0 | 146 | 0 |
| D | 0 | 146 | 0 |
| Quadrant | Total seconds | Saturated seconds | Saturation percentage |
|---|---|---|---|
| A | 7135 | 28 | 0.392432% |
| B | 7136 | 57 | 0.798767% |
| C | 7136 | 98 | 1.373318% |
| D | 7136 | 755 | 10.580157% |
Noise dominated data is calculated using 1-second bins in cleaned event files. If a bin has >2000 counts, and if more than 50% of those come from <1% of pixels, then it is considered to be noise-dominated and hence unusable.
| Quadrant | # 1 sec bins | Bins with >0 counts | Bins with >2000 counts | High rate bins dominated by noise | Noise dominated (total time) | Noise dominated (detector-on time) | Marked lightcurve |
|---|---|---|---|---|---|---|---|
| A | 8805 | 7136 | 0 | 0 | 0.00% | 0.00% | 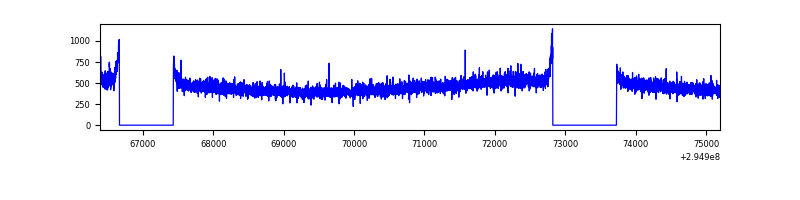 |
| B | 8806 | 7138 | 2 | 2 | 0.02% | 0.03% | 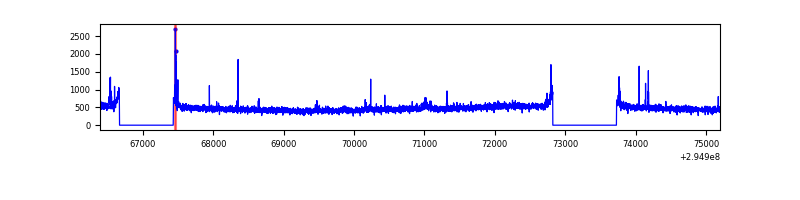 |
| C | 8806 | 7137 | 0 | 0 | 0.00% | 0.00% | 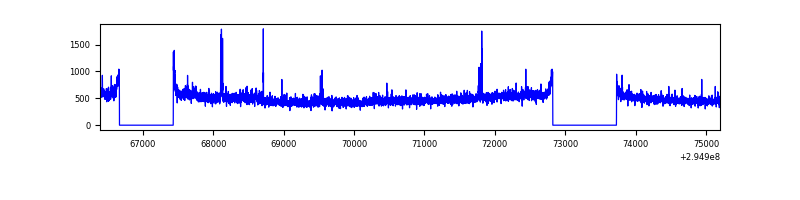 |
| D | 8806 | 7137 | 668 | 668 | 7.59% | 9.36% | 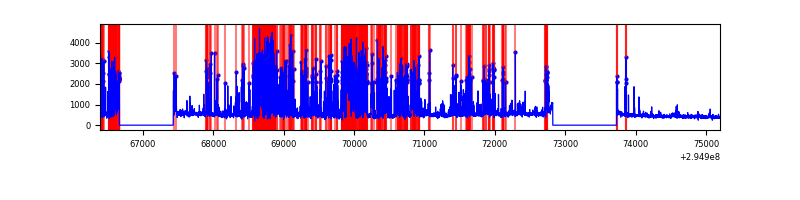 |
Top three noisy pixels from each quadrant. If the there are fewer than three noisy pixels in the level2.evt file, extra rows are filled as -1
| Pixel properties | Quadrant properties | ||||||
|---|---|---|---|---|---|---|---|
| Quadrant | DetID | PixID | Counts | Sigma | Mean | Median | Sigma |
| A | 0 | 226 | 7292 | 37.77 | 847 | 827 | 171.2 |
| A | 3 | 137 | 6872 | 35.32 | 847 | 827 | 171.2 |
| A | 12 | 194 | 5869 | 29.46 | 847 | 827 | 171.2 |
| B | 0 | 198 | 34560 | 207.98 | 843 | 821 | 162.2 |
| B | 3 | 64 | 23433 | 139.39 | 843 | 821 | 162.2 |
| B | 12 | 111 | 20406 | 120.73 | 843 | 821 | 162.2 |
| C | 3 | 233 | 158958 | 817.72 | 817 | 820 | 193.4 |
| C | 14 | 238 | 127914 | 657.19 | 817 | 820 | 193.4 |
| C | 9 | 221 | 48144 | 244.71 | 817 | 820 | 193.4 |
| D | 12 | 218 | 2397095 | 12518.7 | 789 | 766 | 191.4 |
| D | 1 | 52 | 307022 | 1599.92 | 789 | 766 | 191.4 |
| D | 12 | 250 | 73949 | 382.32 | 789 | 766 | 191.4 |
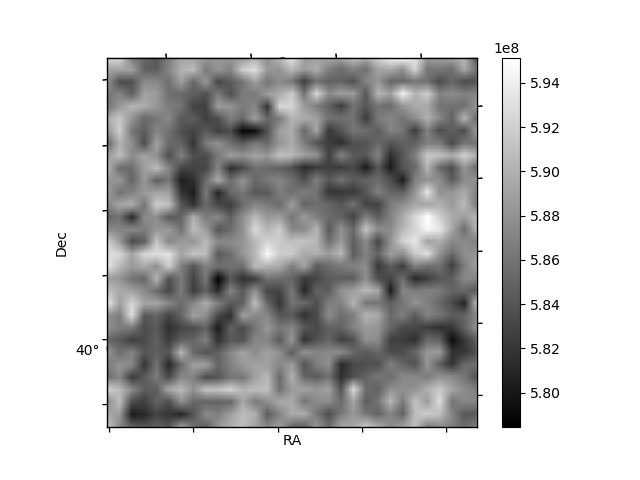
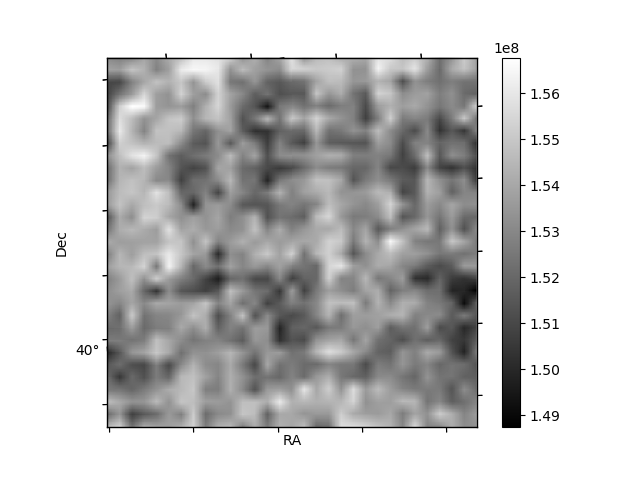
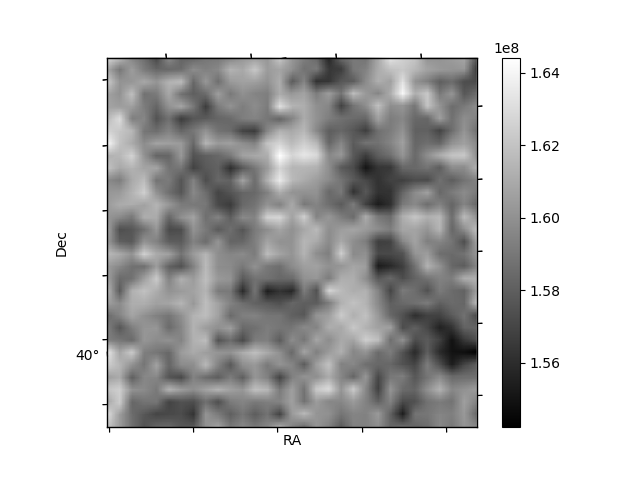
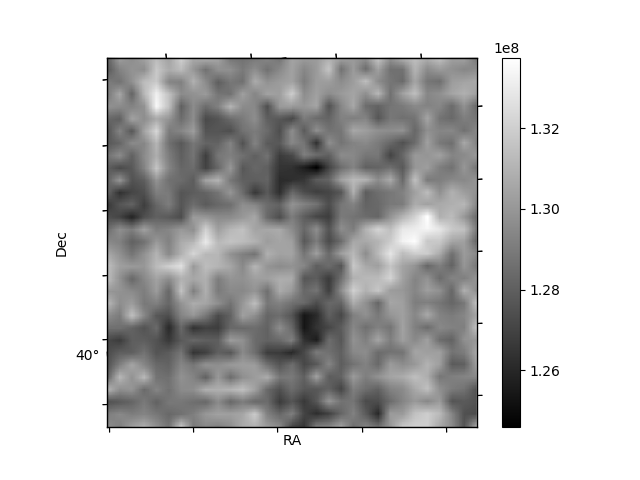
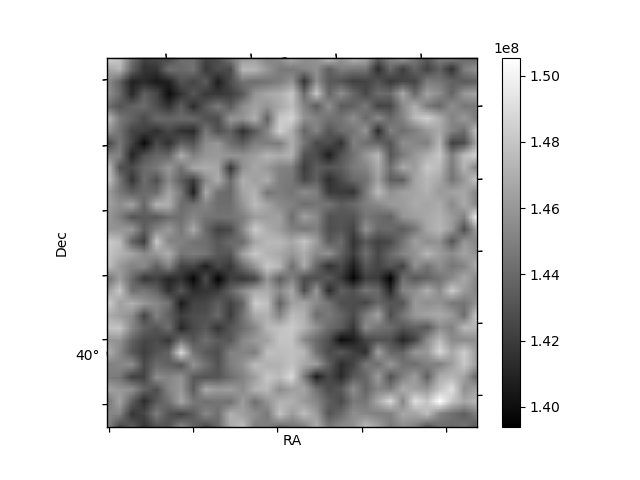
Histogram calculated using DETX and DETY for each event in the final _common_clean file
| Quadrant A | 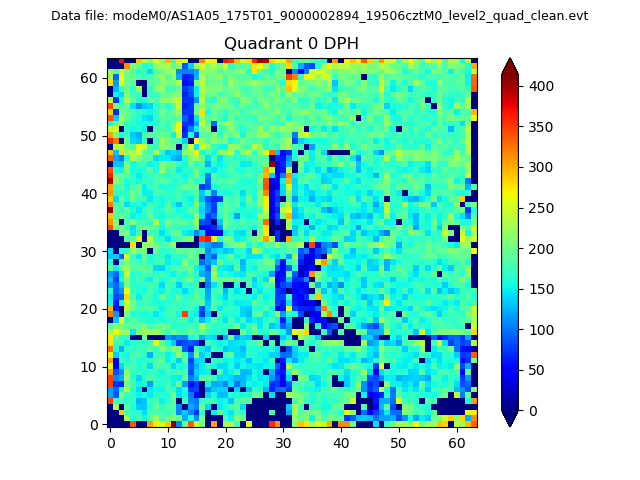 |
 |
Quadrant B |
|---|---|---|---|
| Quadrant D | 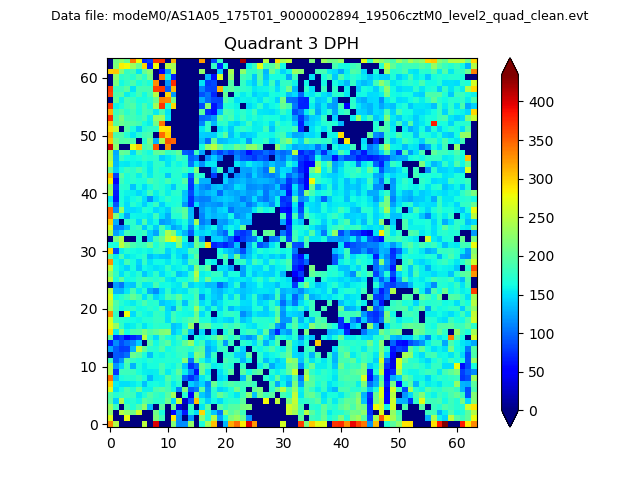 |
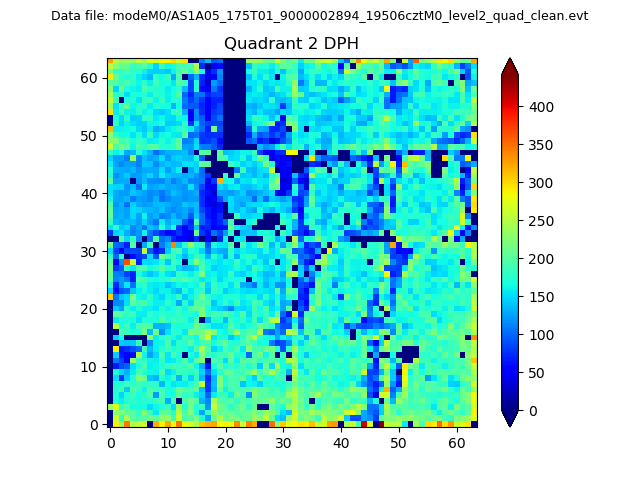 |
Quadrant C |
| Plot type | Count rate plots | Images |
|---|---|---|
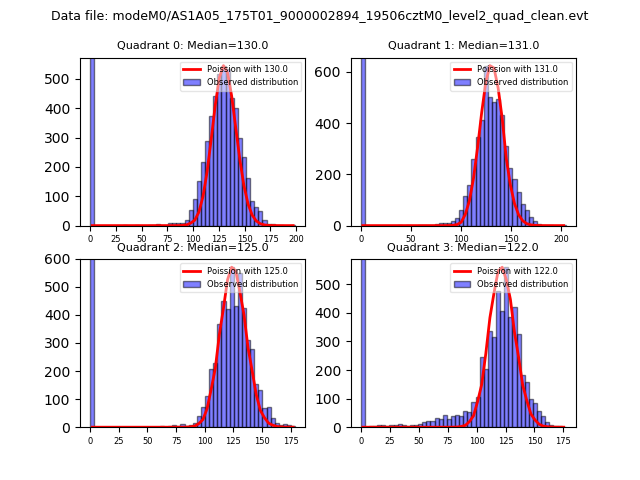
| Comparison with Poisson distribution Blue bars denote a histogram of data divided into 1 sec bins. Red curve is a Poisson curve with rate = median count rate of data. |
 |
 |
| Quadrant-wise count rates Data is divided into 100 sec bins |
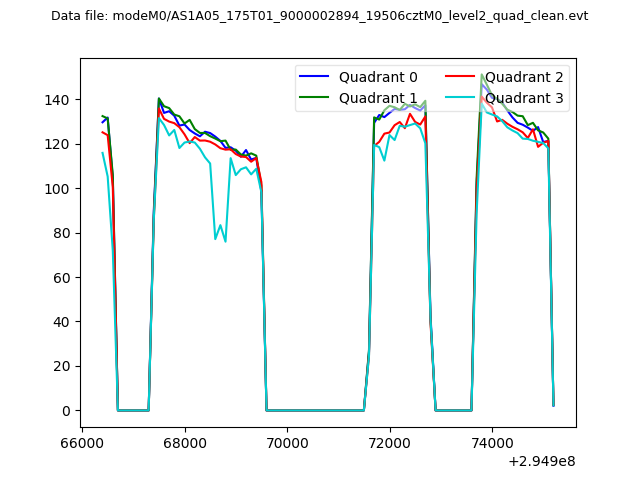 |
|
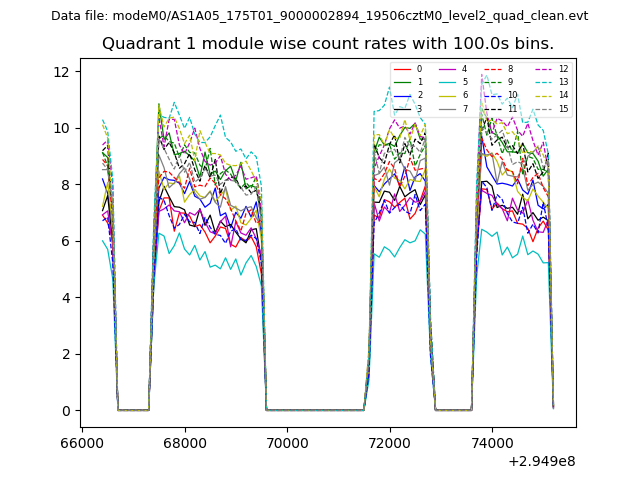
| Module-wise count rates for Quadrant A Data is divided into 100 sec bins |
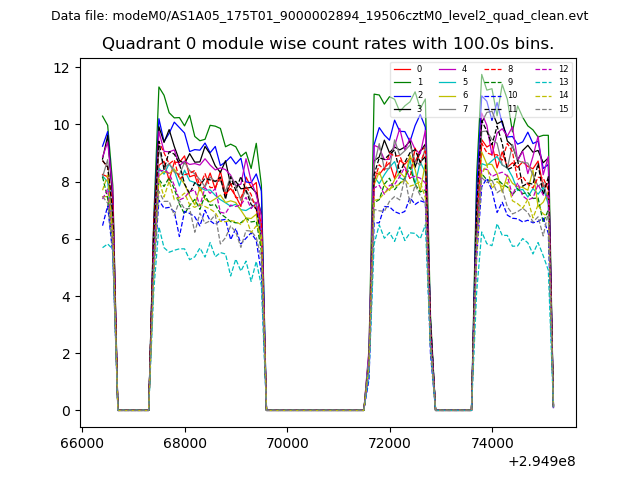 |
 |
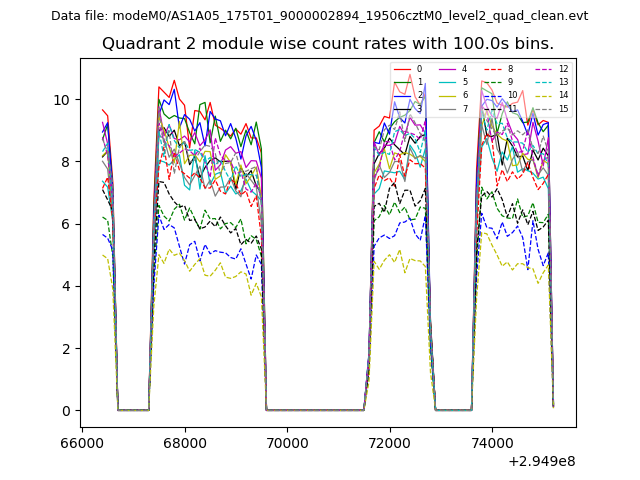
| Module-wise count rates for Quadrant B Data is divided into 100 sec bins |
 |
 |
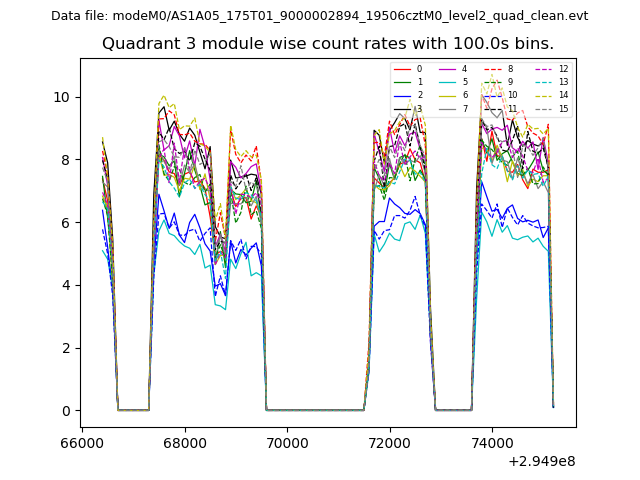
| Module-wise count rates for Quadrant C Data is divided into 100 sec bins |
 |
 |
| Module-wise count rates for Quadrant D Data is divided into 100 sec bins |
 |
 |
| Parameter | Plot |
|---|---|
| CZT HV Monitor | 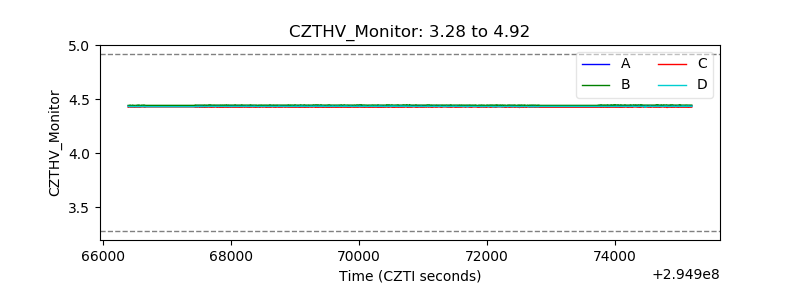 |
| D_VDD | 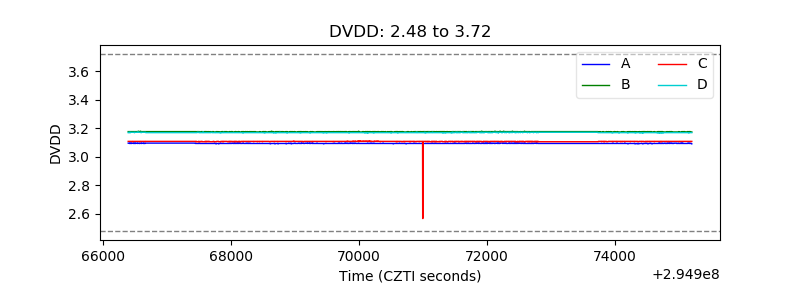 |
| Temperature 1 | 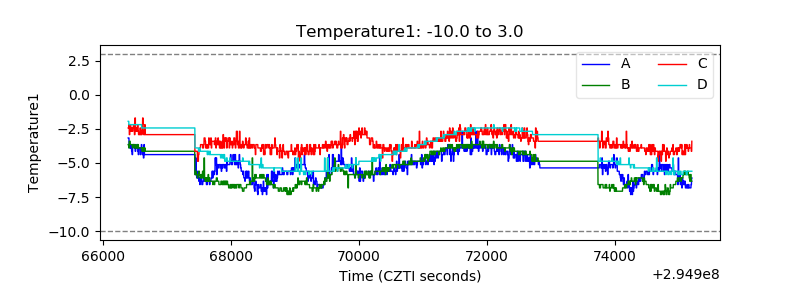 |
| Veto HV Monitor | 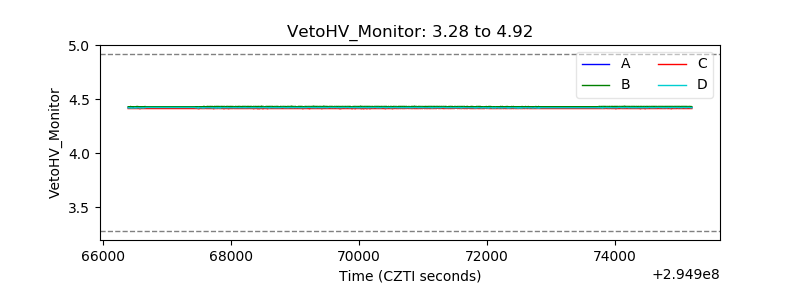 |
| Veto LLD |  |
| Alpha Counter | 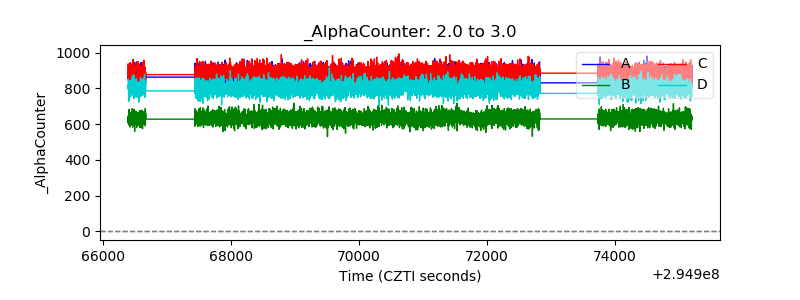 |
| _CPM_Rate |  |
| CZT Counter | 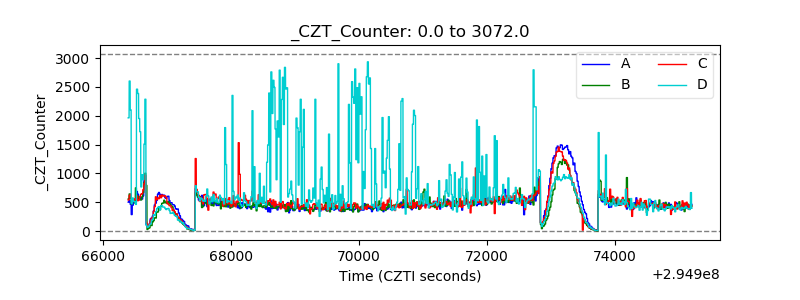 |
| +2.5 Volts monitor |  |
| +5 Volts monitor |  |
| _ROLL_ROT | 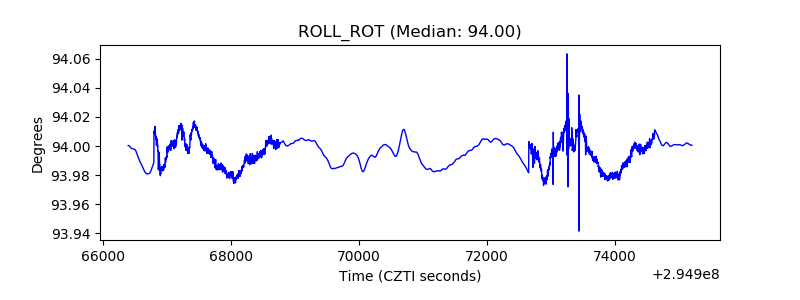 |
| _Roll_DEC |  |
| _Roll_RA | 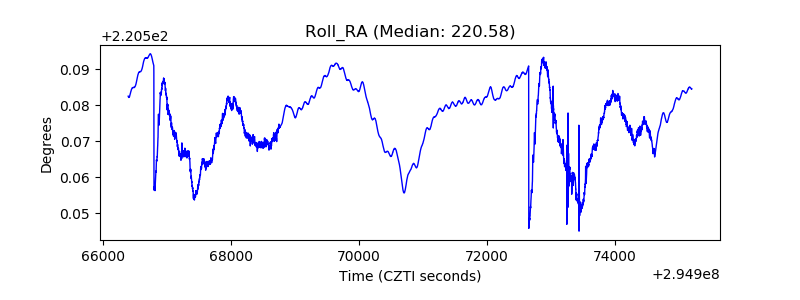 |
| Veto Counter | 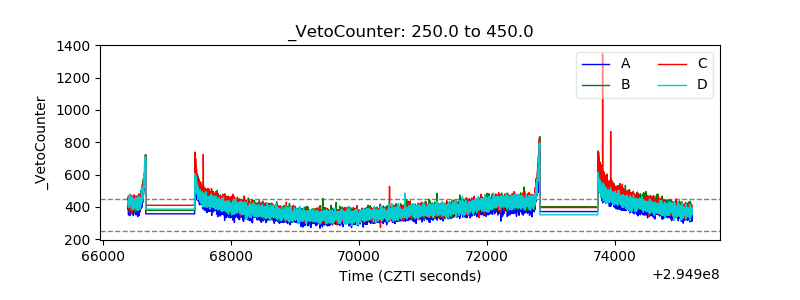 |