| Param | Original file | Final file |
|---|---|---|
| Filename | modeM0/AS1A05_175T01_9000002894_19510cztM0_level2.evt | modeM0/AS1A05_175T01_9000002894_19510cztM0_level2_quad_clean.evt |
| Size (bytes) | 457,390,080 | 82,362,240 |
| Size | 436.2 MB | 78.5 MB |
| Events in quadrant A | 3,290,917 | 528,195 |
| Events in quadrant B | 3,323,251 | 534,058 |
| Events in quadrant C | 3,306,613 | 498,431 |
| Events in quadrant D | 3,500,898 | 491,097 |
| Mode M9 | |||
|---|---|---|---|
| Quadrant | BADHDUFLAG | Total packets | Discarded packets |
| A | 0 | 21 | 0 |
| B | 0 | 22 | 0 |
| C | 0 | 22 | 0 |
| D | 0 | 22 | 0 |
| Mode M0 | |||
|---|---|---|---|
| Quadrant | BADHDUFLAG | Total packets | Discarded packets |
| A | 0 | 13553 | 2 |
| B | 0 | 13596 | 2 |
| C | 0 | 13477 | 2 |
| D | 0 | 14446 | 2 |
| Mode SS | |||
|---|---|---|---|
| Quadrant | BADHDUFLAG | Total packets | Discarded packets |
| A | 0 | 128 | 0 |
| B | 0 | 128 | 0 |
| C | 0 | 128 | 0 |
| D | 0 | 128 | 0 |
| Quadrant | Total seconds | Saturated seconds | Saturation percentage |
|---|---|---|---|
| A | 6339 | 76 | 1.198927% |
| B | 6339 | 79 | 1.246253% |
| C | 6339 | 90 | 1.419782% |
| D | 6339 | 85 | 1.340906% |
Noise dominated data is calculated using 1-second bins in cleaned event files. If a bin has >2000 counts, and if more than 50% of those come from <1% of pixels, then it is considered to be noise-dominated and hence unusable.
| Quadrant | # 1 sec bins | Bins with >0 counts | Bins with >2000 counts | High rate bins dominated by noise | Noise dominated (total time) | Noise dominated (detector-on time) | Marked lightcurve |
|---|---|---|---|---|---|---|---|
| A | 7554 | 6339 | 1 | 1 | 0.01% | 0.02% | 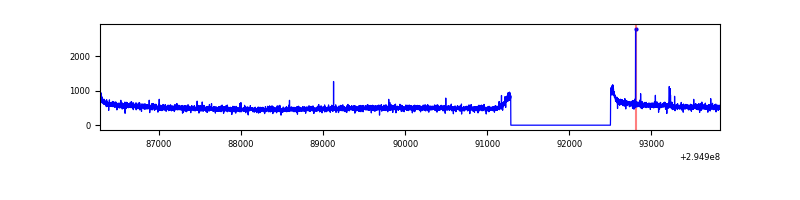 |
| B | 7554 | 6339 | 0 | 0 | 0.00% | 0.00% | 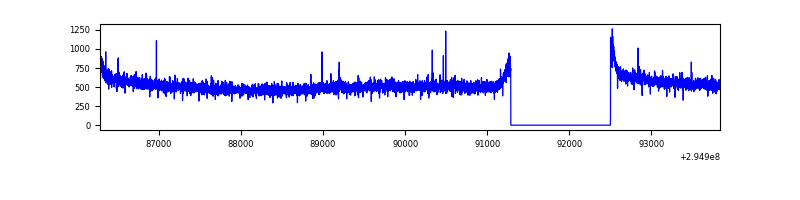 |
| C | 7554 | 6339 | 0 | 0 | 0.00% | 0.00% | 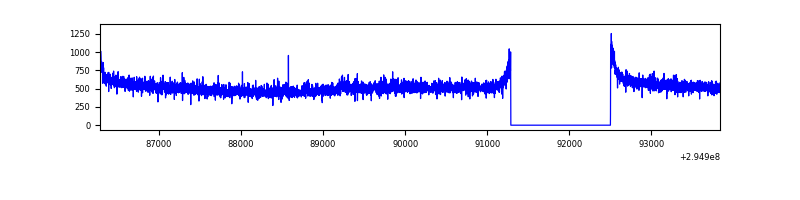 |
| D | 7554 | 6340 | 38 | 38 | 0.50% | 0.60% | 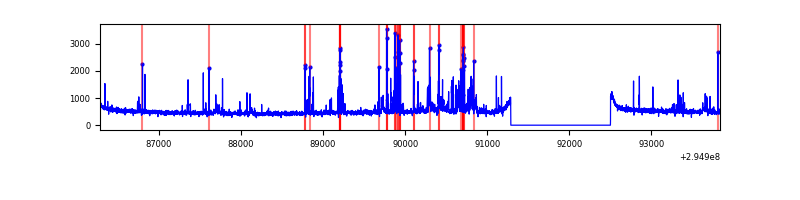 |
Top three noisy pixels from each quadrant. If the there are fewer than three noisy pixels in the level2.evt file, extra rows are filled as -1
| Pixel properties | Quadrant properties | ||||||
|---|---|---|---|---|---|---|---|
| Quadrant | DetID | PixID | Counts | Sigma | Mean | Median | Sigma |
| A | 4 | 2 | 11396 | 61.95 | 852 | 837 | 170.4 |
| A | 0 | 226 | 7438 | 38.73 | 852 | 837 | 170.4 |
| A | 13 | 254 | 7046 | 36.43 | 852 | 837 | 170.4 |
| B | 12 | 111 | 18889 | 114.25 | 845 | 827 | 158.1 |
| B | 11 | 111 | 16762 | 100.8 | 845 | 827 | 158.1 |
| B | 14 | 111 | 15040 | 89.91 | 845 | 827 | 158.1 |
| C | 14 | 238 | 125040 | 673.36 | 798 | 804 | 184.5 |
| C | 3 | 233 | 35634 | 188.78 | 798 | 804 | 184.5 |
| C | 9 | 221 | 34052 | 180.2 | 798 | 804 | 184.5 |
| D | 12 | 218 | 231587 | 1180.32 | 813 | 789 | 195.5 |
| D | 7 | 238 | 87358 | 442.72 | 813 | 789 | 195.5 |
| D | 1 | 52 | 60802 | 306.91 | 813 | 789 | 195.5 |
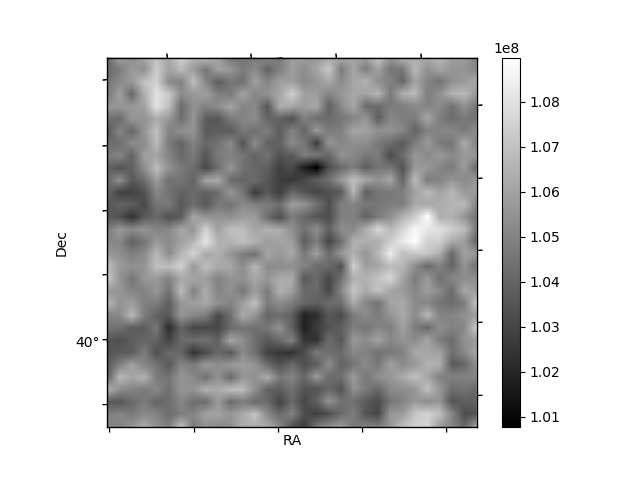
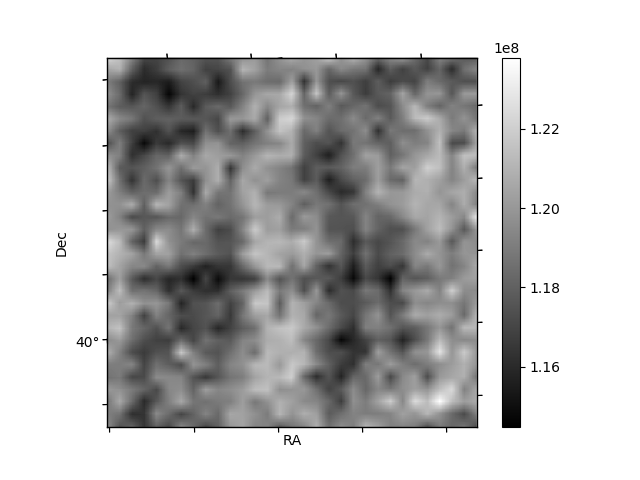
Histogram calculated using DETX and DETY for each event in the final _common_clean file
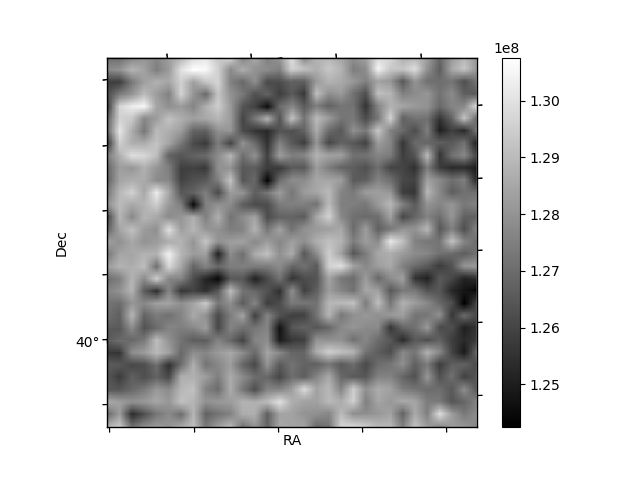
| Quadrant A | 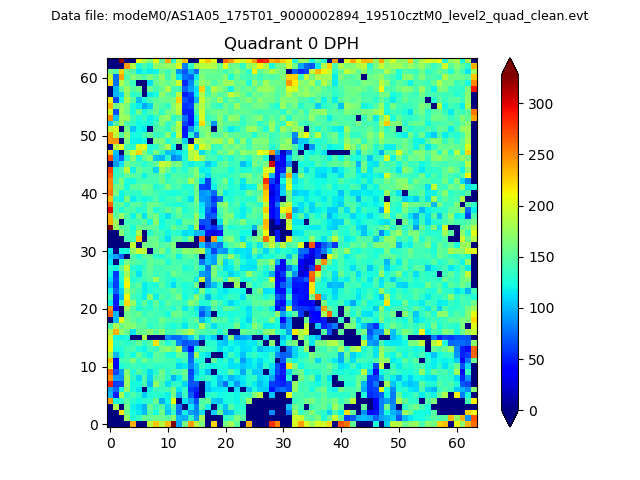 |
 |
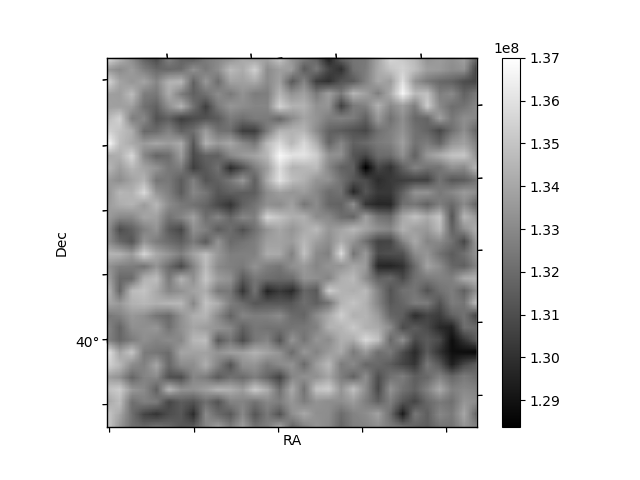
Quadrant B |
|---|---|---|---|
| Quadrant D |  |
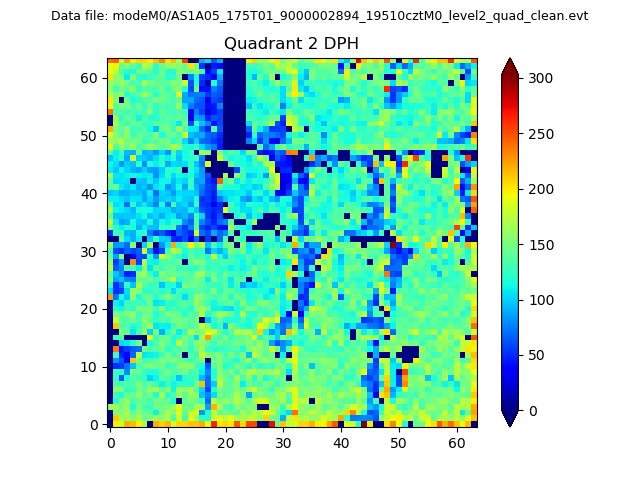 |
Quadrant C |
| Plot type | Count rate plots | Images |
|---|---|---|
| Comparison with Poisson distribution Blue bars denote a histogram of data divided into 1 sec bins. Red curve is a Poisson curve with rate = median count rate of data. |
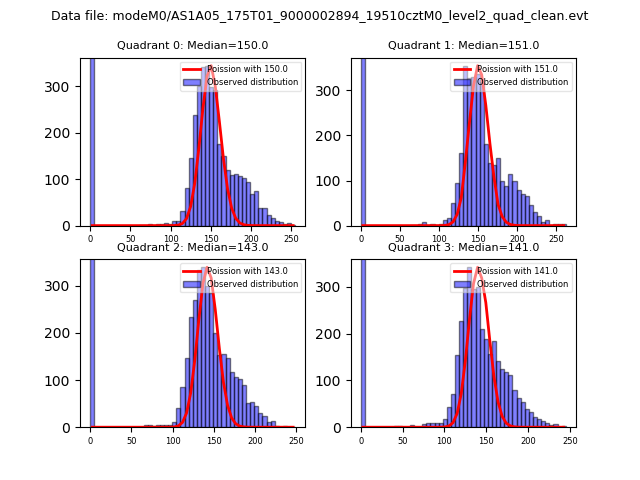 |
 |
| Quadrant-wise count rates Data is divided into 100 sec bins |
 |
|
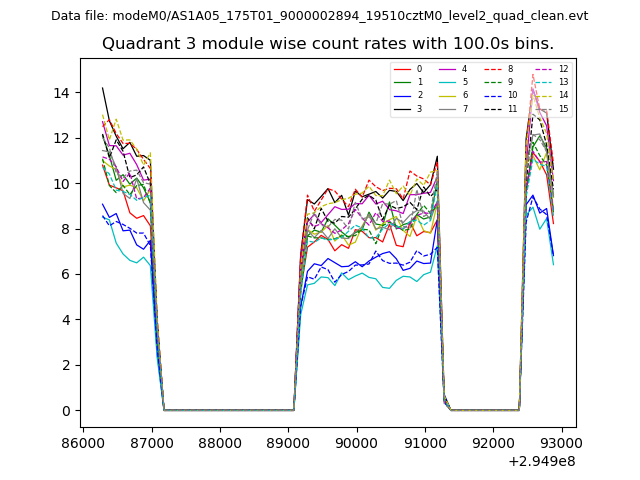
| Module-wise count rates for Quadrant A Data is divided into 100 sec bins |
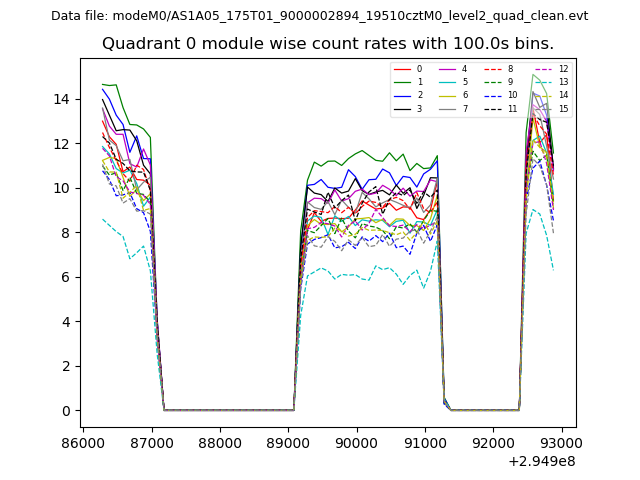 |
 |
| Module-wise count rates for Quadrant B Data is divided into 100 sec bins |
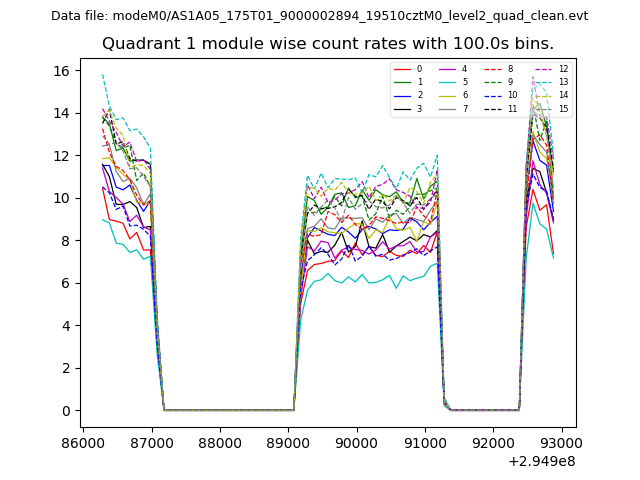 |
 |
| Module-wise count rates for Quadrant C Data is divided into 100 sec bins |
 |
 |
| Module-wise count rates for Quadrant D Data is divided into 100 sec bins |
 |
 |
| Parameter | Plot |
|---|---|
| CZT HV Monitor | 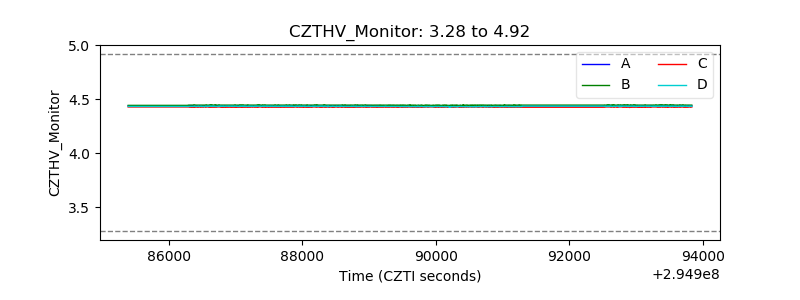 |
| D_VDD | 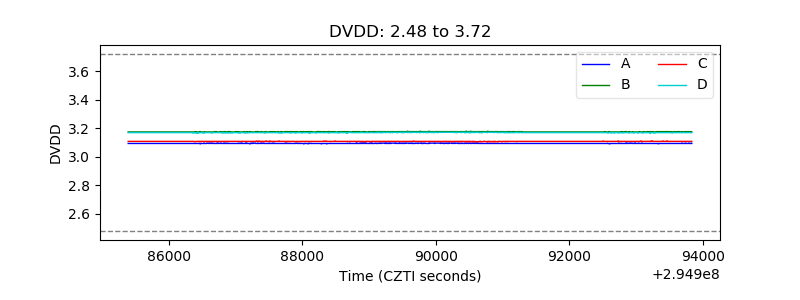 |
| Temperature 1 |  |
| Veto HV Monitor | 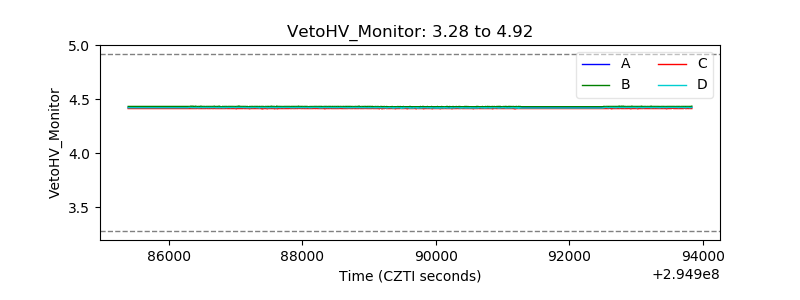 |
| Veto LLD | 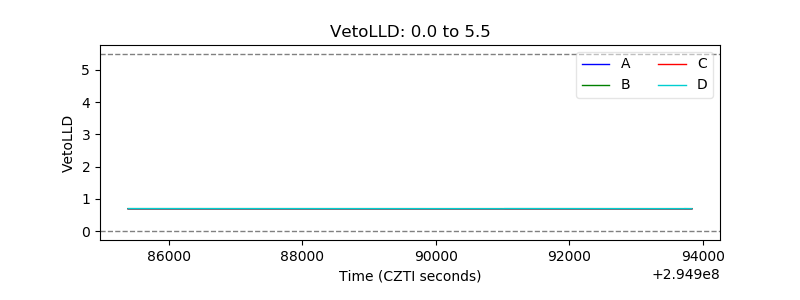 |
| Alpha Counter | 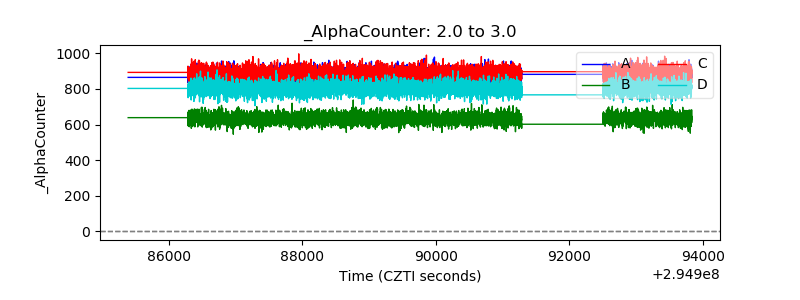 |
| _CPM_Rate | 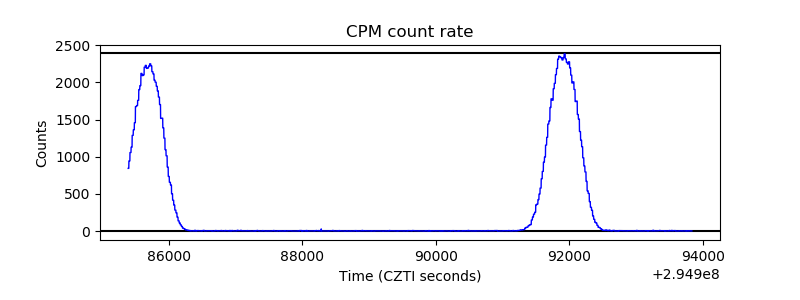 |
| CZT Counter | 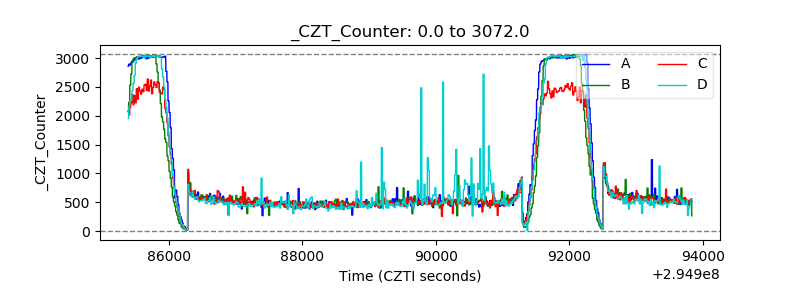 |
| +2.5 Volts monitor |  |
| +5 Volts monitor |  |
| _ROLL_ROT | 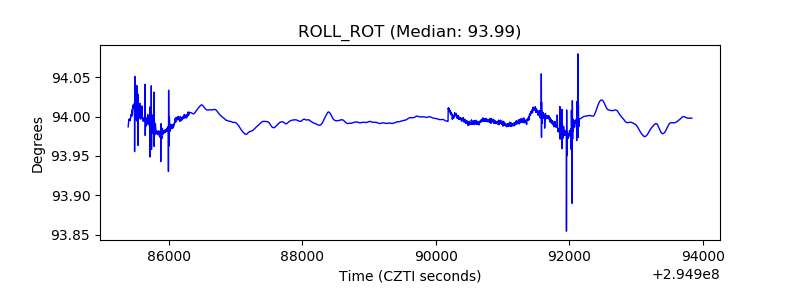 |
| _Roll_DEC | 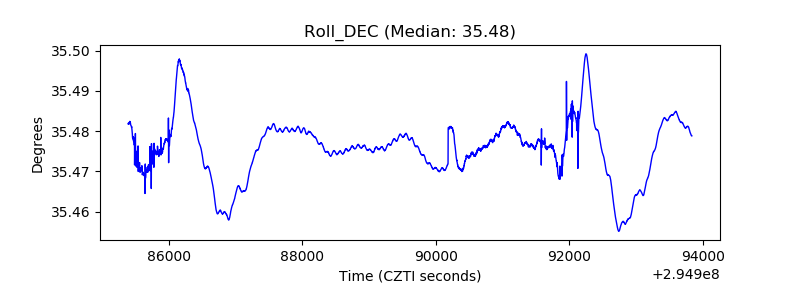 |
| _Roll_RA | 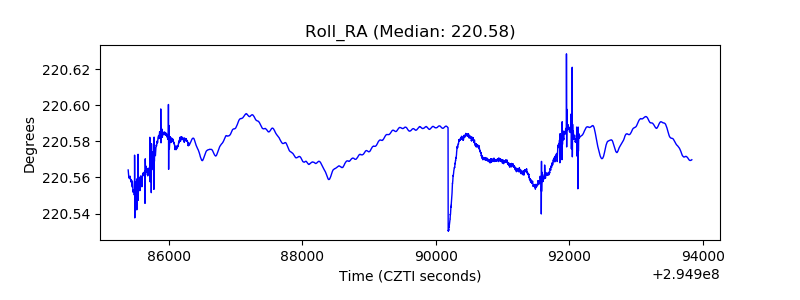 |
| Veto Counter | 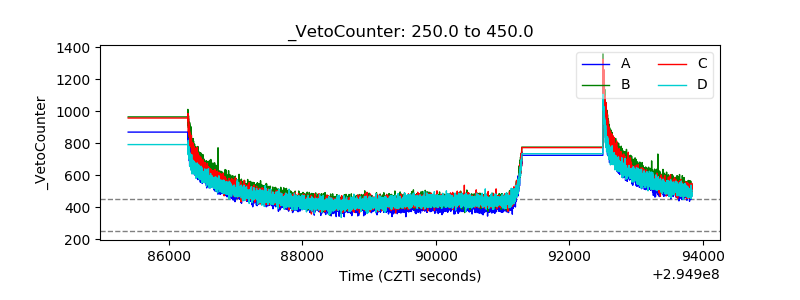 |